* Corresponding author: E-mail: [email protected]
Received: December 27, 2017 Approved: January 3, 2018
How to cite: Soracco CG, Lozano LA, Villarreal R, Melani E, Sarli GO. Temporal variation of soil physical quality under conventional and no-till systems. Rev Bras Cienc Solo. 2018;42:e0170408.
https://doi.org/10.1590/18069657rbcs20170408
Copyright: This is an open-access article distributed under the terms of the Creative Commons Attribution License, which permits unrestricted use, distribution, and reproduction in any medium, provided that the original author and source are credited.
Temporal Variation of Soil Physical
Quality under Conventional and
No-Till Systems
Carlos Germán Soracco(1)
, Luis Alberto Lozano(1)*
, Rafael Villarreal(1)
, Esteban Melani(2) and Guillermo Oliverio Sarli(3)
(1) National Scientific and Technical Research Council, La Plata, Buenos Aires, Argentina. (2)
National Institute of Agricultural Technology, Chascomús, Buenos Aires, Argentina.
(3) Faculty of Agricultural Sciences and Forestry, National University of La Plata, Centro de Investigación de Suelos para la Sustentabilidad Agropecuaria y Forestal, La Plata, Buenos Aires, Argentina.
ABSTRACT: Determination of soil physical quality (SPQ) is very important because it is related to many important soil processes. However, it is not clear which indicators should be considered in this evaluation, and information about temporal variation of SPQ under different soil tillage systems is scarce. The aim of this study was to determine the effects of no tillage (NT) and conventional tillage (CT) on temporal variation of capacity SPQ indicators [bulk density (BD), macroporosity (Pmac), air capacity (AC), plant available water capacity (PAWC), relative field capacity (RFC), Dexter's (S), and structural stability index (SSI)], and dynamic SPQ indicators [field saturated hydraulic conductivity (K0), water-conducting macroporosity (εma), and mesoporosity (εme); and
pore continuity indexes based on water flux of total porosity (CWTP), of macroporosity
(CWmac), and of mesoporosity (Cwmes)]. Additionally, the effect of the soil management
system on corn yield was evaluated. Measurements and determinations were made at four different moments/cropping stages in the corn growing season (BS: before seeding; V6: six leaf stage; R5: physiological maturity; and AH: after harvest). Capacity SPQ indicators were derived from the soil water retention curve determined using sand box and pressure chambers, and dynamic SPQ indicators were derived from field infiltration data measured using a tension disc infiltrometer. Most capacity SPQ indicators were affected by the moment/cropping stage in which samples were taken, but followed similar trends and had similar values under both treatments, particularly in the AH stage. Dynamic SPQ indicators varied differently during the growing season depending on the management system. Under NT, most dynamic indicators increase from BS to V6 and decrease again at AH, whereas under CT, they follow a different trend, decreasing from BS to V6, remaining constant until R5, and increasing at AH. Corn yield was lower under CT (NT: 10,939 kg ha-1
; CT: 8,265 kg ha-1
). These results emphasize the need to include dynamic SPQ indicators, and their temporal variation when evaluating cropping systems with the aim of modeling crop yields. The capacity SPQ indicators were not able to distinguish between treatments.
Keywords: hydraulic conductivity, soil water retention curve, pore continuity index.
INTRODUCTION
Assessing the soil physical quality (SPQ) of the A horizon of the soil is fundamental because soil quality determines many agronomical and environmental processes (Reynolds et al., 2002, 2009) related to crop yield.
Soil physical quality has usually been evaluated through information on organic carbon (OC), bulk density (BD), and soil water retention curve (SWRC) parameters (Reynolds et al., 2002; Dexter, 2004a; Reynolds et al., 2007, 2009). However, inclusion of dynamic indicators that account for water infiltration and movement has been proposed (Iovino et al., 2016; Mentges et al., 2016; Reichert et al., 2016). A capacity parameter gives information about composition of a given soil volume; however, does not describe its functionality (Horn and Kutilek, 2009). In this regard, Lozano et al. (2016) found that capacity indicators measured after crop harvest were not capable of distinguishing the effects of the decompaction of an Argiudoll from the Argentinean pampas region under no tillage in relation to soybean yield.
Singh et al. (2016) found that improvement in SPQ was related to an increase in crop yield. Poor SPQ is related to lower crop performance (Reynolds et al., 2002, 2009). In this regard, Keller et al. (2012) found that crop yield was correlated with hydraulic conductivity (K) in an agricultural field. Reichert et al. (2009) and Suzuki et al. (2013) found that soybean yield was related to the degree of compaction for Alfisols, Ultisols, and Oxisols. These authors emphasized that the optimal values obtained may vary for other crops, or depending on weather conditions. Stepniewski et al. (1994) found that low soil air conductivity may directly affect crop growth and yield, mainly due to lack of adequate aeration. Soil compaction was mentioned as responsible for lower crop yields under NT (Gregorich et al., 1993; Sasal et al., 2006). Other authors found that NT increased plant available water capacity (PAWC) compared to conventional tillage (CT), which resulted in higher corn yield under NT in a soil from the Argentinean pampas region. Alvarez and Steinbach (2009), studying soils from the Argentinean pampas region, concluded that soybean yield was not affected by the tillage system, whereas wheat and corn yields were higher under CT than under reduced tillage and NT without nitrogen fertilization.
Information on temporal variation of SPQ indicators is scarce in the literature (Alletto et al., 2015). Several authors emphasized that soil physical properties show temporal variation (Angulo-Jaramillo et al., 1997; Strudley et al., 2008; Alletto and Coquet, 2009; Hu et al., 2009; Afzalinia and Zabihi, 2014) during the crop season (Angulo-Jaramillo et al., 1997; Bodner et al., 2013) and during the crop rotation sequence (Lozano et al., 2014). Total porosity (TP) and K increase with tillage and decrease during the crop season under CT (Angulo-Jaramillo et al., 1997; Bormann and Klaassen, 2008). Under NT, stabilization of soil properties after some years was reported (Wander and Bollero, 1999; Álvarez et al., 2009a). However, other authors found that soil physical properties vary temporally under NT. Lozano et al. (2014) found that after a long period under NT, the porous system configuration and K of a Argiudoll from the pampas region did not reach steady values, regardless of the specific time in the crop sequence. Moreira et al. (2016) concluded that soil physical properties under NT vary during the crop growing season. Afzalinia and Zabihi (2014) concluded that measuring BD and cone index during the crop growing season gave more accurate data than measuring these parameters at the end of growth season.
We hypothesized that the temporal variability of SPQ indicators during the crop growing season exhibits different behavior under CT than under NT, and that capacity and dynamic SPQ indicators follow different temporal trends during the growing season and depend on the tillage system. Thus, this study aimed to assess the effect of NT and CT systems on the temporal variation of soil physical quality indicators. Additionally, the effect of the soil management system on corn yield was evaluated.
MATERIALS AND METHODS
Soil description and experimental design
The plots studied were located at the agricultural experimental station of INTA (National Institute of Agricultural Technology) in Chascomús, Argentina, at 35° 44’ 37.61” South and 58° 3’ 10.22” West. The climate is temperate, with average annual rainfall of 946 mm. The soil is an abruptic Argiudoll. The A horizon texture is loam (25 % clay, 41.5 % silt, and 33.5 % sand). The OC content of the A horizon was similar among plots, with a value of 2.85 %.
Before the treatments were applied, the plots were under CT and had grown the same crops (corn, sunflower, and winter cover grass) for more than 20 years. In the year 2000, an experimental design with two treatments (NT and CT) was applied. A detailed description of the soil, experimental design, and treatments was provided by Villarreal et al. (2017). From the year 2000 the crops were corn, sunflower, and winter cover grass. The crop for the last 4 years was corn. In October 2014, a glyphosate-resistant hybrid of corn was sown at a row space of 0.75 m. Fertilizers were applied at sowing (80 kg ha-1
monoammonium phosphate + 90 kg ha-1 urea). Weeds were chemically controlled in
both treatments using 3 L ha-1 atrazine + 2 L ha-1 acetochlor at pre-emergence (two days
after sowing, October 2014) and 1.5 kg ha-1 glyphosate (79 %) at post emergence (V10,
January 2015). Two adjacent plots corresponding to NT and CT were studied.
Four moments/cropping stages of the corn growing season were evaluated: October 2014, just after tillage was applied in the CT treatment; before seeding (BS), in December 2014 (V6, 6 leaf stage); in March 2015 (R5, physiological maturity); and after harvest (AH) in June 2015. Manual harvest (four 6-m length rows of each treatment) was used to determine corn yield. Corn yield was normalized to 12 weight % grain moisture content.
Capacity SPQ indicators
Ten intact soil cores (0.05 m height, 0.05 m diameter, 98 × 10-4 m3) from each treatment
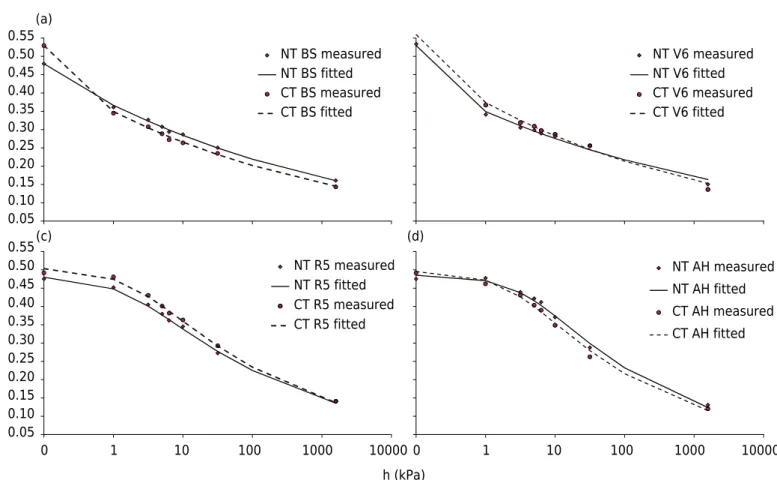
and cropping stage were taken from the 0.00-0.10 m topsoil layer for determination of the soil water retention curve (SWRC). Soil bulk density (BD) and derived total porosity (TP) were determined in the samples (Blake and Hartge, 1986). Values of water retention data at pressure head, h (L), of 0, 0.1, 0.3, 0.5, 0.7, -1.0, -3.0, and -150.0 m were determined using a sand box apparatus for h values between 0 and -1, and a pressure chamber for h values ≤ -3 m. The retention curve (RETC) code (van Genuchten et al., 1991) was used to fit the van Genuchten (1980) model to the water retention data obtained for each soil sample (Figure 1). The R2
values for observed versus fitted values was >0.95 in all cases. The capacity indicators of SPQ (macroporosity, Pmac; air capacity, AC; plant available water capacity, PAWC; and relative field capacity, RFC) were calculated from fitted SWRC data following Reynolds et al. (2009). Dexter's S was determined from SWRC parameters (Dexter, 2004a). The methodology proposed by Pieri (1992) was used to calculate an index that evaluates structural stability (SSI). Finally, the values obtained from each indicator were evaluated in comparison to ranges proposed by different authors (Table 1).
Dynamic SPQ indicators
(Perroux and White, 1988). Five replicates for each treatment and cropping stage were carried out. The full procedure is described in Lozano et al. (2016). Hydraulic conductivity, at the different tensions, h (i.e., K6, K3, and K0), was calculated using the
multiple-tension method (Ankeny et al., 1991).
Water-conducting macroporosity (εma, equivalent r >0.5 mm) and water-conducting
mesoporosity (εme, 0.5> equivalent r >0.25 mm) were determined from K data (Watson
and Luxmoore, 1986).
The continuity of each pore size family (TP; macropores, d >1 mm; and mesopores, 1< diameter <0.5 mm) was calculated according to Lozano et al. (2013). This index (Cw) is the quotient between K and the volumetric fraction of each pore size family, and
it provides valuable information regarding the effects of soil management on soil pore configuration and pore functionality (Soracco et al., 2015; Lozano et al., 2016).
Statistical analysis
For SPQ indicators, analyses of variance (Anova) were used with two factors: the treatment and the cropping stage of sampling. For crop yield, Anova with treatment as factor was used. Means were compared using the LSD test. The distribution of K0 was log-normal,
and then, analyses were carried out on log-transformed values.
RESULTS AND DISCUSSION
Capacity soil physical quality indicators
The values of capacity SPQ indicators for both treatments and different cropping stages of sampling are shown in table 2. From two-way Anova, non-significant interactions between the factors were found, except for BD. This means that these capacity SPQ indicators
0 1 10 100 1000 10000 0 1 10 100 1000 10000
0.05 0.10 0.15 0.20 0.25 0.30 0.35 0.40 0.45 0.50 0.55
NT BS measured NT BS fitted CT BS measured CT BS fitted
NT V6 measured NT V6 fitted CT V6 measured CT V6 fitted
0.05 0.10 0.15 0.20 0.25 0.30 0.35 0.40 0.45 0.50 0.55
h (kPa) (a)
(c) (d)
NT R5 measured NT R5 fitted CT R5 measured CT R5 fitted
θ (m
3 m -3 )
NT AH measured
NT AH fitted
CT AH measured
CT AH fitted
Figure 1. Water retention curves for each treatment and cropping stage of sampling. One representative sample for each treatment
and cropping stage of sampling is shown. Lines represent van Genuchten fits (R2
followed similar temporal trends in both treatments. Capacity SPQ indicators were affected by the cropping stage of sampling and the treatment. This is in disagreement with some previous reports that stated that, under NT, a stabilization without significant changes in soil physical properties is reached after five years (Álvarez et al., 2009a), but in agreement with Moreira et al. (2016), who concluded that soil physical properties under NT show significant temporal variation. These indicators followed similar trends and showed similar values under both treatments, particularly in the AH stage. This indicates that the effects of tillage do not remain until the AH stage, which had been reported for similar soils (Álvarez et al., 2006; Sasal et al., 2006; Álvarez et al., 2009a,b; Soracco et al., 2010, 2012; Lozano et al., 2016). Similar values of Pmac and AC between treatments in the AH stage may be attributed to the effect of harvest traffic on macropores created by tillage. Differences between NT and CT were not evident among these capacity SPQ indicators at the last stage of cropping. The BD was similar between treatments in the BS stage, and followed different trends through the growing season. Under NT, the BD values decreased significantly from BS to V6, and were not statistically different between V6, R5, and AH, whereas under CT, the BD values were not statistically different between BS, V6, and R5, but decreased significantly in the AH stage. Under CT, the soil had optimal values of Pmac (>0.07 m3 m-3
) and AC (>0.14 m3 m-3) from BS to V6, due
to the effect of tillage, and then decreased until R5. These SPQ indicators showed the same behavior under NT.
Table 1. Reference ranges and critical limits of capacity soil physical quality indicators
Indicator(1)
Critical limits Reference
BD
0.9≥ BD ≥1.2 Mg m-3
,optimal BD range for maximum field crop production
in fine- to medium-textured soils.
1.2≤ BD <1.25 Mg m-3
,good BD
BD ≥1.25, poor values of BD potentially reduces crop yield due to
inadequate soil aeration
BD <0.9 Mg m-3, poor values of BD potentially reduces crop yield due to
inadequate plant anchoring, reduced PAWC, and unsaturated flow of water
and solutes.
Reynolds et al. (2008), Reynolds et al. (2009)
Pmac
Pmac ≥0.07 m3
m-3, optimal values of macroporosity, which indirectly
indicate the soil’s ability to quickly drain excess water and facilitate root
proliferation.
0.04≤ Pmac <0.07 m3
m-3
, good value
Pmac <0.04 m3
m-3
, poor value, soil degraded by compaction.
Reynolds et al. (2008), Reynolds et al. (2009)
AC
AC >0.14 m3
m-3
, optimal/ideal value for minimum susceptibility to
crop-damaging or yield-reducing aeration deficits in the root zone
0.10≤ AC <0.14 m3
m-3, good value
AC <0.10 m3
m-3
, poor value
Reynolds et al. (2009), White
(2006)
PAWC
PAWC >0.20 m3
m-3, “ideal” for maximal root growth and function
0.15≤ PAWC <0.20 m3
m-3
, good for root growth and function
0.10≤ PAWC <0.15 m3
m-3
, limited for root growth and function
PAWC <0.10 m3
m-3
, poor for root growth and function
Reynolds et al. (2009)
RFC
0.6≤ RFC ≤0.7, ideal values, indicate optimal balance between root-zone
soil water capacity and soil air capacity RFC <0.6, poor value, indicate water limited soil
RFC >0.7, poor value, indicate aeration limited soil
Reynolds et al. (2008), Reynolds et al. (2009)
S index
S ≥0.050, optimal/ideal soil physical or structural quality 0.035≤ S ≤0.050, good physical quality
0.020≤ S ≤0.035, poor physical quality S ≤0.020, very poor or degraded physical quality
Dexter (2004b), Dexter and Czyż (2007)
SSI
SSI >9 %, optimal value, indicates stable structure
7≤ SSI ≤9 %, very good values, indicate low risk of structural degradation 5≤ SSI ≤ 7%, good values, although indicate high risk of degradation
SSI ≤5 %, poor values, indicate structurally degraded soil
Pieri (1992)
The PAWC was poor (PAWC <0.15 m3
m-3) from BS to V6, but had ideal values (PAWC >0.20 m3 m-3) from R5 to AH, in both treatments. This can be attributed to a change
in pore size distribution. In the CT treatment, this can be attributed to rearrangement of tillage-generated clods. The value of RFC was greater than the optimal values (0.6≤ RFC ≤0.7) from R5 to AH in both treatments, which is considered to be a limited aeration soil (Reynolds et al., 2009). The SPQ indicator S also increased from V6 to R5 in both treatments, arriving in the range of optimal values (S ≥0.050) at R5. In contrast, the values of SSI were always within the range of very good values (7≤ SSI ≤9 %) in both treatments.
Capacity SPQ indicators and their optimal ranges and critical values were not capable of distinguishing between treatments. Similar results were obtained by Lozano et al. (2016).
Dynamic soil physical quality indicators and pore continuity indexes based
on water flux
The values of K0, dynamic SPQ indicators, and Cw for both NT and CT in accordance with
the cropping stage of sampling are shown in table 3. From two-way Anova, a significant interaction between treatment factors and cropping stage of sampling was found for all dynamic SPQ indicators. This means that these indicators followed different temporal trends depending on the tillage system.
The K0 followed a trend similar to εma in both treatments. Several authors (Capowiez et al.,
2009; Soracco et al., 2011; Lozano et al., 2016) reported that both variables are highly correlated. Under CT, K0, εma, and CwTP exhibited higher values at the BS stage, just after
tillage practices were applied, decreasing in V6, and increasing again in AH, whereas Cwmac showed a different behavior, with a higher value in AH. These results show
that in this soil, tillage practices have low persistence, and that the improvements in pore connectivity and in hydraulic properties induced by the machinery did not remain through the crop growing season. The increase in Cwmac in AH may be attributed to the
decrease in the volume of macropores and the slight increase in K0. This implies that
the remaining macropores have better connectivity. These results are in agreement with some previous reports from the Pampas region (Álvarez et al., 2006) and from other regions (Angulo-Jaramillo et al., 1997; Bormann and Klaassen, 2008). These studies concluded that K0 increases with tillage and then decreases during the growing season
due to the settling of the soil structure.
Table 2. Capacity SPQ indicators (mean values ± standard deviations) for the different treatments (NT and CT) and cropping stages
of the corn growing season (BS, V6, R5, and AH)
Treatment Cropping stage BD(1) Pmac AC PAWC RFC S SSI
Mg m-3 m3 m-3 m3 m-3 m3 m-3 %
NT
BS 1.24±0.04 a+(2) 0.06±0.01 b+ 0.15±0.01 b++ 0.10±0.01 c- 0.68±0.02 c+ 0.034±0.004 d- 7.2 c+
V6 1.12±0.03 b++ 0.07±0.004 a++ 0.15±0.01 b++ 0.09±0.01 c- 0.67±0.01 c+ 0.033±0.003 d- 8.6 a+
R5 1.10±0.02 b++ 0.01±0.002 c- 0.07±0.01 c- 0.19±0.01 b+ 0.84±0.02 b- 0.056±0.004 b++ 8.7 a+
AH 1.09±0.01 b++ 0.01±0.003 c- 0.06±0.02 d- 0.21±0.01 a++ 0.88±0.04 a- 0.063±0.008 a++ 7.6 b+
CT
BS 1.21±0.04 a+ 0.07±0.008 a++ 0.17±0.01 a++ 0.12±0.01 c- 0.65±0.01 c- 0.043±0.002 c+ 7.2 c+
V6 1.24±0.05 a+ 0.08±0.007 a++ 0.18±0.01 a++ 0.11±0.01 c- 0.64±0.02 c- 0.040±0.003 c+ 7.6 b+
R5 1.24±0.05 a+ 0.01±0.002 c- 0.08±0.01 c- 0.20±0.01 b++ 0.84±0.02 b- 0.059±0.005 b++ 7.8 b+
AH 1.08±0.03 ab+ 0.01±0.003 c- 0.07±0.02 c- 0.22±0.02 a++ 0.85±0.03 b- 0.065±0.006 a++ 7.5 b+
(1) BD was determined by Blake and Hartge (1986) method; Pmac, AC, PAWC, and RFC were calculated from fitted SWRC data following Reynolds et al. (2009); S index was determined following Dexter (2004a); SSI index was determined by Pieri (1992). (2)
Under NT, the dynamic SPQ indicators and Cw values followed a different trend than under CT. The values of K0, εma, εme, and CwTP increased significantly from BS to V6,
remaining high until R5, and then decreasing in AH until reaching values similar to the initial ones. In contrast, Cwmac and Cwmes increased until R5, and then decreased
in AH to values higher than the initial values in the BS stage. The increase in εma and
εme from BS to V6 can be attributed to decay of the roots of the previous crop (corn)
during the season studied. Corn roots have been reported to create vertical macropores (Lozano et al., 2014). The decrease in K0 and in pore size fractions and connectivity
in AH can be attributed to the high traffic intensity associated with harvest (Soracco, 2009; Soracco et al., 2012). Furthermore, root growth of the current crop may have blocked some pores.
The results show that under both treatments, the properties studied have strong differences depending on the cropping stage at which sampling occurs. Even when under NT, there was crop induced improvement in K and in porosity, but these changes did not persist in AH, which is probably related to the initially poor physical condition of the soil before NT was adopted (Ferreras et al., 2000; Fabrizzi et al., 2005).
Overall, the dynamic SPQ indicators were able to detect changes in the soil due to tillage practices, and different temporal dynamics of the soil. The Cw proved to be particularly useful as an SPQ indicator since it integrates dynamic and capacity information in a single value.
Crop yields
Mean crop yields were as follow: NT = 10,939 kg ha-1
and CT = 8,265 kg ha-1
; the latter was significantly lower. Similar results were reported in studies from the Pampas region (Kleine and Puricelli, 2001) and from other regions (Javeed et al., 2013). However, some studies reported the opposite (Blevins et al., 1983; Munkholm et al., 2013; Afzalinia and Zabihi, 2014), and other studies found similar corn yields between NT and CT (Echeverría and Sainz Rojas, 2001; Elissondo et al., 2001). The lack of agreement between different studies may be due to the effects of different weather conditions. In a ten-year study, Bailey et al. (1996) found that the corn yield was higher, lower, or similar between NT and CT depending on the weather conditions.
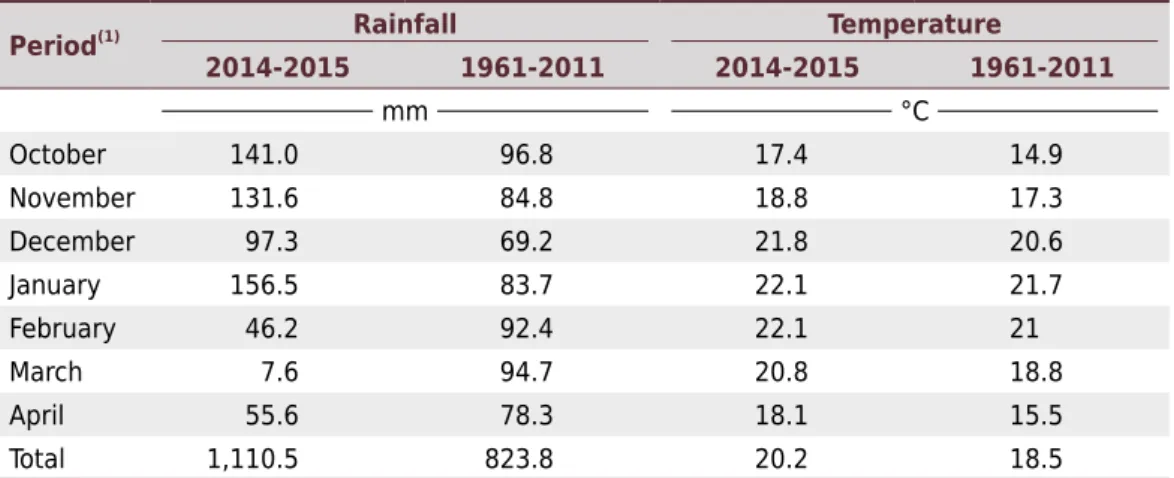
Total rainfall and average monthly temperatures between sowing (October) and harvest (April) are shown in table 4. Plant emergence was favored by high values of air temperature and rainfall (October). Mean air temperatures were higher than the 40-year-average
Table 3. Dynamic SPQ indicators (mean values and standard deviations) for the different treatments (NT, CT) and cropping stages
of the corn growing season (BS, V6, R5, and AH)
Treatment Cropping
stage K0
(1)
εma εme CwTP Cwmac Cwmes
cm h-1 % %
cm h-1
cm h-1
cm h-1
NT
BS 1.57±0.6 c**
0.0008±0.0002 c 0.0014±0.0002 bc 3.17±0.16 c 64.61±3.91 c 17.50±0.72 c
V6 3.23±1.1 ab 0.0013±0.0003 b 0.0018±0.0003 a 6.01±0.16 a 92.04±2.39 c 20.55±1.37 b
R5 3.23±0.9 ab 0.0012±0.0002 b 0.0024±0.0006 a 5.87±0.17 a 254.81±9.51 a 26.60±2.34 a
AH 1.67±0.4 c 0.0009±0.0001 c 0.0011±0.0003 bc 2.98±0.10 c 150.29±4.56 b 23.24±3.45 a
CT
BS 3.75±1.2 a 0.0022±0.0004 a 0.0021±0.0005 a 7.13±0.30 a 70.59±4.05 c 26.92±0.86 a
V6 1.83±0.4 c 0.0015±0.0003 b 0.0008±0.0002 c 3.25±0.18 c 28.45±1.34 d 19.15±1.16 b
R5 1.73±0.6 c 0.0014±0.0002 b 0.0009±0.0003 c 3.08±0.09 c 72.89±3.46 c 22.96±4.54 b
AH 2.40±0.8 bc 0.0019±0.0001 a 0.0006±0.0001 c 4.47±0.08 b 234.75±8.45 a 13.87±1.25 c
(1)
Saturated hydraulic conductivity (K0), water-conducting macro- and mesoporosity (εma, and εme, respectively), and pore continuity indexes based on water flux for total porosity, macroporosity, and mesoporosity (CwTP, Cwmac, and Cwmes, respectively). **
temperatures throughout the crop growing period. The 40-year-average rainfall (1961-2011) in the period studied was 823.8 mm, whereas in 2014-2015, average rainfall was 1,110.5 mm. However, the distribution was inadequate, with very high rainfall amounts from October to January, and very low rainfall amounts from February to April. The rainfall was particularly low in March (7.6 mm versus a historic average of 94.7 mm), and the temperature was two degrees higher than the historic average. This led to a higher water deficit in this period. In March, the crop was in the last reproductive stages, which mainly determine grain weight and thus crop yield.
The difference in crop yield between NT and CT may be attributed to several factors, including weather conditions, weed population, and competition, soil quality, and others. Predicting crop yield is very complex, and models including all these factors are the best tool.
Our results indicate that including temporal variability of SPQ indicators, particularly dynamic SPQ indicators, is useful for better predicting crop yield through modelling. The capacity SPQ indicators were not able to distinguish between treatments.
CONCLUSIONS
The tillage system affects the temporal dynamics of soil physical quality during the growing season. Both capacity and dynamic SPQ indicators vary temporally under NT and CT. Dynamic indicators are the most affected, and they vary differently during the growing season depending on the management system.
REFERENCES
Afzalinia S, Zabihi J. Soil compaction variation during growing season under conservation tillage. Soil Till Res. 2014;137:1-6. https://doi.org/10.1016/j.still.2013.11.003
Alletto L, Coquet Y. Temporal and spatial variability of soil bulk density and near-saturated
hydraulic conductivity under two contrasted tillage management systems. Geoderma. 2009;152:85-94. https://doi.org/10.1016/j.geoderma.2009.05.023
Alletto L, Pot V, Giuliano S, Costes M, Perdrieux F, Justes E. Temporal variation in soil physical
properties improves the water dynamics modelling in a conventionally-tilled soil. Geoderma. 2015;243-244:18-28. https://doi.org/10.1016/j.geoderma.2014.12.006
Álvarez CR, Duggan MT, Chamorro ER, D’ambrosio D, Taboada MA. Descompactación de suelos franco limosos en siembra directa: efectos sobre las propiedades edáficas y los cultivos. Ci
Suelo. 2009b;27:159-69.
Table 4. Monthly weather values during the period studied
Period(1) Rainfall Temperature
2014-2015 1961-2011 2014-2015 1961-2011
mm °C
October 141.0 96.8 17.4 14.9
November 131.6 84.8 18.8 17.3
December 97.3 69.2 21.8 20.6
January 156.5 83.7 22.1 21.7
February 46.2 92.4 22.1 21
March 7.6 94.7 20.8 18.8
April 55.6 78.3 18.1 15.5
Total 1,110.5 823.8 20.2 18.5
(1)
Álvarez CR, Taboada MA, Boem FHG, Bono A, Fernandez PL, Prystupa P. Topsoil properties as affected by tillage systems in the Rolling Pampa region of Argentina. Soil Sci Soc Am J.
2009a;73:1242-50. https://doi.org/10.2136/sssaj2008.0246
Álvarez CR, Taboada MA, Bustingorri C, Boem G, Hernán F. Descompactación de suelos
en siembra directa: efectos sobre las propiedades físicas y el cultivo de maíz. Ci Suelo. 2006;24:1-10.
Alvarez R, Steinbach HS. A review of the effects of tillage systems on some soil physical properties, water content, nitrate availability and crops yield in the Argentine Pampas. Soil Till
Res. 2009;104:1-15. https://doi.org/10.1016/j.still.2009.02.005
Angulo-Jaramillo R, Thony JL, Vachaud G, Moreno F, Fernandez-Boy E, Cayuela JA, Clothier BE.
Seasonal variation of hydraulic properties of soils measured using a tension disk infiltrometer. Soil Sci Soc Am J. 1997;61:27-32. https://doi.org/10.2136/sssaj1997.03615995006100010005x Ankeny MD, Ahmed M, Kaspar TC, Horton R. Simple field method for determining
unsaturated hydraulic conductivity. Soil Sci Soc Am J. 1991;55:467-70.
https://doi.org/10.2136/sssaj1991.03615995005500020028x
Bailey TB, Swan JB, Higgs RL, Paulson WH. Long-Term tillage effects on continuous yields. In: 8th
Annual conference proceedings - Annual conference on applied statistics in agriculture; 28-30 April 1996; Manhattan, Kansas. Manhattan: Kansas State University Libraries; 1996. p. 17-32.
Blake GR, Hartge KH. Bulk density. In: Klute A, editor. Methods of soil analysis. Physical and mineralogical methods. 2nd ed. Madison: American Society of Agronomy; 1986. Pt 1. p. 363-75. Blevins RL, Thomas GW, Smith MS, Frye WW, Cornelius PL. Changes in soil properties
after 10 years continuous non-tilled and conventionally tilled. Soil Till Res. 1983;3:135-46. https://doi.org/10.1016/0167-1987(83)90004-1
Bodner G, Scholl P, Loiskandl W, Kaul H-P. Environmental and management influences on
temporal variability of near saturated soil hydraulic properties. Geoderma. 2013;204-205:120-9. https://doi.org/10.1016/j.geoderma.2013.04.015
Bormann H, Klaassen K. Seasonal and land use dependent variability of soil hydraulic and soil hydrological properties of two Northern German soils. Geoderma. 2008;145:295-302. https://doi.org/10.1016/j.geoderma.2008.03.017
Capowiez Y, Cadoux S, Bouchant P, Ruy S, Roger-Estrade J, Richard G, Boizard H. The effect
of tillage type and cropping system on earthworm communities, macroporosity and water
infiltration. Soil Till Res. 2009;105:209-16. https://doi.org/10.1016/j.still.2009.09.002 Dexter AR. Soil physical quality - Part I: theory, effects of soil texture, density, and organic matter, and effects on root growth. Geoderma. 2004a;120:201-14.
https://doi.org/10.1016/j.geoderma.2003.09.004
Dexter AR. Soil physical quality - Part II: friability, tillage, tilth and hard-setting. Geoderma.
2004b;120:215-25. https://doi.org/10.1016/j.geoderma.2003.09.005
Dexter AR, Czyż EA. Applications of S-theory in the study of soil physical degradation and its
consequences. Land Degrad Develop. 2007;18:369-81. https://doi.org/10.1002/ldr.779
Echeverría H, Rozas HS. Eficiencia de recuperación del nitrógeno aplicado al estadio de
seis hojas del maíz bajo riego en siembra directa y labranza convencional. Cienc Suelo. 2001;19:57-66.
Elissondo E, Costa JL, Suero E, Fabrizzi KP, Garcia F. Evaluacion de algunas propiedades fisicas
de suelos luego de la introduccion de labranzas verticales en un suelo bajo siembra directa. Cienc Suelo. 2001;19:11-20.
Fabrizzi KP, Garcia FO, Costa JL, Picone LI. Soil water dynamics, physical properties and and wheat responses to minimum and no-tillage systems in the southern Pampas of Argentina. Soil
Till Res. 2005;81:57-69. https://doi.org/10.1016/j.still.2004.05.001
Ferreras LA, Costa JL, Garcia FO, Pecorari C. Effect of no-tillage on some soil physical properties of a structural degraded Petrocalcic Paleudoll of the southern “Pampa” of Argentina. Soil Till
Gregorich EG, Reynolds WD, Culley JLB, McGovern MA, Curnoe WE. Changes in soil physical
properties with depth in a conventionally tilled soil after no-tillage. Soil Till Res. 1993;26:289-99. https://doi.org/10.1016/0167-1987(93)90002-7
Horn R, Kutilek M. The intensity-capacity concept-how far is it possible to
predict intensity values with capacity parameters. Soil Till Res. 2009;103:1-3. https://doi.org/10.1016/j.still.2008.10.007
Hu W, Shao M, Wang Q, Fan J, Horton R. Temporal changes of soil hydraulic properties under different land uses. Geoderma. 2009;149:355-66.
https://doi.org/10.1016/j.geoderma.2008.12.016
Iovino M, Castellini M, Bagarello V, Giordano G. Using static and dynamic indicators to evaluate soil physical quality in a sicilian area. Land Degrad Dev. 2016;27:200-10. https://doi.org/10.1002/ldr.2263
Javeed HMR, Zamir MSI, Tanveer A, Yaseen M. Soil physical properties and grain yield of
spring maize (Zea Mays L.) as influence by tillage practices and mulch treatments. Cercetări
Agronomice în Moldova. 2013;46:69-75. https://doi.org/10.2478/v10298-012-0075-9
Keller T, Sutter JA, Nissen K, Rydberg T. Using field measurement of saturated soil hydraulic conductivity to detect low-yielding zones in three Swedish fields. Soil Till Res. 2012;124:68-77.
https://doi.org/10.1016/j.still.2012.05.002
Kleine C, Puricelli CA. Comparación de los rendimientos y algunos parametros químicos luego
de varios años bajo labranza convencional y siembra directa en el sudoeste de Buenos Aires. Inf Agron Cono Sur. 2001;12:15-9.
Lozano LA, Soracco CG, Buda VS, Sarli GO, Filgueira RR. Stabilization of soil hydraulic properties under a long term no-till system. Rev Bras Cienc Solo. 2014;38:1281-92. https://doi.org/10.1590/S0100-06832014000400024
Lozano LA, Soracco CG, Cornelis WM, Gabriels D, Sarli GO, Villarreal R. Anisotropy of pore
size classes’ connectivity related to soil structure under no tillage. Soil Sci. 2013;178:612-7. https://doi.org/10.1097/SS.0000000000000027
Lozano LA, Soracco CG, Villarreal R, Ressia JM, Sarli GO, Filgueira RR. Soil physical quality and
soybean yield as affected by chiseling and subsoiling of a no-till soil. Rev Bras Cienc Solo.
2016;40:e0150160. https://doi.org/10.1590/18069657rbcs20150160
Mentges MI, Reichert JM, Rodrigues MF, Awe GO, Mentges LR. Capacity and intensity soil
aeration properties affected by granulometry, moisture, and structure in no-tillage soils.
Geoderma. 2016;263:47-59. https://doi.org/10.1016/j.geoderma.2015.08.042
Moreira WH, Tormena CA, Karlen DL, Silva AP, Keller T, Betioli Junior E. Seasonal changes
in soil physical properties under long-term no-tillage. Soil Till Res. 2016;160:53-64. https://doi.org/10.1016/j.still.2016.02.007
Munkholm LJ, Heck RJ, Deen B. Long-term rotation and tillage effects on soil structure and crop
yield. Soil Till Res. 2013;127:85-91. https://doi.org/10.1016/j.still.2012.02.007
Perroux KM, White I. Designs for disc permeameters. Soil Sci Soc Am J. 1988;52:1205-15. https://doi.org/10.2136/sssaj1988.03615995005200050001x
Pieri CJMG. Fertility of soils: a future for farming in the west African Savannah. Berlin:
Springer-Verlag; 1992.
Reichert JM, Rosa VT, Vogelmann ES, Rosa DP, Horn R, Reinert DJ, Sattler A, Denardin JE. Conceptual framework for capacity and intensity physical soil properties affected by short and long-term (14 years) continuous no-tillage and controlled traffic. Soil Till Res. 2016;158:123-36.
https://doi.org/10.1016/j.still.2015.11.010
Reichert JM, Suzuki LEAS, Reinert DJ, Horn R, Håkansson I. Reference bulk density and critical
degree-of-compactness for no-till crop production in subtropical highly weathered soils. Soil Till Res. 2009;102:242-54. https://doi.org/10.1016/j.still.2008.07.002
Reynolds WD, Bowman BT, Drury CF, Tan CS, Lu X. Indicators of good soil
Reynolds WD, Drury CF, Tan CS, Fox CA, Yang XM. Use of indicators and pore
volume-function characteristics to quantify soil physical quality. Geoderma. 2009;152:252-63. https://doi.org/10.1016/j.geoderma.2009.06.009
Reynolds WD, Drury CF, Yang XM, Fox CA, Tan CS, Zhang TQ. Land management effects
on the near-surface physical quality of a clay loam soil. Soil Till Res. 2007;96:316-30. https://doi.org/10.1016/j.still.2007.07.003
Reynolds WD, Drury CF, Yang XM, Tan CS. Optimal soil physical quality inferred through
structural regression and parameter interactions. Geoderma. 2008;146:466-74. https://doi.org/10.1016/j.geoderma.2008.06.017
Sasal MC, Andriulo AE, Taboada MA. Soil porosity characteristics and water movement
under zero tillage in silty soils in Argentinian Pampas. Soil Till Res. 2006;87:9-18.
https://doi.org/10.1016/j.still.2005.02.025
Singh VK, Yadvinder-Singh, Dwivedi BS, Singh SK, Majumdar K, Jat ML, Mishra RP, Rani M. Soil physical properties, yield trends and economics after five years of conservation
agriculture based rice-maize system in north-western India. Soil Till Res. 2016;155:133-48. https://doi.org/10.1016/j.still.2015.08.001
Soracco CG. Efecto de la compactación sobre el sistema poroso del suelo en diferentes situaciones de labranza: modelización y realidad [thesis]. La Plata: Facultad de Ciencias
Agrarias y Forestales; 2009.
Soracco CG, Lozano LA, Balbuena R, Ressia JM, Filgueira RR. Contribution of macroporosity
to water flux of a soil under different tillage systems. Rev Bras Cienc Solo. 2012;36:1149-55.
https://doi.org/10.1590/S0100-06832012000400009
Soracco CG, Lozano LA, Sarli GO, Gelati PR, Filgueira RR. Using tension disc infiltrometer to determine infiltration and water-conducting macroporosity and
mesoporosity relationships in an agricultural silty loam soil. Soil Sci. 2011;176:459-63. https://doi.org/10.1097/SS.0b013e3182257d65
Soracco CG, Lozano LA, Sarli GO, Gelati PR, Filgueira RR. Anisotropy of saturated hydraulic
conductivity in a soil under conservation and no-till treatments. Soil Till Res. 2010;109:18-22. https://doi.org/10.1016/j.still.2010.03.013
Soracco CG, Lozano LA, Villarreal R, Palancar TC, Collazo DJ, Sarli GO, Filgueira RR. Effects of compaction due to machinery traffic on soil pore configuration. Rev Bras Cienc Solo.
2015;39:408-15. https://doi.org/10.1590/01000683rbcs20140359
Stepniewski W, Gliński J, Ball BC. Effects of soil compaction on soil aeration properties. In: Soane BD, Ouwerkerk C, editors. Developments in agricultural engineering 11: soil compaction
in crop production. Amsterdam: Elsevier; 1994. p. 167-90.
Strudley MW, Green TR, Ascough II JC. Tillage effects on soil hydraulic
properties in space and time: state of the science. Soil Till Res. 2008;99:4-48. https://doi.org/10.1016/j.still.2008.01.007
Suzuki LEAS, Reichert JM, Reinert DJ. Degree of compactness, soil physical properties and yield of soybean in six soils under no-tillage. Soil Res. 2013;51:311-21.
https://doi.org/10.1071/SR12306
van Genuchten MTh. A closed-form equation for predicting the hydraulic conductivity of unsaturated
soil. Soil Sci Soc Am J. 1980;44:892-8. https://doi.org/10.2136/sssaj1980.03615995004400050002x
van Genuchten MTh, Leij FJ, Yates SR. The RETC code for quantifying the hydraulic functions of
unsaturated soils. Washington, DC: United States Environmental Protection Agency; 1991.
Villarreal R, Soracco CG, Lozano LA, Melani EM, Sarli GO. Temporal variation of soil sorptivity under conventional and no-till systems determined by a simple laboratory method. Soil Till Res. 2017;168:92-8. https://doi.org/10.1016/j.still.2016.12.013
Watson KW, Luxmoore RJ. Estimating macroporosity in a forest watershed by use of a tension infiltrometer. Soil Sci Soc Am J. 1986;50:578-82. https://doi.org/10.2136/sssaj1986.03615995005000030007x