EVALUATION OF PHYSICAL QUALITY INDICES OF A SOIL
UNDER A SEASONAL SEMIDECIDUOUS FOREST
(1)Thalita Campos Oliveira(2), Laura Fernanda Simões da Silva(3) & Miguel Cooper(4)
SUMMARY
The concept of soil quality is currently the subject of great discussion due to the interaction of soil with the environment (soil-plant-atmosphere) and practices of human intervention. However, concepts of soil quality relate quality to agricultural productivity, but assessment of soil quality in an agronomic context may be different from its assessment in natural areas. The aim of this study was to assess physical quality indices, the S index, soil aeration capacity (ACt/Pt), and
water storage capacity (FC/Pt) of the soil from a permanent plot in the Caetetus Ecological Reserve (Galia, São Paulo, Brazil) under a seasonal semideciduous forest and compare them with the reference values for soil physical quality found in the literature. Water retention curves were used for that purpose. The S values
found were higher than the proposed limit for soil physical quality (0.035). The A and E horizons showed the highest values because their sandy texture leads to a high slope of the water retention curve. The B horizons showed the lowest S
values because their natural density leads to a lower slope of the water retention curve. The values found for ACt/Pt and FC/Pt were higher and lower than the idealized limits. The values obtained from these indices under natural vegetation can provide reference values for soils with similar properties that undergo changes due to anthropic activities. All the indices evaluated were effective in differentiating the effects of soil horizons in the natural hydro-physical functioning of the soils under study.
Index terms: S index, ACt/Pt, FC/Pt, water retention curve.
(1) Part of the master's degree thesis of the first author, presented to the Graduate Studies Program in Soil and Plant Nutrition of the Escola Superior de Agricultura "Luiz de Queiroz" - ESALQ/USP. Received for publication on March 8, 2013 and approved on November 5, 2013.
(2) Master of Science of the Graduate Studies Program in Soil and Plant Nutrition, ESALQ/USP. Av. Pádua Dias, 11. Caixa Postal 9. CEP 13418-900 Piracicaba (SP), Brazil. E-mail: [email protected]
RESUMO:AVALIAÇÃO DE ÍNDICES DE QUALIDADE FÍSICA DO SOLO SOB FLORESTA ESTACIONAL SEMIDECIDUAL
O conceito de qualidade do solo é muito discutido atualmente em razão das relações do solo com o meio ambiente (solo-planta-atmosfera) e das práticas intervencionistas do homem. Esse conceito relaciona a qualidade com a produtividade agrícola, mas sua avaliação em um contexto agronômico pode ser diferente em ecossistema natural. Este estudo teve como objetivo avaliar os índices de qualidade física do solo, o índice S, a capacidade de aeração do solo (ACt/Pt) e a capacidade de armazenamento de água do solo (CC/Pt) da parcela permanente localizada na Estação Experimental de Caetetus em Galia, São Paulo, Brasil, sob Floresta Estacional Semidecidual e compará-los com valores de referência de índices de qualidade física do solo encontrados na literatura. Para tanto, curvas de retenção de água foram utilizadas para o cálculo desses índices. Os valores do índice S encontrados foram superiores ao limite proposto de qualidade física do solo (0,035). Os horizontes A e E apresentaram os valores mais altos, pois sua textura arenosa refletiu em elevada inclinação da curva de retenção. Os horizontes B evidenciaram os menores valores de S, pois seu adensamento natural refletiu curvas de retenção com menor inclinação. Os valores de ACt/Pt e CC/Pt foram maiores e menores que os valores definidos como ideais. Os índices de qualidade física do solo, o índice S, a capacidade de aeração do solo (ACt/Pt) e a capacidade de armazenamento de água do solo (CC/Pt) sob vegetação natural podem representar valores de referência para solos com características semelhantes que sofrem alguma atividade ou influência antrópica. Todos os índices avaliados foram eficientes para diferenciar os efeitos dos horizontes no funcionamento físico-hídrico natural dos solos estudados.
Termos de indexação: índice S, ACt/Pt, CC/Pt, curva de retenção de água.
INTRODUCTION
The concept of soil quality is currently the subject of great discussion due to the interaction of soil with the environment (soil-plant-atmosphere) and practices of human intervention (Gil-Sotres et al., 2005). Soil quality has been defined in many ways by various authors; the broadest definition is given by the Soil Science Society of America, which defined it as “the capacity of a specific soil type to work, within the limits of natural or managed ecosystems, to sustain the productivity of plants and animals, maintaining or increasing air and water quality by promoting human health and housing” (Doran & Parkin, 1994; Karlen et al., 1997). However, there is no consensus on its definition, due to the difficulty of integrating conflicting soil uses, namely agriculture and natural environments, into a single concept.
The concern over soil quality has intensified in recent decades because of population growth and pressure on natural resources, which threaten soil quality. The dependence of humans on this finite, fragile and non-renewable natural resource becomes a topic of great interest in studies aimed at developing criteria or indices of sustainability. Recently, soil quality has been a focus in debates over global warming due to its effects on regulation of greenhouse gases, on carbon stocks and sequestration, and on its importance in producing biofuels (Ewing & Singer, 2012).
Soil quality is estimated by measurable indices related to soil evolution. These indices allow characterization, assessment and monitoring of changes in an ecosystem. Thus, soil quality indices
indicate changes in the production capacity and integrity of ecosystems since they evaluate soil degradation and environmental stress (Dexter, 2004). Soil quality indices also aid in the adoption of management techniques and guide scientific research, as well as soil conservation policies (Sojka & Upchurch, 1999; Dexter, 2004).
The S index indicates soil physical quality. It evaluates the structural quality of soils by calculating the slope of the soil water retention curve at the inflection point. Changes in land use modify the water retention curve and, thus, the S value (Dexter & Bird, 2001; Dexter, 2004). This index has long been used as an indicator of soil physical quality in temperate climates (Dexter et al, 2005; Dexter & Czyz, 2007; Dexter & Richard, 2009); however, its use has been limited in tropical soils (Tormena et al., 2008).
Soil physical quality can also be assessed through the availability of water and air for plant growth, where nitrogen production by soil organisms is maximized when 66 % of soil porosity is filled by water, or when 34 % of the porosity is filled with air (Skopp et al., 1990). Based on these ratios, Reynolds et al. (2002) proposed indices of water storage (FC/Pt) and air storage capacity (ACt/Pt), with ideal values of 0.66 and 0.34 (dimensionless), respectively. Good soil quality for water and air storage consists of pore space at field capacity of 2/3 water and 1/3 air. However, determination of the applicability and usefulness of these indices in evaluating soil physical quality requires further studies.
permanent plot located in the Caetetus Experimental Station (Galia, São Paulo, Brazil) in a seasonal semideciduous forest and compared them with reference values of indices of soil physical quality reported in the literature. This data can be used in evaluation of soil quality in other types of use.
MATERIALS AND METHODS
The Caetetus Ecological Reserve (2,178.84 ha) is located in the southwest of the State of São Paulo in the municipalities of Galia and Alvinlandia between the geographical coordinates of 22o 20’ and 22o 30’ S
latitude and 49o 40’ and 49o 45’ W longitude, with elevation from 500-680 m. The climate is Cwa, mesothermal, with dry winters and temperatures below 18 oC, and higher than 22 oC in the summer. The vegetation is characterized by a seasonal semideciduous forest (Tabanez et al., 2005).
The study was conducted in a toposequence on a permanent plot (0.1 km2) of the Caetetus Ecological
Reserve. In the toposequence, five points were chosen to open the pits and the geometry of the horizons was determined based on the structural analysis technique proposed by Boulet et al. (1982). Soil morphological descriptions were performed according to Lemos & Santos (2002) and the soils were classified according to the Brazilian Soil Classification System (Embrapa, 2006) and Soil Survey Staff (2010). In each profile, disturbed and undisturbed samples were collected for chemical and physical analyses. Organic matter (OM) content was calculated from carbon (C) determination by colorimetry (Cantarella et al., 2001). Particle size analysis was performed according to Gee & Or (2002). We used the volumetric flask method for determination of soil particle density (PD), and soil bulk density (BD) was calculated using undisturbed samples in Köppeck type soil sample rings (100 cm3) (Embrapa, 1997).
Undisturbed samples in Köppeck metal rings (100 cm3) were collected in triplicate in each horizon
of the five profiles to determine the soil water retention curves (volumetric - m3 m-3 and gravimetric - g g-1).
After saturation, the samples were subjected to tensions |Ψ| of 1, 3, 5, 8 and 10 kPa on a tension table (Topp & Zebchuk, 1979) and 33, 100, 500 and 1500 kPa in porous plates using the Richard’s chamber (Dane & Hopmans, 2002). The water retention curves were fitted using the equation proposed by van Genuchten (1980) by means of the RETC program (van Genuchten et al., 1991).
The water content at the inflection point of the curve was calculated by the retention equation (Dexter, 2004): res m m res sat
i q q q
q + -ú û ù ê ë é +
-=( ) 1 1 (1)
in which θi is the water content at the inflection point (m3 m-3), θsat is the water content at saturation point
(m3 m-3), θres is the residual water content (m3 m-3),
and n is the parameter of the van Genuchten model (1980).
The water tension at the inflection point was calculated by the equation (Dexter, 2004):
n m i 1 1 1 ú û ù ê ë é =a y (2)
in which ψi is the water pressure at the inflection point (kPa), and α (kPa-1), n and m are the parameters
of the van Genuchten model (1980).
Three soil physical quality indices for natural ecosystems were used - the S index, soil aeration capacity (ACt/Pt) and soil water storage capacity (FC/ Pt). The S index was calculated according to Dexter (2004) using the equation:
÷ ø ö ç è æ -ú û ù ê ë é -= 2 1 1 1 2 ) ( n n n res sat n
S q q (3)
in which θsat is the water content at the saturation point (g g-1), θres is the residual water content (g g-1),
and n is the parameter of the van Genuchten model (1980). The critical limit for physical quality in the S
index is 0.035, delimiting soils with good and bad structural quality; values below 0.002 represent very bad structural quality.
The indices of soil aeration capacity (ACt/Pt) and soil water storage capacity (FC/Pt) were calculated according to Reynolds et al. (2002), in which FC is the soil water content retained at the matric potential equivalent to field capacity (|Ψi| = 10 kPa) (Reichardt & Souza, 1996) and ACt is the drained soil porosity between saturation and FC.
For Skopp et al. (1990), the ideal FC/Pt ratio for good microbial activity is 0.66, which is able to mineralize the crop remains and provide N to the plants.
Total soil porosity (Pt) [1-(bulk density/density of soil particles)] was obtained according to Vomocil (1965).
For statistical analysis, the R program, version 2.8.1, was used. The mean value of the results of the
S index, ACt/Pt and FC/Pt were compared by the Tukey test at 0.05 probability to assess significant differences between the horizons.
RESULTS AND DISCUSSIONS
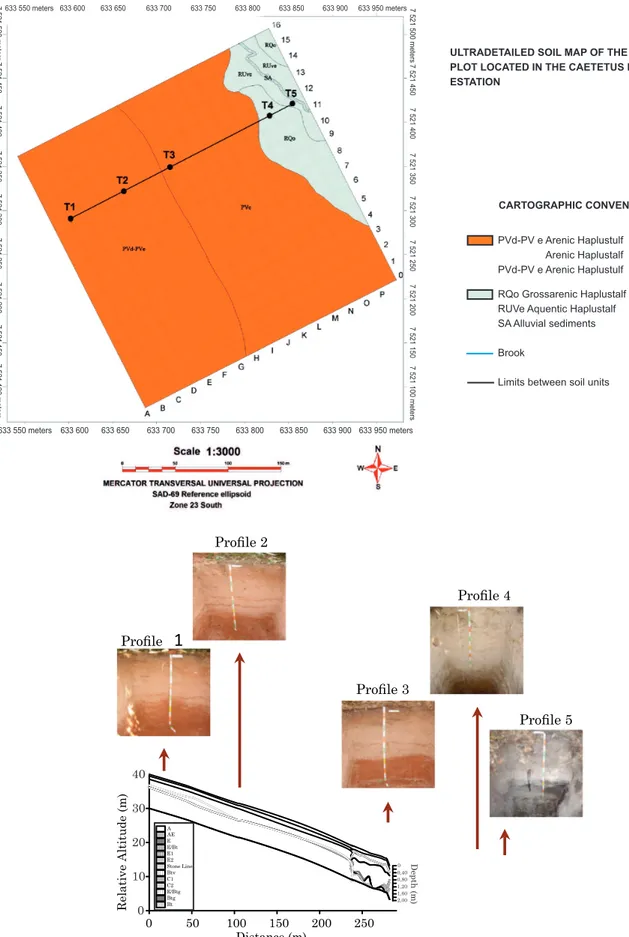
(Argissolo Vermelho-Amarelo eutrófico abrúptico arênico) (2), Arenic Haplustalfs (Argissolo vermelho-amarelo eutrófico abrúptico) (3), Grossarenic Haplustalfs (Argissolo Vermelho-Amarelo eutrófico abrúptico espessarênico) (4), and Aquertic Haplustalfs (5) (Gleissolo Háplico Ta eutrófico vértico) (Figure 1). Detailed information regarding the morphological properties of the horizons and the hydro-physical characterization of the profiles are described in Cooper et al. (2012).
In general, the soils exhibit lateral and vertical heterogeneity, evidenced by morphological and size differences of horizons along the toposequence according to Cooper et al. (2012). Two distinct behaviors were observed in terms of water flow in the B horizons. Soils without drainage restriction (well drained) occur in the upper and middle slope (profiles 1, 2 and 3), and soils with drainage constraints (moderately to imperfectly drained soils) occur in the lower portion of the slope (profiles 4 and 5) (Figure 1). The presence of mottled and grayish color in profiles 4 and 5 shows the drainage constraints and the occurrence of reduction and oxidation processes.
A clear textural change was observed in the surface (A horizon) and sub-surface horizons (Bt, Btg, Bg) in the five profiles, ranging from sandy loam to sandy clay loam in profile 1, from loamy sand to sandy loam in profile 2, from loamy sandy to sandy clay loam in profile 3, from sand to loamy in profile 4, and from sandy loam to sandy in profile 5 (Table 1). In the A horizons of the profiles, the clay content ranged from 80-140 g kg-1, and in the Bt, Btg and Bg horizons, it
ranged from 120-410 g kg-1 (Table 1).
The increase in clay contents in the B horizons (Table 1) of the five profiles is related, in part, to the argilluviation process, evidenced by the presence of clayskins, which favors the formation of medium-size structures in sub-angular/angular blocks and a strong degree of development.
The A and E horizons in the profiles showed similar texture (sandy); however, they have different structures, according to their morphological descriptions. Higher OM contents, root concentration and high microbiological activity promote greater soil aggregation in these horizons (Harris et al., 1966), favoring the formation of a large/medium granular structure with a weak degree of development, and small sub-angular blocks with a moderate to weak degree of development, as observed in the field. The E horizons showed a sub-angular blocky structure with a weak degree of development that break into single grains; the low content of OM and other cementing agents contributed to low aggregation (Hartmann & Boodt, 1974).
The values of PD were similar along the toposequence, ranging from 2.38-2.82 Mg m-3 (Table 1) as expected,
because this property does not depend on the soil structure but only on the constitution of the solid particles in the soil. This result reflects the dominant
presence of quartz, which has a specific mass of 2.65 Mg m-3 (Jong van Lier, 2012).
The bulk density (BD) of the surface horizon of the five profiles showed the lowest values, ranging from 0.92-1.34 Mg m-3 (Table 1), which is explained by the
better soil structure in the surface layers of native forest soils, caused by the OM contribution, which ranged from 0.42-1.40 Mg m-3, and higher biological
activity, corroborating the results obtained by Araújo et al. (2004).
Morphological observations of the structure connected to low values of BD and high OM contents in surface horizons reflected high total porosity in all profiles, ranging from 0.44-0.65 m3 m-3 (Table 1).
Water retention in the soil
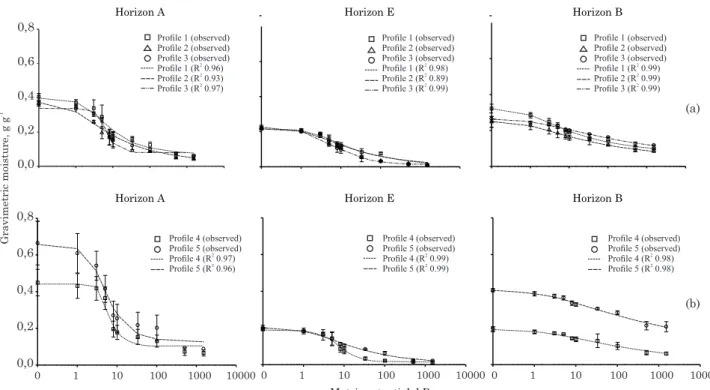
The average values of the adjustment parameters of the experimental data to the van Genuchten equation on a gravimetric and volumetric basis are shown in table 2. The results of the parameters obtained in fitting the model to all the profiles studied obtained significant F values (p<0.001) and the estimated values of r2 were greater than 0.93.
The differences of structure and particle size directly influence the soil physical processes and can be observed in the water retention curves in the soil (Figure 2). Retention curves of the A and E horizons have the same shape because of the same particle size; however, the higher aggregation promoted by the higher OM content (Godefroy & Joacquin, 1975) in the A horizon favors low values of BD and high total porosity (Table 1). Therefore, the A horizons of the five profiles show higher water contents at the saturation and residual points compared to the E horizons (Figure 2).
Water retention curves in the soil of the E horizon of the profiles showed lower water contents at the saturation points and low water retention at matric potentials close to wilting point (1.5 MPa), which is explained by the predominance of sand in this horizon, high BD values and low total porosity values (Figure 2 and Table 1).
The differences in the behavior of the water retention curves between the sandy E horizons and clayey B horizons are attributed mainly to the characteristics of the type of structure and distribution of the size, shape and type of pores of these horizons (Cooper et al., 2012). In the more clayey horizons (Bt, Btg and Bv), sub-angular/angular blocky structures and an increase in clay content (Table 1) are observed. Thus, the increase in clay content favors the formation of micropores and higher water retention in the tensions near 1500 kPa (Horn et al., 1995) compared to the A and E horizons.
633 550 meters 633 600 633 650 633 700 633 750 633 800 633 850 633 900 633 950 meters
633 550 meters
7 521 100 meters
7 521 150
7 521 200
7 521 250
7 521 300
7 521 400
7 521 450
7 521 500 meters
7 521 350
7 521 100 meters
7 521 150
7 521 200
7 521 250
7 521 300
7 521 400
7 521 450
7 521 500 meters
7 521 350
633 600 633 650 633 700 633 750 633 800 633 850 633 900 633 950 meters
ULTRADETAILED SOIL MAP OF THE PERMANET
PLOT LOCATED IN THE CAETETUS ECOLOGICAL
ESTATION
CARTOGRAPHIC CONVENTIONS
PVd-PV e Arenic Haplustulf Arenic Haplustalf PVd-PV e Arenic Haplustulf RQo Grossarenic Haplustalf RUVe Aquentic Haplustalf SA Alluvial sediments Brook
Limits between soil units
Pro!le
1
Distance (m)
0 50 100 150 200 250
Relative Altitude (m) 0
10 20 30 40
A AE E E/Bt E1 E2 Stone Line Btv C1 C2 E/Btg Btg Bt
0 0,40
Depth (m)
0,80 1,20 1,60 2,00
Pro!le 2
Pro!le 3
Pro!le 4
Pro!le 5
Horizon ααααα Ures Usat n R2 ααααα θθθθθres θθθθθs a t n R2
m cm-1 g g-1 cm-1 m3 m-3
Profile 1 - Arenic Haplustults
A (0.00-0.10) 0.04 0.07 0.41 1.59 0.96 0.03 0.13 0.50 2.29 0.97
E (0.29-0.64) 0.04 0.00 0.22 1.39 0.98 0.04 0.00 0.34 1.37 0.99
Bt (0.78-1.23+) 0.09 0.07 0.32 1.32 0.99 0.06 0.18 0.44 1.64 0.99
Profile 2 - Arenic Haplustalfs
A (0.00-0.07) 0.09 0.02 0.38 1.35 0.93 0.06 0.08 0.50 1.60 0.98
E (0.29-0.61) 0.06 0.00 0.22 1.33 0.95 0.03 0.02 0.33 1.65 1.00
Bt (0.98-1.35+) 0.09 0.04 0.25 1.23 0.99 0.06 0.17 0.38 1.52 0.99
Profile 3 - Arenic Haplustalfs
A (0.00-0.13) 0.02 0.08 0.34 3.71 0.97 0.02 0.12 0.46 4.08 0.98
E (0.34-0.95) 0.02 0.00 0.21 1.80 0.99 0.02 0.03 0.33 2.04 1.00
Bt (0.95-1.35+) 0.08 0.00 0.26 1.12 0.99 0.04 0.27 0.42 1.69 0.97
Profile 4 - Grossarenic Haplustalfs
A (0.00-0.13) 0.02 0.10 0.44 4.22 0.97 0.02 0.14 0.51 4.60 0.99
E (0.40-1.40) 0.02 0.02 0.19 2.54 0.99 0.02 0.03 0.30 2.66 0.99
Btg (1.86-2.50+) 0.04 0.00 0.19 1.18 0.98 0.05 0.09 0.33 1.24 0.98
Profile 5 - Aquertic Haplustalfs
A (0.00-0.22) 0.03 0.13 0.65 2.09 0.97 0.03 0.15 0.58 2.80 0.98
E (0.53-0.86) 0.05 0.00 0.20 1.34 0.99 0.05 0.01 0.33 1.34 0.99
Bgv (0.86-1.00) 0.05 0.00 0.40 1.10 0.98 0.04 0.34 0.54 1.45 0.99
Table 2. Parameters of the soil water retention curves (gravimetric and volumetric basis) for the van Genuchten model (ααααα, θθθθθres, θθθθθsat and n) and coefficients of determination (R2) for the profiles studied in
the Caetetus Ecological Reserve (Galia, São Paulo, Brazil)
Horizon Sand Silt Clay OM PD BD θθθθθi ΨΨΨΨΨi Pt
m g kg-1 Mg m-3 m3.m3 kPa m3.m-3
Profile 1 - Arenic Haplustults
A (0.00-0.10) 820 40 140 1.19 2.67 1.27 0.34 5.27 0.53
E (0.29-0.64) 880 20 100 0.38 2.6 1.51 0.22 6.24 0.42
Bt (0.78-1.23+) 720 40 240 0.42 2.63 1.38 0.34 2.96 0.47
Profile 2 - Arenic Haplustalfs
A (0.00-0.07) 860 20 120 1.4 2.53 1.34 0.34 2.94 0.47
E (0.29-0.61) 860 40 100 0.42 2.67 1.51 0.21 5.94 0.43
Bt (0.98-1.35+) 800 20 180 0.35 2.67 1.54 0.30 3.39 0.42
Profile 3 - Arenic Haplustalfs
A (0.00-0.13) 840 40 120 1.33 2.38 1.34 0.30 6.15 0.44
E (0.34-0.95) 900 20 80 0.28 2.82 1.54 0.20 6.15 0.43
Bt (0.95-1.35+) 640 40 320 0.42 2.63 1.62 0.36 4.34 0.45
Profile 4 - Grossarenic Haplustalfs
A (0.00-0.13) 900 20 80 0.42 2.64 1.17 0.33 6.20 0.56
E (0.40-1.40) 920 20 60 0.28 2.7 1.59 0.18 6.50 0.41
Btg (1.86-2.50+) 820 60 120 0.31 2.67 1.75 0.26 8.11 0.34
Profile 5 - Aquertic Haplustalfs
A (0.00-0.22) 800 60 140 1.19 2.6 0.92 0.39 4.61 0.65
E (0.53-0.86) 840 60 100 0.42 2.6 1.63 0.22 5.08 0.37
Bgv (0.86-1.00) 510 80 410 0.73 2.5 1.34 0.46 5.13 0.46
Table 1. Soil properties for the profiles studied in the toposequence
emphasizing the importance of the B horizons (Bt, Btg and Bgv) for the maintenance of the forest. These observations are in agreement with the results of Cooper et al. (2012), who reported that in the more clayey B horizons, there is a more balanced distribution between macropores and micropores, favoring water retention.
The B horizon of profile 5 (Figure 2) showed a different water retention curve compared to the other B horizons. It has a high clay content (Table 1) and a dense angular blocky structure, and it features vertic characteristics, as observed in the morphological descriptions of the profile, where the expansive clays also contribute to increased water retention.
The S index
The values of S found in the soils are greater for the A (0.19) and E (0.06) horizons and lower for the B horizons (0.03), there being no statistical difference between the A and E horizons (Table 2). The high values of the S index obtained from the water retention curves in the A and E horizons reflect very good structural quality, higher than those suggested by the critical threshold value, S > 0.035 (Dexter, 2004). Studies using this soil physical quality index also reported levels higher than the critical threshold value suggested by the author (Fidalski & Tormena, 2007; Andrade & Stone, 2009; Carvalho Filho et al., 2009; Pereira et al., 2011). This shows the difficulty of fitting the S values to the suggested scale in the case of tropical soils and the need for analysis of the proposed critical threshold since it was arbitrarily chosen for
soils from Poland and England (Dexter, 2004). These results could represent reference values for soils with similar characteristics.
The higher S values in the A and E horizons are associated with lower values of bulk density, higher OM content (Table 1) and higher n values (Table 2), which maintain soil porosity and soil structure. According to van Genuchten & Nielsen (1985), higher
n values correspond to better expression of the slope of the curve for soil water retention and a more homogeneous distribution of pores in the soil over the entire length of the curve.
The B horizons exhibited values of the soil quality index below the critical threshold (Table 3), indicating that the soil may have physical quality which is restrictive to plants. However, this limit is based on ideal growing conditions for agricultural crops, where moisture at the inflection point is considered ideal for soil tillage (Dexter & Bird, 2001). Thus, for natural conditions of plant development, it is necessary to reevaluate these limits for some types of soil since there is no soil tillage or management.
These low values are associated with increased bulk density and reduced OM contents, and low values of n in the horizons (Tables 1 and 2).
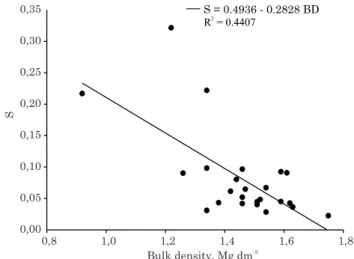
We also observe that with the increase in BD, the soil water retention curve changes in shape due to reduction of macropores in relation to micropores, favoring reduction in the slope of the soil water retention curve and, consequently, reduction in the S
value (Figure 3). The inverse relationship between
Profile 4 (observed) Profile 5 (observed)
Profile 4 (R2
0.97)
Profile 5 (R 0.96)2
Profile 4 (observed) Profile 5 (observed)
Profile 4 (R2
0.99)
Profile 5 (R 0.99)2
Profile 4 (observed) Profile 5 (observed)
Profile 4 (R2
0.98)
Profile 5 (R 0.98)2
Profile 1 (observed) Profile 2 (observed) Profile 3 (observed)
Profile 1 (R 0.98)2
Profile 2 (R2
0.89)
Profile 3 (R 0.99)2
Profile 1 (observed) Profile 2 (observed) Profile 3 (observed)
Profile 1 (R 0.99)2
Profile 2 (R2
0.99)
Profile 3 (R 0.99)2
Horizon E Horizon B
Horizon A
0 1 10 100 1000 10000 0,0
0,2 0,4 0,6 0,8
Horizon E
0 1 10 100 1000 10000 Matric potential, kPa
Horizon B
0 1 10 100 1000 10000
Gravimetric moisture, g g
-1
Horizon A
0,0 0,2 0,4 0,6 0,8
Profile 1 (observed) Profile 2 (observed) Profile 3 (observed)
Profile 1 (R 0.96)2
Profile 2 (R2
0.93)
Profile 3 (R 0.97)2
(a)
( )b
the S index and bulk density was observed by Dexter (2004) in soils from Spain, where there was a decrease in the linear value of S as a result of an increase in bulk density.
Soil aeration capacity (ACt/Pt) and soil water storage capacity (FC/Pt)
The values of soil physical quality indices ACt/Pt and FC/Pt recommended by Reynolds et al. (2002) are shown in table 3. The results show high amplitude for these indices in the A and E horizons, which are distant from the reference values of 0.34 and 0.66 for ACt/Pt and FC/Pt, respectively. Similar results were obtained by Reynolds et al. (2002) in sandy soils from Canada, indicating that, in these soils, much of the water is drained at low tensions, increasing the risks of water deficit to plants.
The values of the ACt/Pt index showed that the A and E horizons had the highest values (0.60 and 0.42) and were not statistically different; however, the B horizon had the lowest value (0.36), close to the value considered ideal (0.34) and different from both horizons.
The values of the FC/Pt index for horizons A, E and B were statistically different and the B horizon exhibited greater ability to retain water in the soil
(0.73), exceeding the index value considered ideal (0.66) (Reynolds et al., 2002), compared to the values of 0.40 and 0.38 for the A and E horizons, respectively (Table 3). The low values of this relationship in the A and E horizons is related to greater soil porosity and the sandy nature of these horizons (Table 1), as observed in the morphological and physical results discussed above.
The higher values of FC/Pt can be a positive aspect in the use of the well drained Haplustalfs and Haplustult, increasing water availability to plants during periods of drought. However, high values of FC/Pt can cause poor aeration conditions when the soil is near FC since a large proportion of the pores is occupied by water, hampering microbial activity and root respiration.
In general, a better balance between water storage capacity and soil aeration was observed in the B horizon, compared to the A and E horizons, allowing an ideal balance for microbial activity, capable of mineralizing fresh organic matter and providing N to plants, corroborating the results of Skopp et al. (1990).
CONCLUSIONS
1. The soil physical quality indices, the S index, soil aeration capacity (ACt/Pt) and water storage capacity of the soil (FC/Pt) under natural vegetation can represent reference values for soils with similar characteristics that undergo some anthropogenic activity or influence.
2. The three indices evaluated were effective in differentiating the effects of the horizons in the natural hydro-physical behavior of the soils studied.
3. The results suggest the need for reevaluation of the threshold levels considered ideal for soil physical quality in tropical regions.
LITERATURE CITED
ANDRADE, R.S. & STONE, L.F. Índice S como indicador da qualidade física de solos do cerrado brasileiro. R. Bras. Eng. Agríc. Amb., 12:382-388, 2009.
Horizon Value of S Horizont θθθθθcc at 10 kPa
ACt/Pt FC/Pt
E 0.06 ± 0.02 a A 0.60 ± 0.06 A 0.40 ± 0.04 A
B 0.03 ± 0.01 b E 0.42 ± 0.04 A 0.38 ± 0.07 B
B 0.36 ± 0.14 B 0.73 ± 0.17 C
Table 3. Mean values and standard deviation of the S index, ACt/Pt and FC/Pt of the horizons
Means followed by the same lowercase letter in the column did not differ in the horizons (p>0.05); means followed by the same uppercase letter in the column did not differ in the horizons (p>0.05).
Bulk density, Mg dm-3
S
0,8 1,0 1,2 1,4 1,6 1,8
0,00 0,05 0,10 0,15 0,20 0,25 0,30
0,35 S =0.4936 - 0.2828BD
R = 0.44072
Figure 3. Relationship of mean values of the S index
ARAÚJO, M.A.; TORMENA, C.A. & SILVA, A.P. Propriedades físicas de um Latossolo Vermelho distrófico cultivado sob mata nativa. R. Bras. Ci. Solo, 28:337-345, 2004. BOULET, R.; CHAUVEL, A.; HUMBEL, F.X. & LUCAS, Y.
Analyse structurale et cartographie en pédologie: I - Prise en compte de l´organisation bidimensionalle de la couverture pédologique: lês études de toposéquence et leurs principaux apports à la connaissance dês sols. Cahiers: Orstom Serie Pédol., 19:341-351, 1982. CANTARELLA, H.; QUAGGIO, J.A. & RAIJ, B.van.
Determinação da matéria orgânica. In: RAIJ, B.van; ANDRADE, J. C.; CANTARELLA, H. & QUAGGIO, J. A., eds. Análise química para a avaliação da fertilidade de solos tropicais. Campinas, Instituto Agronômico de Campinas, 2001. p.173-180.
CARVALHO FILHO, A.; CARVALHO, L.C.C.; CENTURION, J.F.; BEUTLER, A.N.; CORTEZ, J.W. & RIBON, A.A. Qualidade física de um Latossolo Vermelho férrico sob sistemas de uso e manejo. Biosci. J., 25:43-51, 2009. COOPER, M.; DALLA ROSA, J.; MEDEIROS, J.C.; OLIVEIRA,
T.C.; TOMA, R.S. & JUHÁSZ, C.E.P. Hydro-physical characterization of soils under tropical semi-deciduous forest. Sci. Agric., 69:152-159, 2012.
DANE, J.H. & HOPMANS, J.W. Pressure plate extractor. In: DANE, J.H. & TOPP, C., eds. Methods of soil analysis. Physical methods. Madison, Soil Science Society of America, 2002. Part 4. p.688-690. (SSSA Book Series, 5) DEXTER, A.R. Soil physical quality. Part I. Theory, effects of soil texture, density, and organic matter, and effects on root growth. Geoderma, 120:201-214, 2004.
DEXTER, A.R. & BIRD, N.R.A. Methods for predicting the optimum and the range of water contents for tillage based on the water retention curve. Soil Till. Res., 57:203-217, 2001.
DEXTER, A.R. & CZYZ, E.A. Application of S-theory in the study of soil physical degradation and its consequences. Land Degrad. Develop., 18:369-381, 2007.
DEXTER, A.R. & RICHARD, G. Tillage of soils in relation to their bi-modal pore size distributions. Soil Till. Res., 103:113-118, 2009.
DEXTER, A.R.; CZYZ, E.A.; BIRKA´S, M.; DIAZ-PEREIRA, E.; DUMITRU, E.; ENACHE, R.; FLEIGE, H.; HORN, R.; RAJKAI, K.; DE LA ROSA, D. & SIMOTA, C. SIDASS project part 3: the optimum and the range of water content for tillage - further developments. Soil Till. Res., 82:29-37, 2005.
DORAN, J.W. & PARKIN, T.B. Defining and assessing quality. In: DORAN, J.W.; COLEMAN, D.C.; BEZDICEK, D.F. & STEWART, B.A., eds. Defining soil quality for a sustainable environment. Baltimore, SSSA, 1994. v.35. p.3-21.
EMPRESA BRASILEIRA DE PESQUISA AGROPECUÁRIA -EMBRAPA. Centro Nacional de Pesquisa de Solos. Manual de métodos de análise de solo. Rio de Janeiro, Embrapa Solos, 1997. 212p.
EMPRESA BRASILEIRA DE PESQUISA AGROPECUÁRIA - EMBRAPA. Sistema brasileiro de classificação de solos. 2.ed. Rio de Janeiro, Embrapa Solos, 2006. 306p. EWING, S. & SINGER, M.J. Soil quality. In: HUNAG, P.M.; Li, Y. & SUMNER, M.E. Handbook of soil science: Resources, management and environment impacts. Boca Raton, Taylor & Francis Group, 2012. p.1-26.
FIDALSKI, J. & TORMENA, C.A. Homogeneidade da qualidade física do solo nas entrelinhas de um pomar de laranjeira com sistemas de manejo da vegetação na entrelinha. R. Bras. Ci. Solo, 31:637-645, 2007. GEE, G. & OR, D. Particle-size analysis. In: DANE, J.H. &
TOPP, C., eds. Methods of soil analysis. Physical methods. Madison, Soil Science Society of America, 2002. Part 4. p.255-293. (SSSA Book Series, 5) GIL-SOTRES, F.; TRASAR-CEPEDA, C.; LEIROS, M.C. &
SEOANE, S. Different approaches to evaluating soil q u a l i t y u s i n g b i o c h e m i c a l p r o p e r t i e s . S o i l B i o l . Biochem., 37:877-887, 2005.
GODEFROY, J. & JOACQUIN, F. Relation entre la stabilité structurales des sols cultivés et les apport organiques en conditions tropicales; comparasion avec les sols forestiers. Fruits, 30:595-612, 1975.
HARRIS, R.F.; CHESTER, G. & ALLEN, O.N. Dynamics of soil aggregation. Adv. Agron., 18:107-169, 1966. HARTMANN, R. & BOODT, M. The influence of the
moisture content, texture and organic matter on the aggregation of sandy and loamy soils. Geoderma, 11:53-62, 1974.
HORN, R.; DOMZAL, H.; SLOWINSKA-JURKIEWICZ, A. & van OUWERKERK, C. Soil compaction processes and their effects on the structure of arable soils and the environment. Soil Till. Res., 35:23-26, 1995. JONG VAN LIER, Q. Índice “S”: um indicador da qualidade
f í s i c a d o s o l o ? I n : R E U N I Ã O B R A S I L E I R A D E MANEJO E CONSERVAÇÃO DO SOLO E DA ÁGUA, 19., Lages, 2012. Anais... Lages, Sociedade Brasileira de Ciência do Solo, 2012. CD-ROM
KARLEN, D.L.; MAUSBACH, M.J.; DORAN, J.W.; CLINE, R.G.; HARRIS, R.F. & SCHUMAN, G.E. Soil quality: A concept, definition, and framework for evaluation (A guest editorial). Soil Sci. Soc. Am. J., 61:4-10, 1997. LEMOS, R.C. & SANTOS, R.D. Manual de descrição e coleta de solo no campo. 4.ed. Viçosa, MG, Sociedade Brasileira de Ciência do Solo, 2002. 83p.
PEREIRA, F.S.; ANDRIOLI, I.; PEREIRA, F.S.; OLIVEIRA, P.R.; C.J.F.; FALQUETO, R.J. & MARTINS, A.L.S. Qualidade física de um Latossolo Vermelho submetido a sistemas de manejo avaliado pelo índice S. R. Bras. Ci. Solo, 35:87-95, 2011.
REYNOLDS, W.D.; BOWMAN, B.T.; DRURY, C.F.; TAN, C.S. & LU, X. Indicators of good soil physical quality: Density and storage parameters. Geoderma, 110:131-146, 2002. SKOPP, J.; JAWSON, M.D. & DORAN, J.W. Steady-state aerobic microbial activity as a function of soil water content. Soil Sci. Soc. Am. J., 54:1619-1625, 1990. SOIL SURVEY STAFF. Keys to soil taxonomy. 11.ed.
Washington, USDA/National Resources Conservation Service, 2010. 338p.
SOJKA, R.E. & UPCHURCH, D.R. Reservations regarding the soil quality concept; discussion. Soil Sci. Soc. Am. J. 63:1039-1054, 1999.
TABANEZ, M.F.; DURIGAN, G.; KEUROGHLIAN, A.; BARBOSA, A.F.; FREITAS, C.A.; SILVA, C.E.F.; SILVA, D.A.; EATON, D.P.; BRISOLLA, G.; FARIA, H.H.; MATTOS, I.F.A.; LOBO, M.T.; BARBOSA, M.R.; ROSSI, M.; SOUZA, M.G.; MACHADO, R.B.; PFEIFER, R.M.; RAMOS, V.S.; ANDRADE, W.J. & CONTIERI, W.A. Plano de Manejo da Estação Ecológica dos Caetetus. São Paulo, Instituto Florestal, 2005. 105p. (Série Registros)
TOPP, G.C. & ZEBCHUK, W. The determination of soil-water desorption curves for soil cores. Can. J. Soil Sci., 59:19-26, 1979.
TORMENA, C.A.; SILVA, A.P.; IMHOFF, S.D.C. & DEXTER, A.R. Quantification of the soil physical quality of a tropical Oxisol using the S index. Sci. Agric., 65:56-60, 2008. van GENUCHTEN, M.T. A closed-form equation for predicting
the hydraulic conductivity of unsaturated soils. Soil Sci. Soc. Am. J., 44:892-898, 1980.
van GENUCHTEN, M.T.; LEIJ, F.J. & YATES, S.R. The RETC code for quantifying the hydraulic functions of unsaturated soils. Riverside, U. S. Salinity Laboratory, 1991. 85p. van GENUCHTEN, M.T. & NIELSEN, D.R. On describing
and predicting the properties of unsatured soils. Ann. Geph, 3:615-628, 1985.