Ciência Rural, v.48, n.5, 2018.
Digestibility and net energy prediction of rice by products determined with piglets
Digestibilidade e predição da energia líquida de subprodutos de arroz determinado com leitões
Graciele Dalise Schirmann1 Leonardo Tombesi da Rocha2* Henrique da Costa Mendes Muniz2 Josué Sebastiany Kunzler2 Micheli Faccin Kuhn2 Vladimir de Oliveira2
ISSNe 1678-4596
Received 08.17.17 Approved 04.02.18 Returned by the author 04.23.18 CR-2017-0576.R1
INTRODUCTION
Several studies have evaluated the inclusion of broken rice (BRR) and full fat rice bran (FFRB) in pig diets (EBERT et al., 2005; GOMES et al., 2012). However, one of the factors limiting a more intense use of FFRB in pig diets is its sensitivity to oxidation, especially in hot climates. Extrusion process subjects the FFRB to high temperatures for a short time period, resulting in stabilized rice bran (SRB). Parboiled rice bran (PRB), originating from the rice parboiling process,
also has low lipase activity, which delays rancidity (MUJAHID et al., 2005; HEUZÉ & TRAN, 2015). Few studies have been conducted to evaluate the digestibility of chemical components and energy of SRB and PRB for piglets.
The energy content evaluation of feedstuffs used for pig diets is generally based on their digestible (DE) or metabolizable (ME) energy values. However, the net energy (NE) system better describes the energy value available for animal maintenance and production processes (NOBLET, 1994). The main issues of the NE system, especially
1Departamento de Zootecnia, Universidade Federal do Rio Grande do Sul (UFRGS), Porto Alegre, RS, Brasil.
2Departamento de Zootecnia, Universidade Federal de Santa Maria (UFSM), Avenida Roraima, n 1000, 97105-900, Santa Maria, RS, Brasil.
E-mail: [email protected].*Corresponding author.
ABSTRACT: The aim of this study was to determine the chemical composition, digestibility, and net energy (NE) of broken rice (BRR), stabilized rice bran (SRB), and parboiled rice bran (PRB) for piglets. Two digestibility trials were performed with 12 and 18 male pigs with
initial weights of 8 and 16kg, respectively. We performed total fecal collection using ferric oxide as fecal marker. The digestibility coefficients
of organic matter, crude protein, and gross energy were higher (P<0.001) for the BRR compared to the SRB and PRB. The PRB presented a digestible energy 2% lower than that of BR and 5% higher than that of SRB. For BRR, average NE value was 3,228kcal/kg dry matter (DM), and the difference between the lower and higher value was 311kcal/kg DM. Average NE values of SRB and PRB were 2,896 and 3,293kcal/ kgDM, respectively. The difference between the energy predicted by each equation reached 190kcal/kgDM for SRB and 285kcal/kgDM for
PRB. In conclusion, BRR showed higher nutrient digestibility coefficients, except for EE and GE, which can be attributed to differences in the
production processes. Regardless of the type of feedstuff tested, equations to predict NE values should be used carefully due to considerable differences in energy content.
Key words: broken rice, parboiled rice bran, prediction equations, stabilized rice bran.
RESUMO: O objetivo deste estudo foi determinar a composição química, a digestibilidade e a energia líquida (EL) da quirera (QR), farelo de arroz estabilizado (FAE) e farelo de arroz parboilizado (FAP) para leitões. Foram realizados dois ensaios de digestibilidade com 12 e 18 suínos machos com pesos iniciais de 8 e 16kg, respectivamente. A coleta fecal total foi realizada usando óxido férrico como marcador fecal.
Os coeficientes de digestibilidade da matéria orgânica, proteína e energia bruta (EB) foram maiores (P<0,001) para o QR em comparação
com o FAE e FAP. O FAP apresentou energia digestível 2% inferior à da QR e 5% maior que a da FAE. Para QR, o valor médio de EL foi de 3,228kcal/kg de matéria seca (DM), e a diferença entre o valor inferior e o valor superior foi de 311kcal/kg de MS. Os valores médios de EL de FAE e FAP foram de 2.896 e 3.293kcal/kgMS, respectivamente. A diferença entre a energia predita por cada equação atingiu 190kcal/kgMS
para FAE e 285kcal/kgMS para FAP. Em conclusão, QR mostrou maiores coeficientes de digestibilidade dos nutrientes, exceto EE e EB, o que
pode ser atribuído a diferenças nos processos de produção. Independentemente do tipo de alimento testado, as equações para prever os valores de EL devem ser usadas com cuidado devido a diferenças consideráveis no conteúdo energético.
Palavras-chave: arroz quebrado, farelo de arroz parboilizado, equações de predição, farelo de arroz estabilizado.
when compared to DE and ME, are the difficulties and costs to estimate NE in the feed.
An alternative to estimate the NE value of a feedstuff or diet is the use of multiple regression equations which employ chemical characteristics, digestible nutrients, or energy data for the calculation (LIU et al., 2015). However, few studies have been conducted to compare multiple regression equations to estimate the NE value of feedstuffs for piglets. In this context, we performed two experiments to determine the chemical composition, digestibility of nutrients and energy, and NE values of BRR, SRB, and PRB for piglets.
MATERIALS AND METHODS
Twelve and 18 castrated male pigs in the nursery phase, with average initial live weights of 8±0.81 and 16±1.57kg, were used in trial I and II, respectively. Animals were allotted in a completely randomized design with two (trial I) and three treatments (trial II); each treatment consisted of six replicates.
In the first trial, the treatments consisted of a reference diet (RD) and a test diet (TD) elaborated by the substitution of 40% (weight) of the energetic feedstuffs by BRR. In trial II, 16% of RD energetic feeds were replaced by SRB or PRB. Composition of RD was identical in both trials (Table 1) and formulated to meet the nutritional requirements of piglets according to ROSTAGNO et al. (2011).
In both trials, the pigs were individually housed in metabolism cages equipped with feeders, drinkers, and containers for the collection of feces and urine. The two experiments had a duration of 12 days, with seven days for adaptation and five days of total feces collection. Animals received four meals daily (8:00, 11:30, 14:00, and 17:30h), based on the metabolic live weight (kg0.75) obtained according to the lowest intake during the adaptation period.
The feces were collected twice daily according to the marker-to-marker approach, using ferric oxide (1%) as a marker. Feces were placed in plastic bags and kept in a freezer at -18°C. At the end of each period, the feces were thawed and homogenized; an aliquot was removed for drying at 65°C in a forced air oven before being milled for chemical analysis.
Analyses of dry matter (DM, method 930.15), mineral matter (MM, method 942.05) N (988.05 method), ether extract (EE, method 920.39) of feed ingredients and feces were performed following the methodologies of the Association of Official Analytical Chemists (AOAC, 1995). To
determine neutral detergent fiber (NDF) and acid detergent fiber (ADF) of diets and ingredients, the VAN SOEST (1967) methodology was used. The gross energy (GE) was determined in an adiabatic calorimetric bomb.
For the calculation of nutrient digestibility coefficients and apparent digestible energy (DE) of feedstuffs and diets, the equations described by ADEOLA (2001) were used. The NE values were calculated using the equations of NOBLET et al., (1994); JUST et al., (1982), LIU et al., (2015) and BLOK (2006).
The digestibility coefficient (DC) of the evaluated feedstuffs were submitted to analysis of variance using in the model the treatment as fixed effect. Digestibility data obtained in trials I and II were pooled prior to analysis because the variances between the experiments showed homogeneity. In addition, the digestibility of the reference diet was not different between the two trials. Results were submitted to analysis of variance and means were compared by Tukey´s test. All statistical analyses were performed using the MINITAB statistical software (2017).
RESULTS AND DISCUSSION
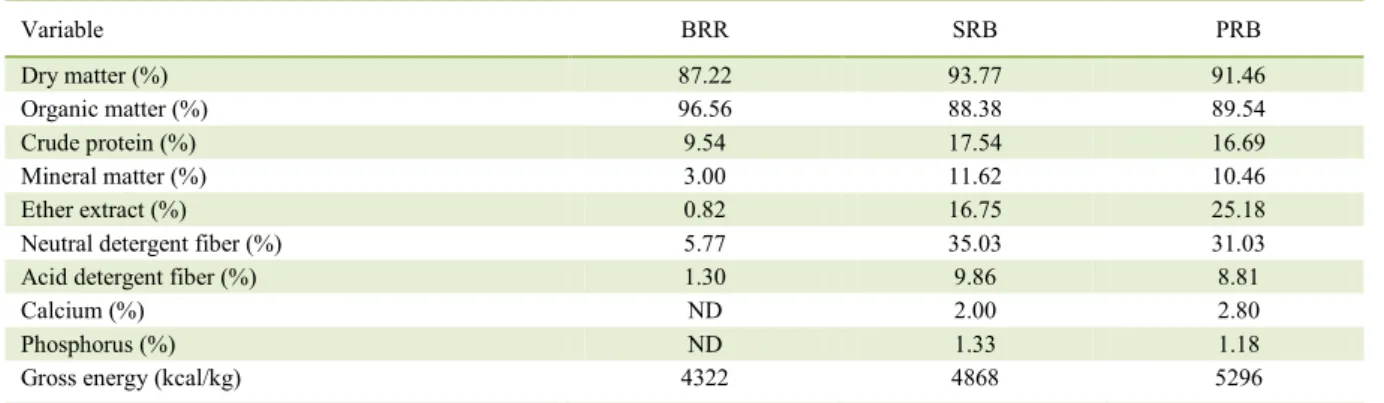
The analyzed CP content from the rice by-products is shown in table 2. The CP concentration in BRR (9.54) was similar to 9.64%, cited by ROSTAGNO et al. (2011), while the bran presented CP content 16% higher than the values reported by the authors. Protein concentration in BRR and RB can vary by 45 and 33%, respectively (HEUZÉ & TRAN, 2015; HEUZÉ et al. 2017). This variation usually behaves inversely proportional to the fiber content in the feedstuff.
The EE in BRR were lower when compared to the 1.20 and 1.29% cited by SAUVANT et al. (2004) and ROSTAGNO et al. (2011); however, it is within the range of variation described by HEUZÉ et al. (2017). The same occurred for SRB and PRB, which also presented variations when compared to each other (16.75 and 25.18%, respectively). During SRB production, oil is removed by pressing, resulting in a lower amount of fat in this byproduct (MUJAHID et al., 2005).
Ciência Rural, v.48, n.5, 2018. the bran during the polishing process (DORS et
al., 2009); nevertheless, NDF values above 12% are presented in NRC (2012). H Higher amounts of NDF and ADF were observed in SRB compared to PRB. Due to the oil extraction, the concentration of other components present in the SRB is increased, which includes fiber.
The GE values of BRR and SRB were in accordance with those reported in the literature. For BRR, ROSTAGNO et al. (2011) reported a value of
4,332kcal GE/kg, similar to our value of 4,322kcal/ kg. Similarly, our value obtained for SRB was closer to that cited by SAUVANT et al. (2004), which averaged 4,973kcal/kg. In relation to the PRB GE, our value was higher when compared to the 4,108kcal/kg reported by AQUINO et al. (2014). The GE variation may be associated to the higher amount of EE in the byproducts, especially in the two brans.
Results presented in table 3 show higher feces excretion (P<0.00) by the animals receiving
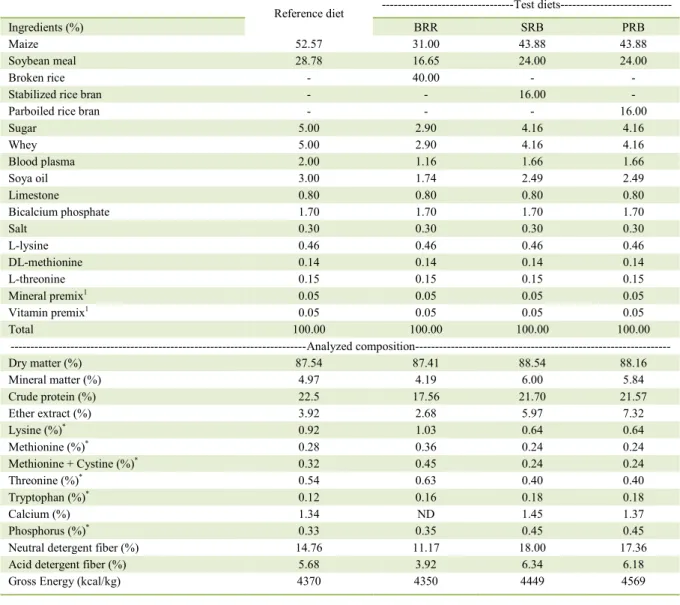
Table 1 – Composition of reference and test diets with broken rice (BRR), stabilized rice bran (SRB) and parboiled rice bran (PRB), as fed basis.
Reference diet ---Test diets---
Ingredients (%) BRR SRB PRB
Maize 52.57 31.00 43.88 43.88
Soybean meal 28.78 16.65 24.00 24.00
Broken rice - 40.00 - -
Stabilized rice bran - - 16.00 -
Parboiled rice bran - - - 16.00
Sugar 5.00 2.90 4.16 4.16
Whey 5.00 2.90 4.16 4.16
Blood plasma 2.00 1.16 1.66 1.66
Soya oil 3.00 1.74 2.49 2.49
Limestone 0.80 0.80 0.80 0.80
Bicalcium phosphate 1.70 1.70 1.70 1.70
Salt 0.30 0.30 0.30 0.30
L-lysine 0.46 0.46 0.46 0.46
DL-methionine 0.14 0.14 0.14 0.14
L-threonine 0.15 0.15 0.15 0.15
Mineral premix1 0.05 0.05 0.05 0.05
Vitamin premix1 0.05 0.05 0.05 0.05
Total 100.00 100.00 100.00 100.00
---Analyzed composition---
Dry matter (%) 87.54 87.41 88.54 88.16
Mineral matter (%) 4.97 4.19 6.00 5.84
Crude protein (%) 22.5 17.56 21.70 21.57
Ether extract (%) 3.92 2.68 5.97 7.32
Lysine (%)* 0.92 1.03 0.64 0.64
Methionine (%)* 0.28 0.36 0.24 0.24
Methionine + Cystine (%)* 0.32 0.45 0.24 0.24
Threonine (%)* 0.54 0.63 0.40 0.40
Tryptophan (%)* 0.12 0.16 0.18 0.18
Calcium (%) 1.34 ND 1.45 1.37
Phosphorus (%)* 0.33 0.35 0.45 0.45
Neutral detergent fiber (%) 14.76 11.17 18.00 17.36
Acid detergent fiber (%) 5.68 3.92 6.34 6.18
Gross Energy (kcal/kg) 4370 4350 4449 4569
*Calculated according ROSTAGNO et al. (2011) 1Amount/kg of vitamin and mineral premix: retinyl acetate, 13,500.000IU; cholecalciferol,
SRB and PRB diets. This result was possibly correlated with the higher fiber amount in the bran, which implies a faster passage of the food through the tract, decreasing digestibility (LE GOFF et al., 2002). However, for BRR, the volume of feces may be associated with the characteristics of the starch granules of this byproduct which, because of its small particle size, facilitates the activities of digestive enzymes (EBERT et al., 2005).
The DC of CP and the GE for BRR were similar to the 88.7% and 93.3% described by EBERT et al. (2005), respectively (Table 3).
For the brans, the lowest DC of GE for PRB was observed. The rice byproducts, especially bran, present higher fiber contents, thereby affecting the digestibility in monogastric animals, which includes the reduction of feedstuff GE digestibility (BRITO et al., 2008). Factors such as animal age also influence the digestibility of energy and fiber (LE GOFF et al., 2002).
In general, the chemical composition and nutrient digestibility of rice brans were not different from those reported in the literature, except for the CD of NDF that was, on average, 20.53% higher than
Table 2 – Chemical composition and gross energy values of broken rice (BRR), stabilized rice bran (SRB), parboiled rice bran (PRB), dry matter basis.
Variable BRR SRB PRB
Dry matter (%) 87.22 93.77 91.46
Organic matter (%) 96.56 88.38 89.54
Crude protein (%) 9.54 17.54 16.69
Mineral matter (%) 3.00 11.62 10.46
Ether extract (%) 0.82 16.75 25.18
Neutral detergent fiber (%) 5.77 35.03 31.03
Acid detergent fiber (%) 1.30 9.86 8.81
Calcium (%) ND 2.00 2.80
Phosphorus (%) ND 1.33 1.18
Gross energy (kcal/kg) 4322 4868 5296
ND, Not determined.
Table 3 – Dry matter balance of experimental diets and nutrient digestibility coefficients of different rice by-products determined with piglets.
Variables ---Diets---
BRR SRB PRB CV SEM PROB
Replicates 6 6 6 - - -
Dry matter intake (g/kg PV0.75/d) 92.78a 84.45a 85.76a 10.14 3.630 0.25
Feces (g/kg PV0.75/d) 20.11c 29.46b 35.56a 8.58 0.990 0.00
Dry matter excreted (g/kg PV0.75/d) 7.71b 11.34a 12.16a 9.99 0.420 0.00
---Digestibility coefficients of feed ingredients---
Organic matter (%) 94.73a 71.85b 66.05b 2.81 8.87 0.00
Mineral matter (%) 33.74a 42.20b 45.53b 2.65 16.00 0.02
Crude protein (%) 87.40a 69.42b 72.78b 1.16 3.86 0.00
Ether extract (%) 82.68 79.92 78.20 1.68 5.12 0.20
Neutral detergent fiber (%) ND 64.71b 75.49a 3.10 10.81 0.03
Acid detergent fiber (%) ND 54.43b 81.38a 5.54 20.25 0.01
Gross energy (%) 93.94a 77.61b 75.22b 2.03 9.67 0.00
Digestible energy (kcal/kg) 4060b 3778b 3983ab 65.6 4.06 0.00 Metabolizable energy* (kcal/kg) 3995a 3659b 3869ab 65.6 4.08 0.00
Ciência Rural, v.48, n.5, 2018. the values described by ROSTAGNO et al. (2011).
Rice byproducts, especially brans, have relatively high fiber levels and; therefore, their recommendation for inclusion in diets for young animals is extremely low (ROSTAGNO et al., 2011).
Thus, our results may serve as an indication that processes such as parboiling and stabilization can facilitate the fiber digestion by pigs. If we consider the sustainability in animal production, the prospect of increased in the use of byproducts in the pig diet would be extremely important (KERR & SHURSON, 2013). Conversely, BRR is considered a noble feedstuff, widely used in diets for weaned piglets. However, the digestibility values used in diet formulation are average for all pig categories and could not adequately represent a specific phase, such as weaned piglets; and therefore, was included in the present study.
The DE levels significantly differed among the tested byproducts (P<0.005). A higher DE was observed for BRR and PRB. According to SERANA et al. (2009), high fiber diets may decrease DE levels. A higher content of DE in BRR was expected due to the high amount of starch. However, considering that the PRB contains more fiber in relation to the BRR, a lower DE value for PRB was expected, which could; however, not be observed. It is certain that the differences in EE level have offset the fiber effects.
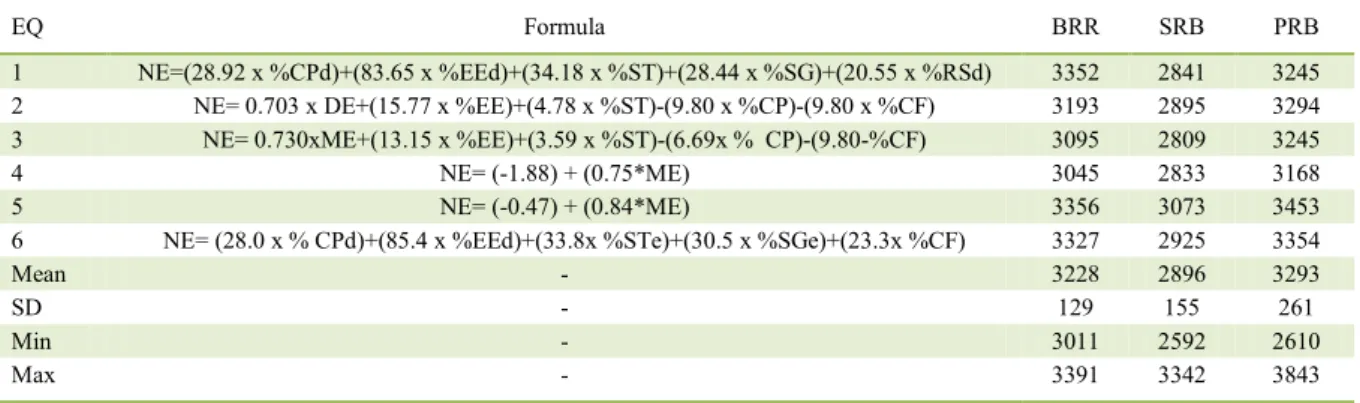
The results of the comparison between different NE prediction equations are presented in table 4. For BRR, the average value of NE, using the six equations, was 3,228kcal; the lowest values were observed for the JUST (1982) equation, while the higher values were obtained by the equation described
by (LIU et al., 2015). Calculating the difference between the two values, a difference of 311kcal is observed, which is higher than that separating corn from wheat (ROSTAGNO et al., 2011).
For bran, the average NE values were 2,896 and 3,293kcal for SRB and PRB, respectively. This difference was expected, considering that the PRB has approximately 10% more EE than the SRB. The equation described by LIU et al. (2015) also resulted in the highest NE estimation for bran, regardless of the processing type. This equation was initially proposed for specific feedstuffs (wheat grain and bran, corn DDGS, canola meal, and cotton seed) and may tend to overestimate the real NE value in other raw materials. The equations 3 and 5, proposed by NOBLET (1994) and JUST (1982), presented the lowest NE values for SRB and PRB, respectively. Difference between the energy predicted by each equation reached 190kcal for SRB and 285kcal for PRB, which means that the perception about a feedstuff can change drastically depending on the equation used for NE estimation. Additionally, we emphasize that none of the equations were generated specifically for piglets. However, the JUST et al (1982), NOBLET et al. (1994) and LIU et al (2015) formulas contemplate the entire growth phase, as well as BLOK et al (2006), since their results were derived from dataset of Noblet.
CONCLUSION
The BRR showed higher digestibility coefficients of its nutrients, except for EE and GE, when compared to SRB and PRB. The amount of
Table 4 – Equations and net energy (NE) predicted values of broken rice (BRR), stabilized rice bran (SRB) and parboiled rice bran (PRB), in dry matter basis.
EQ Formula BRR SRB PRB
1 NE=(28.92 x %CPd)+(83.65 x %EEd)+(34.18 x %ST)+(28.44 x %SG)+(20.55 x %RSd) 3352 2841 3245 2 NE= 0.703 x DE+(15.77 x %EE)+(4.78 x %ST)-(9.80 x %CP)-(9.80 x %CF) 3193 2895 3294 3 NE= 0.730xME+(13.15 x %EE)+(3.59 x %ST)-(6.69x % CP)-(9.80-%CF) 3095 2809 3245
4 NE= (-1.88) + (0.75*ME) 3045 2833 3168
5 NE= (-0.47) + (0.84*ME) 3356 3073 3453
6 NE= (28.0 x % CPd)+(85.4 x %EEd)+(33.8x %STe)+(30.5 x %SGe)+(23.3x %CF) 3327 2925 3354
Mean - 3228 2896 3293
SD - 129 155 261
Min - 3011 2592 2610
Max - 3391 3342 3843
digestible nutrients resulted in higher DE values in BRR compared to SRB and PRB. For the tested feedstuffs, the NE prediction equations resulted in considerable differences in energy contents.
ETHICS AND BIOSSECURITY COMMITTEE APROVAL
The experimental protocol was reviewed and approved by the Ethics Committee in Animal Experimentation of the Universidade Federal de Santa Maria (Opinion nº 4749190215).
CONFLICTS OF INTEREST
The authors declare no conflict of interest. The
founding sponsors had no role in the design of the study; in the collection, analyses, or interpretation of data; in the writing of the manuscript, and in the decision to publish the results.
REFERENCES
ADEOLA, O. Digestion and balance techniques in pigs. In: LEWIS, A. J. and SOUTHERN, L. L., Swine Nutrition. CRC Press, Washington, DC (USA), 2001. Cap 40, p. 903-916. Available from: <www. crcnetbase.com/doi/10.1201/9781420041842.ch40>. Accessed: Jun. 18, 2017. doi: 10.1201/9781420041842.ch40.
AOAC INTERNATIONAL. Official Methods of Analysis of AOAC
International. 16 ed. Arlington, 1995. Available from: <https://doi. org/aoac.methods.90.15.x>. Accessed: Jun. 18, 2017. doi: aoac. methods.90.15.x.
AQUINO, T.M.F. et al. Inclusion levels of parboiled rice bran in diets for piglets in nursery phase. Arquivo Brasileiro Medicina Veterinária Zootecnia, v. 66, n.5, p.1531-1538, out. 2014. Available from: <http://dx.doi.org/10.1590/1678-6423>. Accessed: Jun. 22, 2017. doi: 10.1590/1678-6423.
BLOK, M.C. Development of a new net energy formula by CVB, using the database of INRA. Proceedings of Net Energy Systems for Growing and Fattening Pigs, Vejle, Denmark, p.40-57, 2006.
BRITO, M.S. et al. Non-starch polysaccharides in non-ruminant nutrition – A review. Acta Veteterinaria Brasilica, v. 2, n. 4, p.111-117, 2008. Available from: <http://dx.doi.org/10.21708/avb.2008.2.4.917>. Accessed: Jun. 28, 2017. doi: 10.21708/avb.2008.2.4.917.
DORS, G.C. et al. Influence of the conditions of the parboiling process
in the chemical composition of rice. Food Science and Techonology, v. 29, n.1, p.219-224, jan./mar.2009. Available from: <http://dx.doi. org/10.1590/S0101-20612009000100034>. Accessed: jun. 30, 2017. doi: 10.1590/S0101-20612009000100034.
EBERT, A.R. et al. Performance and digestibiliy of early weaned
pigs receiving rice, corn grains or dark wheat flour. Archivos. Latinoamericanos de Producción Animal, v.13, n.2, p.43-50, 2005.
GOMES, T.R. et al. Rice bran in diets for piglets from 43 to 67 days of age. Ciência Animal Brasileira, v. 13, n. 2, p.189-196, abr./jun.2012.
HEUZÉ, V.; TRAN, G. Rice bran and other rice by-products. Feedipedia, a programme by INRA, CIRAD, AFZ and FAO. Available from: <https://www.feedipedia.org/node/750>. Accessed: Dec. 5, 2017. 2015.
HEUZÉ, V. et al. Broken rice and polished rice. Feedipedia, a programme by INRA, CIRAD, AFZ and FAO. Available from: <https:// www.feedipedia.org/node/748>. Accessed: Dec. 5, 2017. 2017.
JUST, A. The net energy value of balanced diets for growing pigs.
Livestock Production Science, v. 8, n. 6, p.541-555, fev. 1982. Available from: <http://www.sciencedirect.com/science/article/pii /030162268290032X?via%3Dihub>. Accessed: Jul. 01, 2017. doi: 10.1016/0301-6226(82)90032-X.
LE GOFF, G.G. et al. Influence of dietary fiber on digestive utilization and rate of passage in growing pigs, finishing pigs and
adult sows. Animal, v. 74, n. 3, p.503-515, jun. 2002. Available from: <https://doi.org/10.1017/S1357729800052668>. Accessed: Jul. 03, 2017. doi: 10.1017/S1357729800052668.
LIU, D.W. et al. Determination and prediction of the net energy content of seven feed ingredients fed to growing pigs based on chemical composition. Animal Production Science, v. 55, n. 9, p.1152-1163, fev. 2015. Available from: <http://www.publish.csiro. au/an/AN14091>. Accessed: Jul. 04, 2017. doi: 10.1071/AN14091.
KERR, B.J.; SHURSON G.C. Strategies to improve fiber utilization
in swine. Journal of Animal Science and Biotechnology. v. 4, n. 1, p. 11-23. 2013. Available from: <https://jasbsci.biomedcentral. com/articles/10.1186/2049-1891-4-11>. Acessed: Dec. 12, 2017. doi: 10.1186/2049-1891-4-11.
MUJAHID, A. et al. Effect of various processing techniques and different levels of antioxidant on stability of rice bran during storage. Journal of the Science Food Agriculture, v. 85, n. 5, p.847-852, dez. 2005. Available from: <http://onlinelibrary.wiley. com/doi/10.1002/jsfa.2026/abstract>. Accessed: Jul. 07, 2017. doi: 10.1002/jsfa.2026.
NOBLET, J. et al. Prediction of net energy value of feeds for growing pigs. Journal of Animal Science, v. 72, n. 2, p.344-354, fev. 1994. Available from: <https://doi.org/10.2527/1994.722344x>. Accessed: Jul. 10, 2017. doi: 10.2527/1994.722344x.
NRC (NATIONAL RESEARCH COUNCIL) (Washington, Estados Unidos). Nutrient requirements of swine, 11 ed.
Washington: National Academy, 2012, 400 p.
ROSTAGNO, H.S. et al. 3. ed. Brazilian table for poultry and swine: Food composition and nutrient requirements. Federal University of Viçosa, MG, Brazil. 2011. 252p.
SAUVANT, D. et al. Tables of composition and nutritional value of feed materials. Wageningen Academic Publishers, The Netherlands. 2004. 304p.