Extração de γ-oryzanol de farelo de arroz
Renata Heidtmann-Bemvenuti1, Náthali Saião Nora2, Eliana Badiale-Furlong2
ABSTRACT
γ-oryzanol, a phytochemical, has antioxidant activities and potential health benefits. In this study, we aimed to develop a method for extracting high amounts of γ-oryzanol from rice bran and for verifying its stability in different solvents. Of the 5 methods under investigation, the one that yielded the highest γ-oryzanol content was further improved by using a central composite rotational design (DCCR - 24,including 8 tests in axial conditions and 4 central points, totaling 28 trials). The parameters under study were temperature, time, volume, and the ratio of hexane:isopropanol. High γ-oryzanol content (13.98 mg.g-1)was obtained by using the following extraction conditions: 40° C, 40 min, and 75 mL hexane:isopropanol (1:3). The limits of detection and quantification of the method were 0.9 µg g-1 and 31 µg g-1, respectively. The instrumental precision was 0.004%, the repeatability (CV
r) was 9.4%, and the recovery was 111.7 ± 17.7%. γ-oryzanol is more stable in isopropanol than in hexane, in which 100% concentration could be maintained after refrigeration for 72 days.
Index terms: Antioxidant, spectrophotometer, stability, phytochemistry.
RESUMO
γ-orizanol, um fitoquímico, tem atividade antioxidante e benefícios potenciais para saúde. Esse estudo objetivou desenvolver um método para extração de alta quantidade de γ-orizanol de farelo de arroz e verificar sua estabilidade em diferentes solventes. Dentre os cinco métodos estudados, o que teve maior rendimento em γ-orizanol foi melhorado, usando um delineamento composto central rotacional (DCCR - 24, incluindo 8 experimentos no ponto axial e 4 no ponto central, totalizando 28 experimentos). As variáveis testadas foram temperatura, tempo, volume e proporção de hexano: isopropanol usados na extração. Elevado conteúdo de γ-orizanol (13,98 mgg-1) foi obtido quando as condições de extração foram 40° C, 40 min e 75 mL de hexano:isopropanol (1:3). Os limites de detecção e quantificação do método foram 0,9 µg g-1 e 31,0 µg g-1, respectivamente. A precisão instrumental foi 0,004%, a repetibilidade (CVr) 9,4% e a recuperação 111,7 ± 17,7%. γ-orizanol é mais estável em isopropanol do que em hexano, onde 100% da concentração foi mantida após refrigeração por 72 dias.
Termos para indexação: Antioxidante, espectrofotômetro, estabilidade, fitoquímica.
(Received in august 3, 2012 and approved in october 30, 2012)
INTRODUCTION
Antioxidants protect animal tissues from free radical mediated degenerative diseases and aging. Rice bran contains high levels of several phytochemicals that have antioxidant activities, as well as other beneficial health properties. Phytochemicals such as vitamin E, tocopherols (Ts), tocotrienols (T3s) and the γ-oryzanol fraction have been given much attention in several studies (CHOTIMAKORN et al., 2008; LOPES et al., 2012).
γ-oryzanol is mainly composed of trans-ferulic acid esters (trans-hydroxycinnamic acid) and phytosterols (sterols and triterpenic alcohols) such as cycloartenol, β -sitosterol, 24-methylenecycloartenol, and campesterol (XU; GODBER, 2000; LERMA-GARCÍA et al., 2009).
The methods reported for the extraction of γ -oryzanol include liquid–liquid phase extraction, solid
phase extraction, supercritical fluid extraction, and direct solvent extraction (XU; GODBER, 2000), which has been the most commonly used since it does not require any specific extraction instrumentation. These 4 methods involve repeated extractions of rice bran oil (RBO), generally with hexane. Under optimal extraction conditions, however, th e most polar solvents, hexane:isopropanol (1:1 v/v), extracted more γ-oryzanol from rice bran than hexane at high temperature, even though hexane recovered more RBO (HU et al., 1996; XU; GODBER, 2000; SAENJUM et al., 2012).
The most common techniques to determine γ -oryzanol content are high performance liquid chromatography (HPLC) and ultraviolet spectrophotometry (UV) (ROGERS et al., 1993). Although HPLC is accurate and efficient, the high cost involved in the analysis is a disadvantage. The spectrophotometric technique, on the
1Universidade Federal do Rio Grande/FURG – Rua Alfredo Huch – 475 – Centro – Cx. P. 474 – 96201-900 – Rio Grande – RS – Brasil –
reheidtmann@yahoo.com.br
other hand, is simple, practical and inexpensive, but the results are not always accurate because the absorbance reading may be strongly influenced by the matrix (sample components) (BUCCI et al., 2003).
In this study, we aimed to develop a method to extract γ-oryzanol from rice bran by using certain validation parameters (specificity, linearity, limit of detection and quantification, instrumental precision, repeatability and recovery) and we verified its stability in different solvents.
MATERIAL AND METHODS
Standard, reagents, and samples
The γ-oryzanol standard was purchased at from Wako Chemicals, USA (purity > 98%). All reagents used in the experiment were analytically pure.
The rice bran (byproduct of the extraction of rice bran oil) was donated by rice industries from Rio Grande do Sul state, Brazil and was frozen (-18° C) until use.
Preliminary tests
Initially, 5 methods for the extraction of γ-oryzanol were tested; the one that yielded the highest γ-oryzanol content was improved using the Central Composite Rotatable Design (CCRD).
The methods under study differed mainly in the mass of the sample, solvent, time, and temperature used for the extraction of γ-oryzanol and the separation of impurities (Table 1).
Experimental design to study the extraction conditions
of γ-oryzanol
The CCRD (24 plus axial and central point) with 4
replicates at the central point, totaling 28 trials, was used for the 4 selected variables from the fractional design; the γ-oryzanol content was the response. It was carried out in according to the method described by Xu and Godber (2000). Table 2 shows the values of the coded and real levels of the design.
Extraction of γ-oryzanol used in CCRD
Rice bran (10 g) was suspended in distilled water (50 mL) in a test tube (50 mL) followed by addition of ascorbic acid (2 g). The mixture was then vortexed and incubated at temperatures and time durations shown in table 2. Varying volumes of hexane:isopropanol (Table 2) were added, followed by a 30 s vortex, and centrifugation at 1320 × g for 15 min. The organic layer was separated with separatory funnel. The residue was re-extracted with hexane:isopropanol (10 mL) and the entire process was repeated. The combined organic layers were evaporated in a rotary evaporator at 70° C (XU; GODBER, 2000).
Quantification of γ-oryzanol
The compound was dissolved in isopropanol and its absorbance was recorded at 326 nm using a spectrophotometer (VARIAN CARY/100 UV-VISIBLE) (LILITCHAN et al., 2008).
Table 1 – Extraction methods evaluated for γ-oryzanol extraction.
Method Sample mass (g) Time (min) Solvent used for extraction Temperature of extraction (°C)
1 50 180 hexane 69
2 20 60 hexane:isopropanol (1:3) 40
3 20 60 chloroform:methanol (3:2) ambient
4 1 1 hexane ambient
5 10 30 hexane:isopropanol (1:1) 60
1: Zullaikah et al. (2009); 2: Zigoneanu et al. (2008); 3: Azrina et al. (2008); 4: Lilitchan et al. (2008); 5: Xu; Godber (2000). Ambient temperature = 25 ± 5° C.
Table 2 – Values of the coded and real levels used in CCRD.
Factors -2 -1 0 +1 +2
Temperature (°C) 30 40 50 60 70
Time (min) 10 20 30 40 50
Volume of hexane:isopropanol (mL) 15 35 55 75 95
Data analysis
Statistical analysis was carried out using Statística 7.0 at a 95% confidence level, considering the γ-oryzanol content (mgγ-oryzanol gsample-1) as the response to the variables
under study.
Validation parameters
Validation was based on guidelines issued by the International Conference on Harmonisation (ICH, 1995) an d Validação de Métodos An alíticos e Bioanalíticos, an annex of RE no. 899, from May 29, 2003, issued by the Agência Nacional de Vigilância Sanitária (BRASIL, 2003).
The specificity was determined with γ-oryzanol extracted from rice bran and with γ-oryzanol standard, in hexane (11 µg mL-1) and isopropanol (9 µg mL-1), to verify
the possible interference (BRASIL, 2003). The absorbance spectra were determined in the 270 - 400 nm range, and these data were used for the specificity graph.
γ-oryzanol standards (3, 5, 8, 10, 13, 15, 18, 20 µg mL-1) obtained by dilution with hexane and isopropanol
were used to construct 2 calibration curves (in triplicates) for evaluating the linearity.
The limits of detection (LD) and quantification (LQ) were estimated by considering the standard deviation divided by the slope, obtained from the linear regression. Equations 1 and 2 were used to determine the limits of detection and quantification, respectively (BRASIL, 2003):
expressed in terms of the coefficient of variation (CV%) (ICH, 1995).
The accuracy was evaluated in the same samples used in the precision study and calculated according to equation 3: 3 DPa LD IC 10 DPa LQ IC (1) (2)
DPa is the standard deviation of the intercept of y-axis of the standard curve, and IC is the inclination of the standard curve.
The instrumental precision was evaluated by recording 10 successive measurements of a standard solution of γ-oryzanol in isopropanol 9 µg mL-1). The
precision of the extraction method was evaluated in terms of repeatability (CVr) after fortification of rice bran in 3 levels, each one in triplicate: 1.5, 5, and 10 µg g-1 (RIBANI et al., 2004). The repeatability was
evaluated by 9 determinations, with 3 levels of the standard concentration in triplicate. The results were
(%) measured quantity white 100
R
amount added
(3)
Stability of γ-oryzanol in hexane and isopropanol
Standard of γ-oryzanol was dissolved in hexane and isopropanol and maintained at 3 different temperatures, namely, room temperature (25 ± 5° C), freezing temperature (-18 ± 2° C) and refrigeration (10 ± 2° C) for 72 days to determine its stability. γ-oryzanol was quantified daily for 14 days, followed by weekly for a month, and afterwards, on a monthly basis.
RESULTS AND DISCUSSION
Preliminary tests
The highest γ-oryzanol content (12.4 mgg-1 ± 2.0)
was obtained from method 5 (Table 1 and figure 1), and therefore, it was subjected to a CCRD for yield improvement. Zigoneanu et al. (2008); 3: Azrina et al. (2008); 4: Lilitchan et al. (2008); 5: Xu; Godber (2000).
Experimental design to study the extraction conditions
of γ-oryzanol
The results of γ-oryzanol (mgg-1) in the CCRD for
the 4 variables under study (temperature, time, volume, and ratio of hexane:isopropanol) are shown in table 3.
In this design, the γ-oryzanol yield varied from 1.50 to 13.98 mgg-1. The best values were found in trials 5,
6, 7, 8, and 22, all of which showed high solvent volumes, at level +1 (75 mL) or +2 (95 mL), and proportion of hexane:isopropanol at level -1 (1:3) or 0 (1:1).
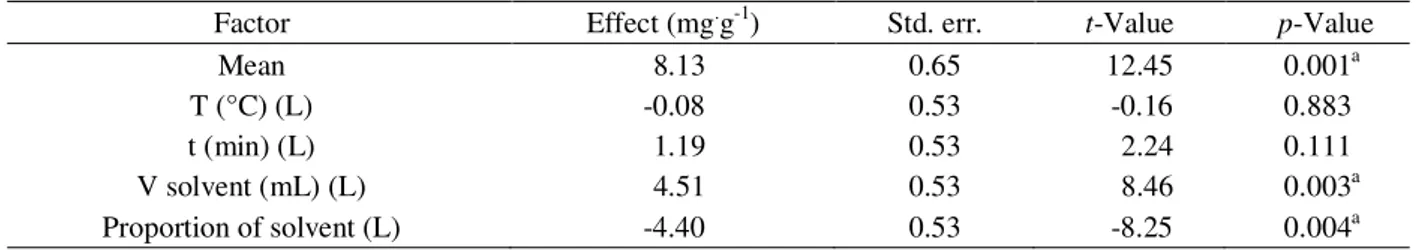
An estimate of the main effect is obtained by evaluating the difference of process performance caused
by a change from low (-1) to high (+1) levels of the corresponding factor (HAALAND, 1989). The measure of the process performance was the response of the γ -oryzanol content. Both the t-test and p-value statistical parameters were used to confirm the significance of the factors under study (Table 4).
The volume of the solvent (Table 4) was found to be the most relevant variable for γ-oryzanol extraction. The γ-oryzanol content increased on an average by 4.51 mgg-1 on increasing the volume of hexane:isopropanol
from 35 to 75 mL. Alteration in the ratio of hexane:isopropanol from 1:3 to 3:1 led to an average decreased in the extracted γ-oryzanol by 4.40 mgg-1.
Table 3 – Coded and real values and the response of γ-oryzanol content.
Temperature (°C) (min)Time Volume of hexane: isopropanol (mL) Proportion of hexane: isopropanol γ-oryzanol (mg.g-1)
1 -1 (40) -1 (20) -1 (35) -1 (1:3) 2.32
2 +1 (60) -1 (20) -1 (35) -1 (1:3) 2.94
3 -1 (40) +1 (40) -1 (35) -1 (1:3) 5.09
4 +1 (60) +1 (40) -1 (35) -1 (1:3) 6.23
5 -1 (40) -1 (20) +1 (75) -1 (1:3) 11.10
6 +1 (60) -1 (20) +1 (75) -1 (1:3) 12.37
7 -1 (40) +1 (40) +1 (75) -1 (1:3) 13.98
8 +1 (60) +1 (40) +1 (75) -1 (1:3) 13.93
9 -1 (40) -1 (20) -1 (35) +1 (3:1) 1.78
10 +1 (60) -1 (20) -1 (35) +1 (3:1) 2.75
11 -1 (40) +1 (40) -1 (35) +1 (3:1) 1.94
12 +1 (60) +1 (40) -1 (35) +1 (3:1) 1.75
13 -1 (40) -1 (20) +1 (75) +1 (3:1) 2.32
14 +1 (60) -1 (20) +1 (75) +1 (3:1) 1.50
15 -1 (40) +1 (40) +1 (75) +1 (3:1) 2.69
16 +1 (60) +1 (40) +1 (75) +1 (3:1) 4.06
17 -2 (30) 0 (30) 0 (55) 0 (1:1) 9.68
18 +2 (70) 0 (30) 0 (55) 0 (1:1) 7.01
19 0 (50) -2 (10) 0 (55) 0 (1:1) 6.55
20 0 (50) +2 (50) 0 (55) 0 (1:1) 7.42
21 0 (50) 0 (30) -2 (15) 0 (1:1) 2.63
22 0 (50) 0 (30) +2 (95) 0 (1:1) 11.12
23 0 (50) 0 (30) 0 (55) -2 (0.5:3.5) 4.31
24 0 (50) 0 (30) 0 (55) +2 (3.5:0.5) 2.48
25 0 (50) 0 (30) 0 (55) 0 (1:1) 8.09
26 0 (50) 0 (30) 0 (55) 0 (1:1) 8.95
27 0 (50) 0 (30) 0 (55) 0 (1:1) 9.18
The combined effect of volume and proportion of hexane:isopropanol resulted in an average reduction of 4.05 mgg-1 in the extracted γ-oryzanol. The temperature
and time, as well as other combinations, did not have any significant effect.
The analysis of variance (ANOVA) was used to evaluate the adequacy of the fit for constructing a second order model to predict the γ-oryzanol content (dependent variable) as a function of volume and proportion of hexane:isopropanol (independent variables).
ANOVA was used for classifying and cross-classifying statistical results and testing whether the results of a specified classification differs significantly. In the current study, the variance analysis was determined using Fisher’s statistical test. The F-value obtained from the ratio of the mean square due to regression to the mean square due to error indicates the influence (significance) of each control factor on the tested model (FRANCIS et al., 2003).
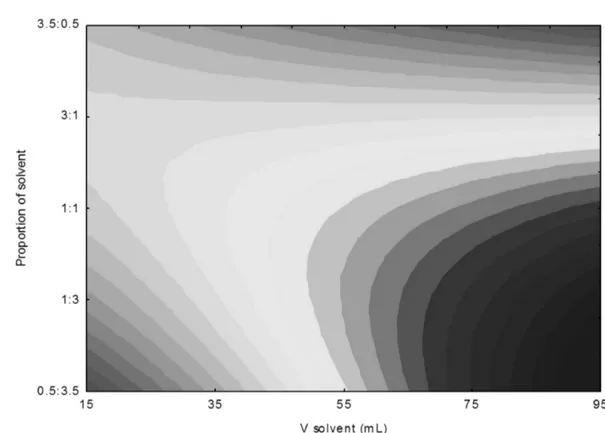
A second order model was established (Equation 4) on the basis of ANOVA (Table 5), which described the γ-oryzanol content as a function of independent variables. The error factor was low, indicating optimal precision for the experimental data. Based on the F-test, the model is predictive, since its calculated F-value and the regression coefficient (0.81) are close to unity. The coded model was used to generate the contour diagram (Figure 2).
Figure 2 shows the effect of the proportion and volume of hexane:isopropanol on the γ-oryzanol content. The concentration of γoryzanol was found to be 11.10 -13.98 mgg-1 (Table 3) on extracting with high volume and
low solvent ratio.
The high γ-oryzanol content (13.98 mgg-1)can be
obtained using extraction conditions in experiment 7: 40° C, 40 min, 75 mL hexane:isopropanol (1:3).
Validation parameters
Figure 3 shows the spectrum obtained (270 - 400 nm) for the γ-oryzanol standard and for the extracted γ -oryzanol dissolved in hexane (11.0 µgmL-1) and
isopropanol (9.0 µgmL-1); the absorption maxima were
observed at 314 nm and 326 nm, respectively. Thus, it was confirmed that at these wavelengths quantification of γ-oryzanol was possible spectrophotometrically, even in the presence of impurities. The matrix factor for the compound dissolved in hexane was 0.99 and in isopropanol was 1.14. According to Kruve et al. (2009), no matrix effect is observed when the response of the analyte is equal to one, demonstrating that the extraction method has no matrix effect; thus implying that quantification of the compound under the established condition was possible.
Table 4 – Main effects for γ-oryzanol content.
a significant factors p < 0.05.
Table 5 – ANOVA for γ-oryzanol content for CCRD.
Regression coefficients = 0.81; F0.95; 4; 23 = 2.80; a F-ratio (regression/residual).
Factor Effect (mg.g-1) Std. err. t-Value p-Value
Mean 8.13 0.65 12.45 0.001a
T (°C) (L) -0.08 0.53 -0.16 0.883
t (min) (L) 1.19 0.53 2.24 0.111
V solvent (mL) (L) 4.51 0.53 8.46 0.003a
Proportion of solvent (L) -4.40 0.53 -8.25 0.004a
Source of variation Sum of squares Degrees of freedom Mean squares F-ratio
Residual 79.00 23 3.43 24.92a
Regression 341.98 4 85.49
Lack of fit 73.89 20
Pure error 5.12 3
Total 420.99 27
γ-oryzanol = 7.097 + 2.256.x – 2.200.y – 1.175.y2
Figure 2 – Contour diagram of γ-oryzanol content as a function of ratio and volume of hexane:isopropanol.
(b) (a)
Figure 3 – Absorption spectrum of γ-oryzanol in hexane (a) and isopropanol (b).
The absorption maxima (max) of γ-oryzanol varied in different solvents depending on their polarities. The standard calibration curves for γ-oryzanol at maximum wavelengths (max) are y = 71.4x (R2 = 0.9991;
max = 314
nm) for hexane and y = 56.6x (R2 = 0.9991;
max = 326 nm),
where y is the absorbance and x is the concentration (mg mL-1). The concentration ranges of the calibration
The LD of the extraction method was 0.946 µgg-1
and the LQ was 3.15 µgg-1. The instrumental precision
was 0.004%, and the repeatability (CVr) was 9.4%. The recovery was evaluated using the conditions of experiment 7 (40° C, 40 min, 75 mL hexane:isopropanol 1:3), and 111.7 ± 17.7% recovery was obtained.
Stability of γ-oryzanol in hexane and isopropanol
γ-oryzanol was more stable in isopropanol than in hexane, in which 100% concentration could be maintained at refrigerator temperature (Figure 4) for 72 days.
Figure 4 showed that hexane was not appropriate for the quantification and storage of γ-oryzanol because
since the solvent evaporated with subsequent concentration of the analyte. On the other hand, isopropanol was found to be appropriate for the quantification and storage of γ -oryzanol with high stability (98% at room temperature, 99% at freezing temperature, and 100% at refrigeration temperature) over extended time (72 days).
Solvents of high volatility (such as hexane) could be lost during transfer, which affects the exact volume of the solvent and the concentration of the solute. Thus, solvents with moderate or low volatility, such as isopropanol or di-n-butyl ether may be advantageous, especially at high room temperature (HU et al., 1996), as is demonstrated by the curves shown in figure 4.
(a)
Figure 4 – Concentration of γ-oryzanol (µg g-1)in hexane (a) and isopropanol (b) stored at different temperatures:
CONCLUSION
A precise and exact extraction method for γ -oryzanol from rice bran was established by using a solvent with low toxicity and a low temperature. A high γ-oryzanol content (13.98 mgg-1)could be obtained using the following
extraction conditions: 40° C, 40 min and 75 mL hexane:isopropanol (1:3). γ-oryzanol was found to be more stable in isopropanol than in hexane, in which 100% concentration at refrigerator temperature could be maintained for 72 days.
ACKNOWLEDGMENTS
The authors would like to thank the CNPq and Capes for their financial support.
REFERENCES
AZRINA, A.; MAZNAH, I.; AZIZAH, A.H. Extraction and determination of oryzanol in rice bran of mixed herbarium UKMB; AZ 6807: MR 185, AZ 6808: MR 211, AZ 6809: MR 29. ASEAN Food Journal, Serdang, v.15,
n.1, p.89-96, jan., 2008.
BRASIL, Resolução RE n° 899, de 29 de maio de 2003, Agência Nacional de Vigilância Sanitária – Anvisa; Publica o “Guia para validação de métodos analíticos e bioanalíticos”, Diário Oficial da União, Brasília (DF), de 02 de junho de 2003.
BUCCI, R. et al. Comparison of three spectrophotometric methods for the determination of γ-oryzanol in rice bran oil. Analitical and Bioanalytical Chemistry, Rockville,
v.375, n.8, p. 1254-1259, apr., 2003.
CHOTIMAKORN, C.; BENJAKUL, S.; SILALAI, N. Antioxidant components and properties of five long-grained rice bran extracts from commercial available cultivars in Thailand. Food Chemistry, Barking, v.111,
n.3, p.636-641, dec., 2008.
FRANCIS, F. et al. Use of response surface methodology for optimizing process parameters for the production of
α-amylase by Aspergillus oryzae. Biochemical
Engineering Journal, Amsterdam, v.15, n.2, p.107-115,
aug., 2003.
HAALAND, P.D. Experimental design in biotechnology.
New York : Marcel Dekker, 1989. 284p.
HU, W. et al. Comparison of isopropanol and hexane for extraction of vitamin E and oryzanol from stabilized rice
bran. Journal of the American Oil Chemists Society.
Champaign, v.73, n.2, p.1653-1656, feb., 1996. INTERNATIONAL CONFERENCE ON
HARMONISATION - ICH. Validation of Analytical
Procedures: Definitions and Terminology, 1995.
Disponível em:<http://www.pharma.gally.ch/ich/ q2a038195en.pdf>. Acesso em: 25 jun. 2012.
KRUVE, A.; LEITO, I.; HERODES, K. Combating matrix effects in LC/ESI/MS: The extrapolative dilution approach. Analytica Chimica Acta, Amsterdam, v.651,
n.1, p.75-80, sep., 2009.
LERMA-GARCÍA, M.J. et al. Composition, industrial processing and applications of rice bran γ-oryzanol.
Food Chemistry, Barking, v.115, n.2, p.389-404, jul.,
2009.
LILITCHAN, S. et al. Partial extraction method for the rapid analysis of total lipids and γ-oryzanol contents in rice bran. Food Chemistry, Barking, v.106, n.2, p.752-759, jan., 2008.
LOPES, M.M.A. et al. Bioactive compounds and total antioxidant capacity of cashew apples (Anacardium occidentale L.) during the ripening of early dwarf cashew clones. Ciência e Agrotecnologia, Lavras, v.36, n.3, p.325-332, mai./jun., 2012.
RIBANI, M. et al. Validação em métodos cromatográficos e eletroforéticos. Química Nova, Campinas, v.27, n.5,
p.771-780, set./out., 2004.
ROGERS, E.J. et al. Identiûcation and quantification of γ-oryzanol components and simultaneous assessment of tocols in rice bran oil. Journal of the American Oil
Chemists Society. Champaign, v.70, n.3, p. 301-307, mar.,
1993.
SAENJUM, C. et al. Antioxidant and anti-inflammatory activities of gamma-oryzanol rich extracts from thai purple rice bran. Journal of Medicinal Plants Research, New York, v.6, n.6, p.1070-1077, feb., 2012.
XU, Z.; GODBER, S. Comparison of supercritical fluid and solvent extraction methods in extracting γ -oryzanol from rice bran. Journal of the American Oil
Chemists Society. Champaign, v.77, n.5, p.547-551,
ZIGONEANU, I.G. et al. Determination of antioxidant components in rice bran oil extracted by microwave-assisted method. Bioresource Technology, New York,
v.99, n. 11, p.4910-4918, jul., 2008.
ZULLAIKAH, S.; MELWITA, E.; JU, Y.H. Isolation of oryzanol from crude rice bran oil. Bioresource