Printed version ISSN 0001-3765 / Online version ISSN 1678-2690 http://dx.doi.org/10.1590/0001-3765201720170206
www.scielo.br/aabc | www.fb.com/aabcjournal
Climatic characteristics of the 2010-2016 drought in the semiarid Northeast Brazil region
JOSÉ A.MARENGO1, LINCOLN M.ALVES2, REGINA C.SALVALA1, ANA PAULACUNHA1
, SHEILABRITO1
andOSVALDO L.L.MORAES1
1
CEMADEN, Estrada Doutor Altino Bondesan, 500,
Distrito de Eugênio de Melo, 12247-016 São José dos Campos, SP, Brazil 2
INPE CCST, Rodovia Dutra Km 40, 12630-000 Cachoeira Paulista, SP, Brazil
Manuscript received on March 20, 2017; accepted for publication on May 19, 2017
ABSTRACT
This study discusses the climatological aspects of the most severe drought ever recorded in the semiarid region Northeast Brazil. Droughts are recurrent in the region and while El Nino has driven some of these events others are more dependent on the tropical North Atlantic sea surface temperature fields. The drought affecting this region during the last 5 years shows an intensity and impact not seen in several decades in the regional economy and society. The analysis of this event using drought indicators as well as meteorological fields shows that since the middle 1990s to 2016, 16 out of 25 years experienced rainfall below normal. This suggests that the recent drought may have in fact started in the middle-late 1990s, with the intense droughts of 1993 and 1998, and then the sequence of dry years (interrupted by relatively wet years in 2007, 2008, 2009 and 2011) after that may have affected the levels of reservoirs in the region, leading to a real water crisis that was magnified by the negative rainfall anomalies since 2010.
Key words: drought, Northeast Brazil, rainfall, water deficit, El Nino, vulnerability.
Correspondence to: José Antonio Marengo Orsini E-mail: [email protected]
* Contribution to the centenary of the Brazilian Academy of Sciences.
INTRODUCTION
The first two decades of the 21st Century are being
characterized by extreme climatic events that have led to natural disasters in central South America: drought in Northeast Brazil (NEB) during 2010-2016; drought in southeastern Brazil in 2014-15; droughts in Amazonia in 2005, 2010 and 2016; floods in Amazonia in 2009 and 2014; drought in Bolivia in 2016, with some of them almost
synchronized, for example, intense floods in in Amazonia and drought in NEB in 2012-13. The meteorological and oceanic mechanisms that lead to circulation and rainfall changes responsible for drought in NEB have been reported elsewhere, and they refer to the occurrence of El Nino, or to an anomalously warm tropical North Atlantic, or a combination of both (Nobre et al. 2016, Coelho et al. 2012, 2015a, b, Marengo et al. 2012, 2014, 2015, 2016a, b, Silva et al. 2013, Rodrigues and
McPhaden 2014).
security and subsistence agriculture in regions such as NEB, and Southeast Brazil, while in Amazonia it can impact biodiversity and population and increase the risk of fires. These regions have multiple stressors on natural and human systems derived in
part from significant changes in climate variability/
climate change and exacerbated by land use change. Extremes of climate variability at various
time scales have been affecting social and natural
systems and high socio-economic vulnerability of people living in the semiarid region in NEB and along the shores of main Amazon region rivers (Marengo et al. 2015, Vieira et al. 2015).
The semiarid part of NEB is perhaps the region most vulnerable to droughts. It occupies an area of about 1,542,000 km2 or about 11 % of the area of Brazil (IBGE 2010, Magalhaes et al. 1988). Vieira et al. (2015)explains that this region is strongly
characterized by regional differences such as high
rates of illiteracy, low-income levels, migration to urban centers, social exclusion, among others.
Besides cultural and economic differences, the region is affected by land degradation and desertification
exacerbated by anthropogenic factors. The region is
strongly characterized by regional differences such
as migration to urban centers and social exclusion, among others. In climatic terms, the region is vulnerable to the observed extremes of interannual climate variability, mainly droughts, and climate change scenarios indicate that the region will be
affected by rainfall deficit and increased aridity
in the second half of 21st century (Marengo and
Bernasconi 2015, IPCC 2012, 2014, CGEE 2016). Rainfall variability, land degradation, and
desertification and socionomic characteristics are
some of the factors that, if combined, could make this region one of the world’s most vulnerable to climate change (IPCC 2014). Droughts are natural phenomena, with large negative rainfall deviations
from the long-term climate, and in NEB, they affect
mainly vulnerable residents of the semiarid region,
creating situations of water deficit with impacts on
water, energy, and food security (Eakin et al. 2014). The semiarid NEB is one of the regions around the world that exhibit high seasonal climate predictability, as shown by operational forecasts in various climate centers around the world. This is mainly due to the dependence of its rainy season upon oceanic and atmospheric conditions in the tropical Pacific and Atlantic Oceans. Previous studies using dynamic and statistical modeling have demonstrated that the relationship between oceanic
and atmospheric conditions in the equatorial Pacific
and tropical Atlantic and the seasonal rainfall over the northern part of the Brazilian Northeast allows large climate events to be forecasted with a lead time of a few months (Hastenrath 1990, 2012, Hastenrath and Greischar 1993, Marengo et al. 2013, 2016a, b, Giannini et al. 2004, Nobre et al. 2006, Rodrigues and McPhaden 2014, Rodrigues et al. 2011, Hounsou-Gbo et al. 2016, among others). In NEB, exceptionally dry or wet episodes are often associated with large-scale phenomena such as El Niño and La Niña episodes, or with an intense meridional sea surface temperature (SST) gradient over the tropical Atlantic. During El Niño/La Nina episodes, there is a tendency toward the inhibition/ intensification of convective activity over the western tropical Atlantic, which is associated with predominantly reduced/enhanced precipitation in northern NEB (Magalhaes et al. 1988, IPCC 2014, Rodrigues and McPhaden 2014, Rodrigues et al. 2011, Marengo et al. 2016b and references quoted therein).
1888-1889, 1891, 1898, 1900, 1902-1903, 1907, 1915, 1919, 1932-1933, 1936, 1941-1944, 1951-53, 1958, 1966, 1970, 1976, 1979-1981, 1982-1983, 1986-87, 1992-1993, 1997-1998, 2001-2002, 2005, 2010 e 2012-2016.
Intense droughts during strong El Nino years were reported in 1877-79, 1897, 1899, 1902-03, 1919, 1951, 1958, 1966, 1982-83, 1986-87, 1997-98, 2005, 2010, and 2015 (ENSO years listed in https://www.esrl.noaa.gov/psd/enso/past_events. html). However, El Nino explains only a fraction of rainfall variability in NEB. Kane (1997) showed that of 46 El Nino events during 1849-1992 only 21 were associated with droughts in NEB, suggesting that not all El Nino years lead to drought in NEB, or that not all droughts in NEB are related to El Nino. In the recent droughts of 1992, 1998, 2002, and 2010 and now, 2012-2016, only those of 1998, 2002 and 2015-16 occurred during El Nino. On the other hand the drought in 2011–2012 occurred during a La Niña event (Rodrigues and McPhaden 2014).
In addition, rainfall in NEB is also affected
by the SST gradient in the tropical Atlantic, that governs the meridional displacement of the Inter Tropical Convergence Zone ITCZ, as demonstrated by various studies (Moura and Shukla 1981, Hastenrath 1990, 2012, Servain 1991, Andreoli et al. 2012, Nobre and Shukla 1996, Uvo et al. 1998, Marengo et al. 2013, 2016b, Rodrigues and
McPhaden 2014, Rodrigues et al 2011, Hounsou-Gbo et al. 2015, 2016). The seasonal latitudinal migration of the ITCZ over the tropical Atlantic is one of the mechanisms that induce precipitation in the region. During the February-May peak of the rainy season in northern NEB, an anomalously warm/cold tropical North Atlantic/South Atlantic favors an anomalously northward/southward position of the ITCZ, determining less/more rainfall in NEB. The NEB rainy season is also modulated by northward incursions of cold fronts from the South Atlantic Ocean. These cold fronts, linked
to the episodic South Atlantic convergence zone (SACZ), cross NEB moving northwestward from the southern Brazilian coastline (Rao et al 1996). Other remote processes, such as those originating from the midlatitudes in the Atlantic Ocean linked to the North Atlantic Oscillation (NAO), also contribute the rainfall variability in NEB (Wang et al. 2006).
During the extreme drought years of 1982-83 and 1997-98, both an El Nino and a warmer tropical North Atlantic Ocean were responsible for circulation changes that reduced rainfall over NEB (Nobre et al. 2016, Marengo et al. 2013). The drought in 2011-12 was due to a La Niña event,
with the cooling concentrated in the central Pacific
and warm surface waters in the tropical North Atlantic, which favored a northward migration of the ITCZ (Rodrigues and McPhaden 2014).
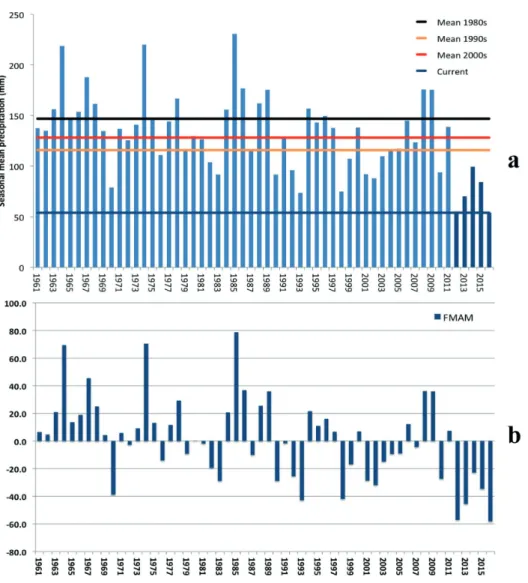
Since 2010 the semiarid region of NEB has been experiencing one of the longest and most intense droughts in decades, as shown in Figure 1a, b. From Fig 1b, the 2016 anomaly was comparable to that of 2012. As for 1998, the anomaly there seems comparable to those of 1993 and 1971.
The El Nino in 2015 increased the effect of the
drought that started in 2010. Because of losses in the agricultural, cattle ranching, water supply and local economies due to the drought, the federal government authorized the release of resources
for the affected districts to mitigate these negative
impacts.
According to the Ministry of Integration (www. mi.gov.br), during 2012-2016, 33.4 million people
were affected by the drought, with an estimated
damage of R$ 104 billion (about US $ 30.0 billion). Public investments to mitigate its impacts in NEB were established by the federal government, including special lines of credit for small farmers and distribution of water by trucks (carros pipa) in rural and urban areas. However, these measures
have proven insufficient to cope with the effects of
of energy and water crises that started in 2015 and continued through 2016 have increased in 2017.
Monitoring drought has also been an endeavor of various state agencies in NEB. By use of the Drought Monitor tool (Monitor da Seca, Martins
et al. 2016a, b), several data bases have been integrated to allow for calculations of various drought indices based on local and remote
sensing-derived data, and is mainly dedicated to informing decision makers and governments about the drought situation in each region, based
on technical information and previous validation by local experts. More information on the Drought Monitor and some operational products (monthly
maps of drought characteristics and severity) for NEB can be found at the National Water Agency ANA (monitordesecas.ana.gov.br). CEMADEN
(www.cemaden.gov.br) also provides monitoring information on drought situations and risk in all districts of NEB to help the government to prioritize
assistance for residents in regions with high risk of drought.
In this article we assess the climatic
characteristics of the current drought since 2010, using a combination of global reanalyses and sea surface temperature in the tropical Pacific and
Atlantic to identify the large-scale circulation features for the February-May peak rainy season in Northeast Brazil. We also assess regional rainfall and water deficit patterns to assess the rainfall
and water balance characteristics in the region since the beginning of the drought, and satellite derived vegetation products to show the possible
effects of the water deficit on the robustness of the
vegetation. Finally, possible actions that may help in the prevention and mitigation of the impacts of
droughts like this are discussed. The impacts of the drought of 2015-16 can be found in a companion paper by Alvala et al. (in press).
MATERIALS AND METHODS
Circulation fields were extracted from the National
Centers for Environmental Prediction (NCEP) global reanalysis version 2 (NCEP/DOE V2) (Kanamitsu et al. 2002) on a 2.5-deg latitude/ longitude grid and are available from 1948 to the present.
The observed SST data were provided by the UK Met Office Hadley Centre Sea Ice and Sea Surface Temperature (HadISST) data, available from January 1903 to the present (Parker et al. 1995a, b, c). Integrated moisture transport from surface to 500 hPa for the tropical Atlantic and
Pacific was calculated and plotted for the MAM
season from 2011 to 2016 to identify anomalies in
the northeasterly flow from the tropical Atlantic.
A longitude-height cross-section of the anomalous divergent circulation for the latitude band from the equator to 5°N-5°S and from 80°W to 100°E was plotted to identify the ascending descending motion over NEB and adjacent regions for each MAM season from 2011 to 2016.
the products from these rainfall data can be found at http://musa.cptec.inpe.br/.
The number of days with water deficit (DDN)
during the hydrological years October-September from 2011 to 2016 was calculated using a water balance model developed at INPE (Tomasella et al. 2000, Rossato et al. 2004). This variable represents the number of days in which the vegetation growth
is restricted by the water deficit in the soil (soil
water moisture below a critical value).
The vegetation supply water index VSWI has been widely applied as a drought indicator based on the philosophy of this approach. The VSWI, which is an additive combination of the Normalized Difference Vegetation Index (NDVI) and the thermal data (land surface temperature – LST), was established to detect vegetation stress, moisture and
drought-affected areas (Zhou et al. 2013, Yan et al.
2015). The VSWI can be used to monitor the onset, change, development and intensity of drought and the extent of the impact on vegetation. It is calculated by the ratio of the average 8-day versus the smoothed high-quality NDVI value in the MODIS composed data sensor onboard the AQUA and TERRA satellites (Cunha et al. 2015). Small VSWI values indicate a low canopy temperature and high vegetation index, which represent unstressed vegetation. The VSWI is characterized by varying moisture and the thermal conditions of vegetation and represents overall vegetation health. From the VSWI anomaly percentages it is possible to estimate the percentage of the area used for agricultural and livestock activities that
has been affected by the drought. Positive anomaly
percentages indicate various levels of vegetation stress, and a negative anomaly percentage means a favorable condition for vegetation.
RESULTS
Figure 1a, b shows time series of rainfall and anomalies from 1961 to 2016 for the peak of
the rainy season, February-May (FMAM). From that record, it is observed that 2010 was a dry year, and that during 2010-15 only 2011 showed rainfall above normal and the following years were characterized by precipitation below normal, with the lowest one in 2012. This suggests a multiannual
nature of this intense drought, and that the first
signals were detected starting in 2010 as shown by the negative rainfall departures in Figure 1b. The
figure also shows that the FMAM rainy seasons
in 1998 and from 2012 to 2016 were the most
deficient over the period 1961-2016, and that 2016
was even drier.
At the decadal time scale, the colored lines in Figure 1a show that the recent 5 years (2011-2016 “current”) have been drier as compared to the previous decades: 1980s, 1990s and 2000s, and the last year was the driest of all. Figure 1b shows that since the middle 1990s to 2016, 16 out of 25 years experienced rainfall below normal. This suggests that the recent drought may have in fact started in the middle-late 1990s, with the intense droughts of 1993 and 1998, and then the sequence of dry years (interrupted by relatively wet years in 2005, 2008,
2009 and 2011) after that have affected the levels of
reservoirs in the region. This became a real water
crisis that was magnified by the anomalously low
rainfall since 2010.
RAINFALL DISTRIBUTION DURING 2011-2016
In northeastern Brazil, with the continuation of the intense drought that started in 2012 (or as
early as 2010), for a fifth consecutive year, parts
lower rainfall in northeastern NEB (Marengo et al. 2015). In addition, in this year the Madeen Julian Oscilltion MJO was in an unfavorable phase for convective activity and precipitation. As a result,
the ITCZ did not exert a significant contribution
towards the rain in northeastern Brazil and a large portion of the region was experiencing much drier conditions than average The MJO is a subseasonal
pattaren of variability of the tropical Pacific and its
variations that contributed to favouring or inhibiting conditions to enable lor disable the convection and rainfall in the NEB region (Alvarez et al. 2015).
The year 2010-11 was a relatively wet year (Marengo et al. 2012) while 2012 saw severe drought, with rainfall anomalies varying from 300 to 400 mm/year below normal in all of NEB. According to Silva et al. (2013), precipitation was below normal between December 2011 and May 2012 in the central/eastern Amazon and the Northeast regions, with maximum deficits occurring in March and April. The El Niño– Southern Oscillation (ENSO) phenomenon has a
significant impact on rainfall over tropical Brazil,
and in several cases below-average rainfall over Figure 1 - (a) FMAM rainfall over NEB Brazil from 1961-2016, in mm. Colored horizontal lines
both regions is associated with warmer-than-average SSTs (El Niño). However, the 2012 Northeast Brazil rainy season did not follow this pattern, since below-average SSTs were present
in the central equatorial Pacific (La Niña). Other
factors, such as the distribution of SST anomalies in the tropical Atlantic and, consequently, the position and intensity of the ITCZ, and transient systems (e.g., cold fronts and upper-level subtropical
cyclonic vortices) are also important, and affect
rainfall variability in Northeast Brazil. During the
deficient rainy season of 2012, many areas received
less than 50% of the average rainfall for the season, leading many municipalities to declare a state of emergency.
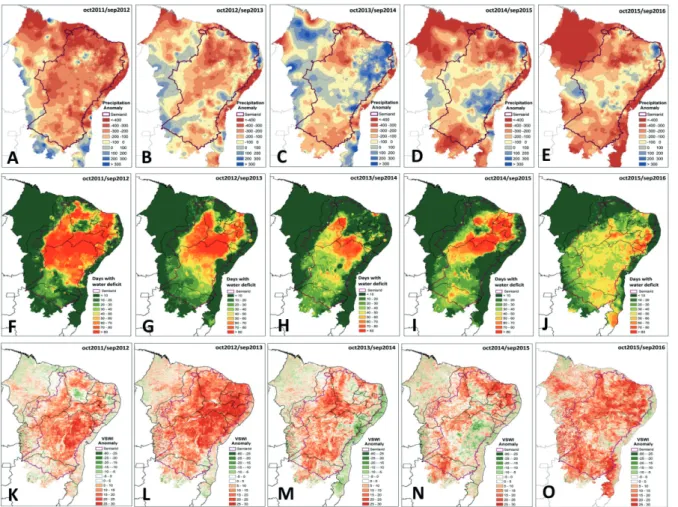
During 2012-13, rainfall was between 100 and 300 mm/year below average in the semiarid NEB, and in the northern region rainfall was 300-400 mm/year below normal. In 2013-14 rainfall above normal was measured over the eastern part of the NEB region (100-300 mm/year above normal), while negative rainfall anomalies were detected mainly in the northern and southern part of the semiarid NEB (100-300 mm/year below normal). Below normal precipitation was observed during 2014-15 and 2015-16 in both regions of NEB.
WATER DEFICIT AND IMPACTS ON VEGETATION
Figure 2f-j show the evolution of the number of dry days (DDN) and the anomaly in percent in the water supply (VSWI, Figure 2k-o) during the hydrological years from 2011-12 to 2015-16. The
DDN indicates the number of days with water deficit.
When rainfall through the rainy season is adequate and well distributed, DDN tends to be lower, while during drought situations DDN is higher. In Figure 2 it can be seen that from 2011 to 2014 the semiarid
region exhibits large areas with water deficit due
to reductions in rainfall (Figure 1). In 2011-12 the
region with water deficit includes almost the entire
semiarid part of NEB, including the south-central
part of the state of Bahia, the states of Rio Grande do Norte, Ceara and Piaui (Figure 2a). During that period, accumulated rainfall was below 500 mm, resulting in water stress and less water supply for vegetation (Figure 3a), inducing low vegetation productivity as indicated by the negative VSWI anomalies. In 2012-13 and 2014-15 the largest concentration of DDN is located over the central part of the semiarid of NEB from northern Bahia, all the way to western Pernambuco, eastern Piaui and western Ceara (Figures 2b,c, d).
In terms of the VSWI anomalies, Figure 2k-o show that during 2011-12 and 2012-13 approximately 85% of the semiarid of NEB was affected by an extensive drought, particularly the northern and central regions. In 2013-14 accumulated rainfall in the region was larger than
in the previous years. Accordingly the area affected
by drought reached 40% of the region, and the impacts were less intense, mainly in the northern part of the semiarid region.
From Figures 1 and 2, it can be seen that the hydrological year 2012-13 was the one with highest drought intensity, and by 2015-16 drought continued to impact water availability for
vegetation. By 2016, water deficit still persisted
across the semiarid region of northeast Brazil, being more intense in the region between southern Bahia and the northern parts of the state of Minas Gerais over the San Francisco River basin.
According to CEMADEN, the drought situation was also reflected in the levels of the San Francisco River, and by February 2017, the
hydrological situation in this river basin reflected the effect of the rainfall of 129.3 mm, or 73.6%
LARGE SCALE CIRCULATION PATTERNS LEADING TO THE 2010-2016 NEB DROUGHT
Beginning in 2011-12, the causes of this drought are related to anomalies in the large-scale circulation, where warm surface water in the tropical North Atlantic favored an anomalously northward migration of the ITCZ. This reduces the vertically integrated moisture transport from the tropical North Atlantic to the region (Marengo et al. 2016a, b).
Figure 3a-c and g-i show distribution of SST and moisture transport anomalies in the tropical Atlantic and Pacific. The moisture transport
anomalies for the MAM season from 2012 to 2016 suggest a weakened transport from the tropical North Atlantic over the semiarid NEB, as shown by the moisture transport anomalies from the south.
The year 2011 was a wet year and the tropical South Atlantic was warmer than normal, favoring the southward advance of the ITCZ over NEB.
The causes of the drought in the semiarid NEB in 2011-13 were discussed in Marengo et al. (2013)
and Rodrigues and McPhaden (2014). During that time, while dry conditions occurred in NEB extremely wet conditions were detected almost at the same time in Amazonia, and the circulation features Figure 2 - (a-e): Rainfall anomalies (in mm) for the hydrological year October-September from 2011-12 to 2015-16 [CPTEC INPE, INMET and CEMADEN]; (f-j) Number of days with water deficit (number of dry days) [Tomasella et al. 2000, Rossato et
were consistent with anomalously cold surface
waters over the equatorial Pacific (La Nina), with
ascending motion in eastern Amazonia, a typical
response to the cold water in the equatorial Pacific
(Ambrizzi et al. 2004). Upper-level divergence was detected over Amazonia, upper-level convergence over NEB during austral summer, with subsidence over NEB during the peak rainy season, FMAM, in that region during 2012.A longitude-height cross section of the anomalous vertical and divergent circulation for the latitude band from 5°N to 5°S (Figure 3 d-f, j-l) shows anomalous sinking motion in the mid-troposphere (400 hPa to 850 hPa) over Northeast Brazil (30°W–40°W) and anomalous rising motion over the Amazon Basin (in 2012) or
in the extreme eastern Pacific (in 2014 and 2015),
consistent with the patterns of SST anomalies. This suggests that the distribution of SST anomalies in
the tropical Atlantic and Pacific may have caused
a westward shift in the divergent circulation cell (regional Walker circulation cell) from its normal position, contributing to the Northeast Brazil drought and heavy rainfall in the western Amazon Basin (in 2012). This anomalous subsidence was more intense and wider in extent in 2012 and 2016. In 2013 and 2016 the tropical North Atlantic was warmer than normal. An anticyclonic anomaly was detected from southeastern Brazil extending to NEB since MAM 2012 and this was a key factor during the droughts of 2014 and 2015 in southeastern Brazil (Nobre et al. 2016). In NEB this anomaly increased subsidence at low levels
and reduced the moisture influx coming from the
tropical North Atlantic into NEB.
Considering that deficient rainfall and drought
have occurred in the past during El Nino years, the 2011-12 drought would be unexpected, since below-average SSTs were present in the central equatorial Figure 3 - (a-c; g-i): SST and vertically integrated moisture transport (surface-500 hPa) anomalies for MAM 2011 to 2016 in the
Tropical Pacific-South America-Tropical Atlantic sector. (d-f; j-l): Pressure-longitude section (80o W-100o
E) of the mean (top) and anomalous (bottom) divergence (contour interval is 1 x 10⁻⁶
s-1) and divergent circulation averaged between 5o N-5o
Pacific (La Niña). The reduced rainfall during the
El Nino years of 2015 and 2016 aggravated the drought problem detected since 2011. The analyses of rainfall time series suggest that the recent drought may have in fact started in the middle-late 1990s, with the intense droughts of 1993 and 1998, and then the sequence of dry years (interrupted by relatively wet years in 2005, 2008, 2009 and 2011)
after that may have affected the levels of reservoirs
in the region, leading to a real water crisis that was
magnified by the negative rainfall anomalies since
2010. The La Nina conditions during 2012-13 were
not enough to offset the previous drought conditions
established since the 1990’s, when strong El Nino events occurred in 1998, 2003, 2007, 2011 and 2015.
CONCLUSIONS
The drought conditions that started to intensify in 2012 were linked to an anomalously warm Tropical North Atlantic Ocean that favored an anomalously northward position of the ITCZ and leaving less rainfall in NEB. The La Nina event conditions in 2013 were not enough to offset the drought conditions established years before, and the El Nino in 2015 worsened drought conditions after that. The length and intensity of this drought have
affected the regional economy of the semiarid NEB
in more than 1100 municipalities, generating social problems both in urban and rural areas (Ministry of Integration-www.mi.gov.br; CEMADEN-www. cemaden.gov.br).
The small-scale farming and cattle ranching in this region and their dependence on rainfall make it one of the most vulnerable to the current, previous and also future droughts. Within the NEB region,
the most affected areawas the northern part of the
state of Bahia, where beans and corn are grown. The extreme dry conditions observed in this region
contributed to an increase in wildfires and damageto
crops, with local people depending on water to be trucked in (Alvala et al.in press).
This current drought in NEB has sparked a new round of discussions on improving drought policy and resilience to drought, - as well as management at the federal and state levels in the region of the drought - as a socio-economic-environmental problem. Although drought is a recurrent phenomenon in NEB, it is perceived that risk and vulnerability are still high, particularly in its semiarid rural areas. There is a need for actions in which the scientific and the decision makers communities can work together on drought issues, focusing on reducing vulnerability, and building resilience.
The Drought Monitor from ANA and the Monitoring Program of Drought in Semiarid NEB
by CEMADEN are excellent examples of scientific
knowledge and technology working together in building indicators for drought monitoring and forecasting. As noted by Gutierrez et al. (2014), the oldest federal institution dedicated to drought mitigation in the Brazilian semiarid region was the Inspection Agency for the Combat of Droughts (Inspetoria de Obras Contra as Secas – IOCS) created in 1909. In spite of a long and detailed institutional history of drought and of drought combat by means of government actions in NEB for managing and adapting to droughts there (as reported in a companion paper by Alvala et al. 2017), there is a need to improve preparation and response measures for drought episodes. Integrating drought monitoring and seasonal forecasting provides a better way to forecast possible impacts of drought, identifying risks and vulnerabilities and allowing for better decision making in terms of coping measures that can guarantee water, energy and food security for the NEB population.
a number of measures that have been adopted, to a greater or lesser degree, to cope with drought and to mitigate the problem: they include cisterns, barrages (dams), underground barrages in the dry river beds, water wells and groundwater, and water trucks, or even pipelines for water distribution or transposition of waters. An integration of drought and desertification monitoring and seasonal forecastingcan help in decision making in terms of adaptation measures for short, medium and long term climate variability and also for future climate change.
ACKNOWLEDGMENTS
This study was funded by Fundação de Amparo à Pesquisa do Estado de São Paulo (FAPESP) 2015/50122-0 and DFG-GRTK 1740/2, and by the INCT-Climate change project Phase 2 (Grant CNPq 465501/2014-1/Public call MCTI/CNPQ/ CAPES/FAPS Nº 16/2014).
REFERENCES
ALVALARCS, CUNHA AP, BRITO SSB, SELUCHI ME, MARENGO JA, MORAES OLL AND CARVALHO MA. In Press. Drought Monitoring in the Brazilian Semiarid Region. An Acad Bras Cienc 89.
ALVAREZ MS, VERA CS, KILADIS GN AND LIEBMANN B. 2015 Influence of the Madden Julian Oscillation on precipitation and surface air temperature in South America. Clim Dyn 46 (1): 245-262.
AMBRIZZI T, SOUZA EB AND PULWARTY RS. 2004. The
Hadley and Walker regional circulations and associated ENSO impacts on the South American seasonal rainfall. In: Diaz HF and Bradley RS (Eds), The Hadley Circulation: Present, Past and Future. Kluwer, Dordrecht, 21, p. 203-235.
ANDREOLI R, DE SOUZA F, KAYANO MT AND CANDIDO
LA. 2012. Seasonal anomalous rainfall in the central and eastern Amazon and associated anomalous oceanic and atmospheric patterns. Int J Climatol 32(8): 1193-1205. ARAUJO J. 1982. Barragens no Nordeste do Brasil:
Experiencia do DNOCS em Barragens na Regiao Semi-Arida. Departamento Nacional de Obras contra as Secas, Ministerio do Interior, p. 15.
CGE. 2016. Desertificação, degradação da terra e secas no Brasil – Brasília - Centro de Gestão e Estudos Estratégicos, CGEE, 2016. Brasilia, DF, 252 p.
COELHO CAS, CAVALCANTI IAF, COSTA SMS, FREITAS SR, ITO ER, LUZ G, SANTOS AF, NOBRE CA, MARENGO JA AND PEZZA AB. 2012. Climate diagnostics of three major drought events in the Amazon and illustrations of their seasonal precipitation predictions. Meteor Appl 19: 237-255.
COELHO CS, CARDOSO DF AND FIRPO MF. 2015a. Precipitation Diagnostics of an Exceptionally Dry Event in Sao Paulo. Brazil. Theor and App Clim 125: 769-784. COELHO CS ET AL. 2015b. The 2014 Southeast Brazil
Austral Summer Drought: Regional Scale Mechanisms and Teleconnections. Clim Dyn 46: 3737-3752.
CUNHA APMA, ALVALA RCS, NOBRE CA AND CARVALHO MA. 2015. Monitoring vegetative drought dynamics in the Brazilian Semiarid Region. Agric For Meteorol 214: 494-505.
EAKIN HC, LEMOS MC AND NELSON DR. 2014. Differentiating capacities as a means to sustainable climate change adaptation. Glo Env Change 27: 1-8.
GIANNINI A, SARANAVAN R AND CHANG P. 2004. The Preconditioning Role of Tropical Atlantic Variability in the Development of the ENSO Teleconnection: Implications for the Prediction of Nordeste Rainfall. Clim Dyn 22: 839-855.
GUTIERREZ APA, ENGLE NL, DE NYS E, MOLEJON C AND MARTINS ES. 2014. Drought preparedness in Brazil. Wea and Clim Extrem 3: 95-106.
HASTENRATH S. 1990. Prediction of Northeast Brazil rainfall anomalies. J Climate 3:893-904.
HASTENRATH S. 2012. Exploring the climate problems of Brazil’s Nordeste: a review. Clim Change 112: 243-251. HASTENRATH S AND GREISCHAR L. 1993. Circulation
Mechanisms Related to Northeast Brazil Rainfall Anomalies. J of Geophys Res 98: 5093-5102.
HONSOU-GBO GA, ARAUJO M, BOURLES B, VELEDA D AND SERVAIN J. 2015. Tropical Atlantic Contributions to Strong Rainfall Variability along the Northeast Brazilian Coast. Advances in Meteorology 2015, Article ID: 902084. HOUNSOU-GBO GA, SERVAIN J, ARAUJO M, MARTINS
ES, BOURLES B AND CANAIX G. 2016. Oceanic Indices for Forecasting Seasonal Rainfall over the Northern Part of Brazilian Northeast. Am J Clim Change 5: 261-274. IBGE. 2010. Estados: População, Instituto Brasileiro de
Geografia, Rio de Janeiro: http://censo2010.ibge.gov.br/ apps/atlas/ (last access: 10 April 2013).
Cambridge University Press, Cambridge, UK, and New
York, NY, USA, 582 p.
IPCC. 2014. Central and South America. In: Climate Change 2014: Impacts, Adaptation, and Vulnerability. Part B: Regional Aspects. In: Barros VR et al. (Eds), Contribution of Working Group II to the Fifth Assessment Report of the Intergovernmental Panel on Climate Change. Cambridge University Press, Cambridge, United Kingdom and New
York, NY, USA, p. 1499-1566.
KANAMITSU M, EBISUZAKI W, WOOLLWN J, YANG
SK, HNILO SK, FIORINO M AND POTTER GL. 2002. NCEP-DOE AMIP-II Reanalysis (R-2). Bull Amer Met Soc 83(11): 1631-1643
KANE RP. 1997. Prediction of droughts in Northeast Brazil: Role of ENSO and use of periodicities. Int J Climatol 17: 655-665.
MAGALHAES A ET AL. 1988. The effects of climate variations on agriculture in Northeast Brazil. In: Parry M, Carter T and Konijn N (Eds), The Impact of Climate Variations on Agriculture. Vol 2. Assessments in semiarid regions, Kluwer Academic Publishers, Amsterdam, p. 277-304.
MARENGO JA, ALVES LM, ESPINOZA JC AND RONCHAIL J. 2014. Tropical South America east of the Andes, in State of the Climate in 2013. Bull Amer Met Soc 95(7): S170-S171.
MARENGO JA, ALVES LM, SOARES WR, RODRIGUEZ DA, CAMARGO H, RIVEROS MP AND PABLO AD. 2013. Two Contrasting Severe Seasonal Extremes in Tropical South America in 2012: Flood in Amazonia and Drought in Northeast Brazil. J Clim 26(22): 9137-9154. MARENGO JA AND BERNASCONI M. 2015. Regional
differences in aridity/drought conditions over Northeast Brazil: present state and future projections. Clim Change 129:103-115.
MARENGO JA, ESPINOZA JC, RONCHAIL J AND ALVES LM. 2015. Tropical South America east of the Andes, in State of the Climate in 2014. Bull Am Met Soc 96(7): S179-S182.
MARENGO JA, ESPINOZA JC, RONCHAIL J AND ALVES LM. 2016a. Tropical South America east of the Andes, in State of the Climate in 2015. Bull Am Met Soc 97(8): S184-S185.
MARENGO JA, RONCHAIL J, AALVES LM AND BAEZ J. 2012. Tropical South America East of the Andes, in State of the Climate in 2011. Bull Am Met Soc 93(7): S175-S177. MARENGO JA, TORRES RR AND ALVES LM. 2016b.
Drought in Northeast Brazil—past, present, and future. Theor Appl Climatol: 1-12.
MARTINS ES, MOLEJON QUINTANA C, SILVA DIAS, MAF, VIEIRA RF, BIAZETO B, FORATINI GD AND MARTINS JC. 2016a. The Technical and Institutional Case: The Northeast Drought Monitor as the Anchor and
Facilitator of Collaboration, Chapter 3 In: Engle N, De Nys E and Magalhaes AR (Eds), Drought in Brazil: proactive management and policy. Boca Raton, F., Taylor & Francis, 2016. | Series: Drought and water crises, p. 37-48. MARTINS ES, VIEIRA SILVA RF, BIAZETO B AND
MOLEJON QUINTANA C. 2016b. Northeast Drought Monitor: The Process, Chapter 11. In: Engle N, De Nys E and Magalhaes AR (Eds), Drought in Brazil: proactive management and policy. Boca Raton, FL: Taylor & Francis, 2016. Series: Drought and water crises, p. 143-166. MATHERON G. 1969. Le krigeage universel. Technical
Report 1, Paris School of Mines. Cah. Cent. Morphol. Math. Fontainbleau.
MOURA AD AND SHUKLA J. 1981. On the Dynamics of Droughts in Northeast Brazil: Observations, Theory and Numerical Experiments with a General Circulation Model. J Atmos Sci 38: 2653-2675.
NOBRE CA, MARENGO JA, SELUCHI ME, CUARTAS LA AND ALVES LM. 2016. Some Characteristics and Impacts of the Drought and Water Crisis in Southeastern Brazil during 2014 and 2015. J Wat Res Prot 8: 252-262. NOBRE P, MARENGO JA, CAVALCANTI IFA, OBREGON
G, BARROS V, CAMILLONI I, CAMPOS N AND FERREIRA AG. 2006. Seasonal-to-decadal predictability and prediction of South American climate. J Clim 19(23): 5988-6004.
NOBRE P AND SHUKLA J. 1996. Variations of sea surface temperature, wind stress, and rainfall over the tropical Atlantic and South America. J Clim 9: 2464-2479. PARKER DE, FOLLAND CK, BEVAN A, WARD MN,
JACKSON M AND MASKELL K. 1995b. Marine surface data for analysis of climatic fluctuations on interannual to century timescales. In: Martinson DG et al. (Eds), Natural Climate Variability on Decade-to-Century Time Scales. National Academy Press, p. 241-250.
PARKER DE, FOLLAND CK AND JACKSON M. 1995a. Marine surface temperature: Observed variations and data requirements. Clim Change 31: 559-600.
PARKER DE, JACKSON M AND HORTON EB. 1995c. The GISST2.2 sea surface temperature and sea ice climatology. CRTN 63, 16 pp. plus figures. Available from Hadley Centre for Climate Prediction and Research, Meteorological Office, London Road, Bracknell, Berkshire
RG12 2SY, United Kingdom.
RAO VB, CAVALCANTI IFA AND HADA K. 1996. Annual variation of rainfall over Brazil and water vapor characteristics over South America, J Geophys Res D: Atmospheres 101(21): 26539-26551.
RODRIGUES RR AND MCPHADEN MJ. 2014 Why did the 2011-2012 La Niña cause a severe drought in the Brazilian Northeast? Geophys Res Lett 4:1012-1018.
ROSSATO L, TOMASELLA J AND ALVALA RCS, 2005. Avaliação da Umidade do Solo no Brasil durante o Episódio El Niño (1982/83). Rev Bras Agromet 13(1): 143-153.
SERVAIN J. 1991. Simple Climatic Indices for the Tropical Atlantic Ocean and Some Applications. J Geophys Res 96: 15137-15146.
SILVA VBS, KOUSKY VE, SILVA FDS, SALVADOR MA
AND ARAVEQUIA JA 2013. The 2012 Severe Drought over Northeast Brazil, Sidebar 7.2 in State of Climate in 2012. Bull Am Met Soc 94(7): S240.
TOMASELLA J, HODNETT MG AND ROSSATO L. 2000. Pedotransfer functions for the estimation of soil water retention in Brazilian soils. Soil Sci Soc Am J 64: 327-338.
UVO CB, REPELLI CA, ZEBIAK SE AND KUSHNIR Y.
1998. The Relationship between Tropical Pacific and
Atlantic SST and Northeast Brazil Monthly Precipitation. J Climate 11: 551-562.
VIEIRA RMSP ET AL. 2015. Identifying areas susceptible to desertification in the Brazilian northeast. Solid Earth 6: 347-360.
WANG C, ENFIELD DB, LEE SK AND LANDSEA CW. 2006. Influences of the Atlantic warm pool on western hemisphere summer rainfall and Atlantic hurricanes. J Climate 19(12): 3011-3028.
WILHITE DA, SIVAKUMAR MVK AND PULWARTY
R. 2014. Managing drought risk in a changing climate: The role of national drought policy. Weather and Climate Extremes 3: 4-13.
ZHOU L, WU J, ZHANG J, LENG S, LIU M, ZHAO L,
ZHANG F AND SHI Y. 2013. The integrated surface