ORIGINAL ARTICLE
Relevance of wood anatomy and size of Amazonian trees
in the determination and allometry of sapwood area
Luiza Maria Teophilo APARECIDO¹,3*, Joaquim dos SANTOS¹, Niro HIGUCHI¹, Norbert KUNERT¹,²,4 ¹ Instituto Nacional de Pesquisas da Amazônia − INPA, Coordenação de Dinâmica Ambiental − CODAM, Av. Andre Araújo 2936, CEP 69060-001, Manaus, Amazonas, Brazil ² Max-Planck-Institut für Biogeochemie, Abteilung Biogeochemische Prozesse, Hans-Knöll Str. 10, 07745 Jena, Germany
3 Present address: School of Life Sciences, Arizona State University, Tempe, AZ, 85281, USA4 Present address: Conservation Ecology Center, Smithsonian Conservation
Biology Institute, Front Royal, VA, 22630, USA * Corresponding author: lmtaparecido@gmail.com
ABSTRACT
Hydrological processes in forest stands are mainly influenced by tree species composition and morpho-physiological characteristics. Few studies on anatomical patterns that govern plant hydraulics were conducted in tropical forest ecosystems. Thus, we used dye immersion to analyze sapwood area patterns of 34 trees belonging to 26 species from a terra firme forest in the central Brazilian Amazon. The sapwood area was related with wood anatomy and tree size parameters (diameter-at-breast-height - DBH, total height and estimated whole-tree volume). Exponential allometric equations were used to model sapwood area using the biometrical variables measured. Sapwood area traits (cross-section non-uniformity and heartwood visibility) varied significantly among and within species even though all were classified as diffuse porous. DBH was strongly and non-linearly correlated with sapwood area (R2 = 0.46, P < 0.001), while no correlation was observed with vessel-lumen diameter (P = 0.94) and frequency (P = 0.58). Sapwood area and shape were also affected by the occurrence of vessel obstruction (i.e., tyloses), hollow stems and diseases. Our results suggest that sapwood area patterns and correlated variables are driven by intrinsic species characteristics, microclimate and ecological succession within the stand. We believe that individual tree sapwood characteristics have strong implications over water use, hydrological stand upsaling and biomass quantification. These characteristics should be taken into account (e.g., through a multi-point sampling approach) when estimating forest stand transpiration in a highly biodiverse ecosystem.
KEYWORDS: ecohydrology; active xylem; tyloses; vessels; Brazilian Amazon
Relevância da anatomia da madeira e dimensões de árvores amazônicas
na determinação e alometria do alburno
RESUMO
Processos hidrológicos de povoamentos florestais são predominantemente influenciados pela composição de espécies arbóreas e suas características morfo-fisiológicas. No entanto, existem poucos estudos sobre os padrões anatômicos que determinam o sistema hidráulico de plantas em ecossistemas tropicais. Por isso, nosso objetivo foi o de analisar os padrões da área do xilema ativo em 34 árvores de 26 espécies de uma floresta de terra firme na Amazônia central por meio de imersão em solução de corante. A área do xilema ativo foi relacionada a características autoecológicas das espécies, anatomia da madeira e parâmetros de crescimento (diametro à altura do peito - DAP, altura total e volume total). Equações alométricas exponenciais foram utilizadas para ajustar a área do xilema às variáveis medidas. Características do alburno (área transversal não-uniforme e visibilidade do cerne) variaram significativamente entre e dentro de espécies, apesar de que todas as espécies apresentaram vasos difusos. DAP foi fortemente e não-linearmente correlacionado à área do alburno (R2 = 0,46; P < 0,001), enquanto diâmetro (P = 0,94) e frequência (P = 0.58) de vasos não apresentaram nenhum grau de relacionamento. O tamanho e forma do alburno foram afetados pela ocorrência de obstrução de poros (tilose) e troncos ocos. Estes padrões sugerem que a área do xilema é influenciada por características intrínsicas de cada espécie, microclima e estágio sucessional dentro do povoamento. Nossos resultados implicam que características individuais de árvores podem fortemente influenciar o transporte de água e, consequentemente, os processos hidrológicos e a quantificação de biomassa do povoamento. Essas caracteristicas deveriam ser consideradas (por exemplo, por meio da coleta de amostras da área do xilema ativo ao longo da área transversal) ao estimar-se a transpiração de uma floresta altamente biodiversa.
PALAVRAS-CHAVE: ecohidrologia; xilema ativo; tilose; vasos; Amazônia brasileira
INTRODUCTION
The Amazonian forest harbors the most biodiverse plant communities of the world (ter Steege et al. 2013) and maintains a significant role in global water recycling and carbon storage within its mostly old, pristine forests (Shuttleworth 1988; Fauset et al. 2015). These older stands have developed very complex vertical canopy structures composed of large trees with vast canopies that shade less robust midstory strata and an even sparser understory canopy (Amaral et al.
2000). These multi-layered, heterogeneous stands influence the microclimatic conditions within the canopy, which will directly affect the development of plant individuals (Kammesheidt 2000; Dietz et al. 2007). The increase in light intensity, lower relative humidity and higher vapor pressure deficit resulting from natural and anthropogenic forest gaps can be detrimental for late successional trees and favor the expansion of early successional species (Kammesheidt 2000). Not only will species differ, but reminiscent trees are required to develop certain physiological strategies to cope with these changes, such as increasing sapwood area to avoid cavitation-embolism (Brodersen and McElrone 2013).
Sapwood area plays an important role when estimating whole-tree and stand transpiration (Cermak and Nadezhdina 1998). The use of sapwood area as an upscaling parameter has been widely studied and applied in the field of ecohydrology, specifically when coupled with sap flux measurements (Meinzer et al. 2004; Horna et al. 2011; Aparecido et al. 2016; Kunert et al. 2017; Moore et al. 2017). However, sapwood area determination is difficult when using destructive methods, such as dye-immersed or thermo-imaged fallen tree samples (Granier et al. 1994), or non-destructive methods, such as dyed increment cores (Gebauer et al. 2008) or electromagnetic imaging equipment (Bieker and Rust 2010). The major issue underlying non-destructive methods is the clarity of sapwood delimitation (e.g., heartwood color distinction; Granier et al. 1994; Giothiomi and Dougal 2002) and its uniformity throughout the cross-section, especially when few measurement points are taken and extrapolated to all other directions (Gebauer et al. 2008).
With secondary growth, trees naturally tend to a gradual deactivation of old xylem tissues, although at different rates and magnitude (Stewart 1966), due to regulatory processes that maintain the sapwood area at an optimum metabolic level (i.e., water use and growth; Bamber 1975). However, xylem deactivation can be accelerated through vessel embolism-cavitation, when trees are fully exposed to high amounts of radiation, vapor pressure and/or soil moisture deficit (Machado and Tyree 1994; Schultz and Matthews 1997). There are very few studies that describe in detail the external and internal wood characteristics of tropical tree species and the different growth rates that might affect sapwood area formation and over or underestimation of its allometric
modelling (Enquist 2002; Čermák et al. 2004). Thus, to avoid errors that might lead to over or underestimation of evapotranspiration and carbon storage, it is important to assess the drivers that might influence the development of sapwood in tropical trees (e.g., wood anatomy and ecological traits), and which variables are the most reliable for the indirect estimation of sapwood area. Hence, we determined the sapwood area of 34 trees (26 species) from an old-growth terra firme forest in the central Brazilian Amazon. Our objective was to determine whether wood anatomical variables (vessel-lumen diameter, frequency and vessel element length) and tree size variables (diameter at breast height, total height and volume) are directly related to xylem development. We used macroscopic and microscopic wood descriptions and allometric equation modelling for a heterogeneous group of Amazonian tree species. We hypothesized that sapwood area allometry is not universal (Meinzer et al. 2001) and will vary as a function of ecological successional stage, independently of size and species.
MATERIAL AND METHODS
Study site and tree sampling
The study was conducted in an old growth, lowland forest located approximately 60 km northeast of the city of Manaus, Amazonas state, Brazil, in the Experimental Station for Tropical Silviculture ZF-2 (02°37’31.8”S; 60°08’24.7”W) of the Instituto Nacional de Pesquisas da Amazônia (INPA). The non-inundating, flat terrain is covered with a mature and species-rich evergreen terra firme forest. The climate is characterized as hot and humid with an average annual temperature of 25.8°C, relative air humidity between 84 and 90% throughout the year, and 2547 mm of annual rainfall (Kunert et al. 2017).
independent variables to evaluate to which extent sapwood area may be influenced by variables that have different degrees of dependence to stand density and quality (Machado and Figueiredo Filho 2006).
Sapwood area determination
Sapwood area was determined through immersion of the harvested tree logs (Chavarro-Rincon 2009) in an aqueous dye solution (0.1% indigo carmine) (Andrade et al. 1998; Meinzer
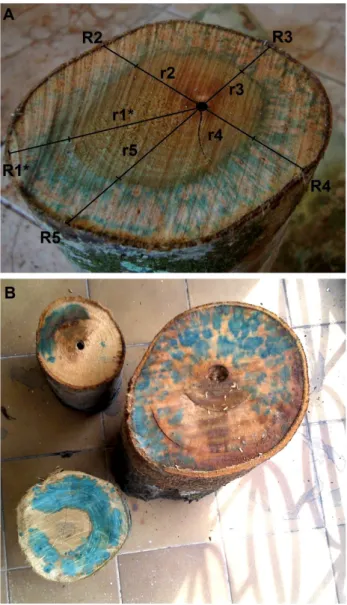
et al. 2001) immediately after harvest. Logs were left immersed for up to four hours until blue staining was fully apparent on the top cross-section surface, indicating the active conductive area. Most of the sections showed signs of staining within a couple of hours after immersion. Samples that did not show clear sapwood staining after that time were excluded from the dataset. Sapwood area (As) was measured using five radii marked along the cross-section starting from the pith (Nutto
et al. 2012). The first radius was the longest (i.e., the reference radius – Rn* of Figure 1a). Each radius had two measurements: total radius [distance from the pith to the bark base (R)] and heartwood (or inactive area) radius [distance from the pith to the base of the dye-stained area (r)] (Figure 1a). The difference between R and r resulted in the sapwood depth (Supplementary Material, Table S1). Through each radius we estimated total cross-section area and heartwood cross-section area and subtracted these variables to achieve total sapwood area of each tree
1
𝑅𝑅̅ 𝑟𝑟̅ (Aparecido et al. 2015). Measuring five different radii guaranteed that variations within an irregularly shaped cross-section and non-continuous conductive sapwood area were properly accounted for (Figure 1b). To test this hypothesis, we also estimated sapwood area using only two radii measurements (longest and shortest) and compared them with the estimates obtained through the 5-radii method (Supplementary Material, Table S2).
Wood anatomy characterization
The tree samples were characterized through macroscopic (wood characteristics for species identification) and microscopic wood description techniques (histological slides and maceration for vessel diameter and frequency measurements). The macroscopic description followed the technical standards recommended by the Pan-American Technical Standards Commission (COPANT 1974). Dry wood samples were taken from each tree section and were later shaped into 1.5 × 2.0 × 3.0 cm blocks. Wood structures and characteristics such as heartwood color, smell, texture, type of bark, and parenchyma description were used to determine and validate tree species identification. Characteristics observed during harvesting (e.g., exudates, smell, disease, hollow stem) were also considered for tree identification and as complementary wood characteristics.
Histological microscope slides were prepared for the measurement of tangential vessel dimensions, specifically for
lumen-diameter (µm) and frequency (vessels per mm2), and to record tylose occurrence. Slides were mounted with 18 µm thick wood sections (American Optical 860 microtome, AO Scientific Division, Buffalo, NY) previously dehydrated in an ethyl series (50, 70, and 100%; Johansen 1940) and stained with safranin-fucsin for tissue observations. Vessel diameter and frequency were measured using an Olympus Tokyo projector at 100× resolution (TandD VR-71, T&D Corporation, Shimadachi Matsumoto City, Japan) by randomly choosing 25 vessels per tree sample for each measurement type (Carlquist 1988).
Figure 1. Indigo carmine stained sapwood area of a few log sections. A. Protium
Vessel element length (µm) required a chemical maceration process to dissociate the vessel elements from fiber and parenchyma (Johansen 1940; Franklin 1945). Small wood slivers were submerged and stored in sealed beakers for 48 hours in a maceration solution consisting of 1:4:5 of hydrogen peroxide, distilled water and acetic acid. After washing with distilled water, the samples were loosened and dissociated, and then submerged in safranin-fucsin dye. The vessel elements were then set on microscope slides and 25 vessel elements were randomly measured using a ruler and the same Olympus Tokyo projector at 100× resolution. All wood anatomy variables were quantified and categorized according to COPANT (1974) technical standard classifications for wood structure characteristics. This classification allowed a broader view of the wood property diversity of the sampled trees (Supplementary Material, Figure S1). Wood samples were registered and stored in the xylarium of INPA.
Data analyses
The correlations of tree size and wood anatomy variables with sapwood area were analyzed using Pearson’s correlation coefficient (r) and linear and exponential regressions to determine variable relationship and line-curve trend and to develop a practical allometric equation to estimate sapwood area in a non-destructive manner for this region and forest type (Supplementary Material, Table S2). The primary models used were an exponential power model (Y = aXb) and an exponential decay model (Y = ae(-bX)), where Y is sapwood area, a is the normalization constant, X is one of the biometrical or wood anatomy variables and b is an allometric scale exponent) (Wullscheleger et al. 2001; Meinzer et al. 2005; Gebauer et al. 2008). Model selection was based on the coefficient of determination (R2), F-values and P-values (α = 0.05, 0.01 and 0.001) obtained from each model fit. Statistical analyses were performed with R version 2.6.2 (R Development Core Team 2008) and SYSTAT 12 (SYSTAT Software, Inc.; Richmond, CA).
RESULTS
Sapwood area description
Sapwood area varied between 32 and 951 cm², and the ratio between sapwood area and cross-section varied between 10% and 100% (Supplementary Material, Table S1; Figure S1). Sapwood area depth varied substantially between the measured radii along the cross-section of most trees. Longest and shortest radii differed in up to 37% in some trees. Consequently, the diameter estimated by five radii resulted in only nine trees with ± 1% difference from the diameters estimated by two radii measurements (Supplementary Material, Table S2). The most extreme differences between 5-radii and 2-radii estimates were 88% (12% underestimated) and 108% (8% overestimated), whith an average of 99 ± 12% (DR_Avg% in Supplementary Material, Table S1). When considering only one of the radii to estimate DBH, our estimate differences ranged from 67%
and 147% (DR% in Supplementary Material, Table S2). Consequently, cross-sections with highly variable radii lengths resulted in drastically different sapwood area estimates when considering randomly only one radius. For example, sapwood area was 49% smaller when using the shortest radius of Vantanea micrantha (Figure 1b; Supplementary Material, Table S2), with an overall average of 34 ± 11% smaller than the reference radius.
Wood anatomy analyses showed interspecific differences in the presence of visible heartwood in the sapwood area (65% with complete or partial visibility), exudates (26% had some type of exudate), tyloses (50% had partial or complete apparent vessel obstruction; Figure 2), hollow stem or disease (38%), and/or sapwood area that did not reach the heartwood
Figure 2. Macroscopic view of diffuse vessels in 10× resolution from nine tree
species. A. Cecropia sciadophylla; B. Virola calophylla; C. Protium heptaphyllum; D.
(47%) (Supplementary Material, Table S3). The only characters common to all species were diffuse porosity, which is a common feature of Amazonian tree species (Ferreira et al. 2004; Marques 2008; Moutinho 2008), and the predominant occurrence of solitary vessels (68% of samples), followed by groupings of vessel multiples of 2 (20%) (Supplementary Material, Figure S1).
Allometric relationships
DBH had a positive and strong relationship with sapwood area (R2 = 0.46, r = 0.68; P < 0.001). DBH varied widely
when above 30 cm, which led to a weaker fit (Figure 3a; Supplementary Material, Table S4). Outliers were included while performing the regression analyses to maintain a representative sample, since ~ 90% of trees in the study area are in DBH classes < 30 cm (Higuchi et al. 2012). Additionally, excluding outliers did not result in a significantly better model fit for any of the variables analyzed in this study. Total height had a slightly weaker fit when compared to DBH, due to greater variability among trees (Figure 3a-b; R² = 0.33;
r = 0.54; P < 0.001). The relationship of tree volume with
Figure 3. Non-linear relationships between sapwood area and tree size and wood anatomy variables. Only significant (P < 0.05) curves represented. A. Diameter
at breast height (DBH, cm); B. Total height (Ht; m); C. Volume estimated from DBH and Ht (Vol, m3); D. Vessel diameter (µm); E. Vessel element length (µm); F. Vessel
sapwood area was only slightly stronger than using only DBH as a predictive variable (R² = 0.48, r = 0.70; P < 0.001).
Vessel-lumen diameter did not vary widely among the sampled tree species. Although average vessel diameter of all trees ranged between 59 and 238 µm, 51% of the trees had diameters of 100 - 200 µm (Figure 3d; Supplementary Material, Figure S1), with an average of 127.6 ± 49.2 µm (see Supplementary Material, Table S1 for individual tree averages). Vessel-lumen diameter had the worst fit among the variables tested and, thus, had no influence on sapwood area variation (R2 = 0.001; r = 0.03). Similarly to diameter, vessel frequency also varied little among trees. A third (34%) of the trees had few vessels per mm² (Figure 3f; Supplementary Material, Figure S1b), and there was no correlation between vessel frequency and sapwood area (R2 = 0.01; r = -0.10). Within-tree average vessel frequency varied between 2.5 and 29.2 vessels per mm², with an overall average of 9.1 ± 6.5 vessels per mm² (see Supplementary Material, Table S1 for individual tree averages). Contrary to all other variables, vessel frequency decreased with sapwood area increase (Figure 3f; Supplementary Material, Table S1). Average vessel element length varied between 148 and 1177 µm, with an average of 555 ± 202 µm. Most vessel element lengths (54%) were shorter than 300 µm (Supplementary Material, Figure S1). Unexpectedly, vessel element length had the strongest relationship with sapwood area (R² = 0.65, r = 0.69; P < 0.001) (Figure 3e; Supplementary Material, Table S1).
DISCUSSION
Tree size
Our results showed that vessel element length was the strongest predictor of sapwood area among the tested variables, followed by volume and DBH. Of the three variables, DBH is the easiest to measure, and, hence, more practical to estimate sapwood area. Even though DBH was not as strongly correlated to sapwood area as expected, other studies have considered DBH as the best variable for sapwood area estimation (Gebauer et al.
2008; Moore et al. 2010; Horna et al. 2011). The assumption of a strong relationship between DBH and sapwood area is based on the hypothesis that water consumption increases with tree size (Meinzer et al. 2005). To allocate the necessary amount of carbon for biomass production (e.g., increase in trunk, branch and leaf biomass), trees need to maximize their water absorption through the increase of their sapwood area (Gebauer et al. 2008).
The weaker than expected model fit of the relationship between sapwood area and DBH may have been due to a wide range of intrinsic differences within each tree. For example, species belonging to different successional stages transpire at different rates and, consequently, alter the size of their sapwood area according to their water use (Horna et al. 2011; Kunert et al. 2017). Other studies in tropical regions
found that heliophylle (or pioneer) trees (i.e., plants with rapid growth under high light intensities) transpire more than co-existing late successional trees, specially closer to the forest edge (Horna et al. 2011; Kunert et al. 2015; Kunert
et al. 2017). To compensate water loss, pioneer species may require a larger sapwood area in order to transport larger volumes of water. For instance, one of our sampled species,
Cecropia sciadophylla, is a common pioneer tree in Amazonian forests, and its sapwood area occupied > 80% of the cross-section in all three sampled specimens. In contrast, in Ocotea neesiana, a late successional tree (Paula et al. 2004), sapwood area occupied only 30% of the cross-section, which suggests that inherent successional stage might be one of the factors that influence the size of the active xylem area and, possibly, other physiological adaptations, such as leaf shedding.
The weaker relationship between total height and sapwood area, when compared to DBH, may be attributed to vertical tree growth dynamics not being related to horizontal tree growth (in diameter), or to the ability of generating new vessels in its cross-section (Brodersen and McElrone 2013). Although a weaker predictor than DBH, total height was significantly correlated with sapwood area, which suggests that sapwood growth may be related to tree height to some extent, i.e., enabling vertical growth expansion and maintenance (Kostner et al. 2002; Gebauer et al. 2008). Even though an increase in photosynthetic activity due to greater solar exposure may lead to tree growth (Andrade et al. 1998), it does not necessarily mean that total height will increase in the same manner as sapwood area. Thus, if tall trees are not assimilating the amount of carbon required to maintain their size/biomass, they may reduce sapwood area to avoid water loss. Tall, younger trees are likely to have more exposure to solar radiation, which will increase their water use. In this way, the combination of short and tall young trees in a forest stand will result in a high variability of sapwood area and, consequently, in a weaker model fit. Taller, more exposed, trees also have a greater disadvantage during the dry season, when high vapor pressure deficits (VPD > 1 kPa) may result in significant loss of hydraulic conductivity due to cavitation and embolism (Tyree and Sperry 1989; Gebauer et al. 2008). Therefore, some trees can maintain a smaller sapwood area to avoid embolism and cavitation (Cochard and Tyree 1990; Christman et al. 2012), specially those with medium to large-sized vessels (Tyree et al. 1994).
Sapwood area
The sapwood areas determined in this study (32 − 951 cm2) were similar in range to those observed in other Neotropical lowland and montane forests, with extremes ranging between 20 and 4000 cm2 (Granier et al. 1996; Anhuf et al. 1999; Motzer et al. 2005; Parolin et al. 2008; Aparecido et al.
that certain stem anatomical traits may affect the results of allometric modeling and determination of sapwood area. For example, the fact that in 47% of our sampled trees the active xylem did not reach the inferred and visible heartwood area suggests that sapwood area can be overestimated by some methodologies, such as the determination of sapwood area solely on heartwood coloration (Granier et al. 1996; Gartner 2002; Giothiomi and Dougal 2002). Heartwood coloration may therefore not be suitable as a sapwood estimation method for most Amazonian species. Additionally, most of the trees sampled did not have a uniformly, round-shaped stem, which would also over or underestimate sapwood area based on a single core extraction.
Another possible source of sapwood area (and transpiration) overestimation was the unexpected presence of hollow stems and tyloses, which are rarely acknowledged in other ecohydrological studies (James et al. 2003). Hollow stems were found in 20% of our trees, but can affect 50-75% of trees and account for up to 83% of the stem’s cross section in other tropical sites (Bakshi 1960; Heineman et al. 2015). Other studies in the Brazilian Amazon found hollow stems in 30-40% of sampled trees (Apolinario and Martius 2004; Eleuterio 2011). Hollow stem incidence is higher in larger trees (DBH > 50 cm) (Heineman et al. 2015), which may explain why hollow trees were relatively less frequent in our sample than in the aforementioned studies. Hollow stems can lead to 7% less biomass in a forest stand, affecting carbon stock quantification (Heineman et al. 2015). Hence, without proper sapwood determination methods, there is increased uncertainty as to what degree factors such as heart rot or termite and ant colonies have affected the heartwood. Since hollow trunks are not exclusive to a certain tree species or age, and are typically associated with tree size, habitat and soil conditions (Heineman et al. 2015), it is only possible to non-destructively predict whether a certain tree cross-section is whole by employing specialized equipment, such as laser scanners, x-rays or electromagnetic resonance (Nikolova et al. 2009; Bieker and Rust 2010). However, these methods are expensive, laborious and practically inviable to use in the tropics (due to humidity, and the number and size of samples needed). Increment borers may provide a less laborious and little-invasive alternative to assess trunk hollowness, yet, as previously mentioned, non-uniformity of tree stems may lead to errors if only one core is extracted.
Tyloses have been reported to occur in some specific tree families, such as Lecythidaceae (Moutinho 2008) and Salicaceae (Mota et al. 2017). Considering that half the trees from this study presented some type of vessel obstruction, we can assume that tyloses are a major contributor to sapwood area deactivation or partial obstruction of water and nutrient pathways in the active xylem of Amazonian trees (Bamber 1975; Kitin et al. 2010). These deactivated portions may not be homogeneous and can occur in any portion of the stem, as
is the case of heartwood wounds that develop after cambium injuries (Bamber 1975). This can result in significant errors in hydrological measurements, such as sap flux, when probes are inserted in partially deactivated sapwood (Clearwater et al.
1999; McDowell et al. 2002; Gebauer et al. 2008).
Wood anatomy
Our results indicated clearly that the anatomical characters analyzed were not responsible for sapwood area growth or deactivation. Unlike sapwood area, the number and tangential dimensions of vessels are not altered due to seasonal variations or ecological traits (Sterck et al. 2008). These variables can be altered only through certain genetic mutations or as an adaptation to local microclimates at different altitudes and/or latitudes (Fisher et al. 2007). Since our samples were collected in a small area on a flat terrain, the occurrence of genetic or geographical variation is unlikely. Likewise, Noshiro and Baas (2000) concluded that insufficient distance between forest stands explained the lack of significant variation in vessel diameter and frequency in relation to DBH and sapwood area between stands.
The surprisingly strong relationship observed between vessel element length and sapwood area may be attributed to the local microclimate (Baas 1982). Through paleoecology, Baas (1982) associated smaller vessel element length to accentuated seasonality of the local climate (e.g., elevated precipitation rates or rigorous drought periods). Considering that the Amazon region does not have a strong dry season, and temperatures and precipitation are predominantly constant over the years, we can assume that interspecific variation in vessel element lengths is due to different water use strategies and the effect of microclimatic variation within a forest stand, such as the occurrence of forest gaps (Kunert et al. 2015), which may also directly affect sapwood area size (Copenhaver and Tinker 2014). Although being an evolutionary insightful parameter, vessel element length is extremely difficult to measure, for it requires tree harvesting and laborious and expensive laboratory analyses, which makes it unpractical as a variable to estimate sapwood area.
CONCLUSIONS
tree size, ecological succession and location inside the stand (canopy exposure). Our results suggest that sapwood area allometry may not be constant in Amazonian forests, but vary with tree diameter, species autoecology and stand dynamics. Future studies aiming at sapwood area estimation in the Amazon should take into account these aspects when sampling highly heterogeneous stands. Our findings also can improve sapwood area determination through non-destructive multi-point sampling, especially when dealing with non-uniform tree stems. Differential adaptability to microclimates will affect water use rates of trees, and consequently their sapwood area size. Our study provides useful insights for future studies on Amazonian tree water use and carbon stock estimation.
ACKNOWLEDGMENTS
We would like to thank CAPES (Coordenação de Aperfeicoamento de Pessoal de Nível Superior) for financing the first author’s master’s degree, CNPq (Conselho Nacional de Desenvolvimento Científico e Tecnológico) for their program INCT- Madeiras da Amazônia, that provides financial support for the Forest Management Laboratory and ZF-2 Reserve infra-structure, and INPA/CODAM (Instituto Nacional de Pesquisas da Amazônia/Coordenação de Dinâmica Ambiental) for their infra-structure, faculty and staff. We would also like to thank all the workers at ZF-2 Forest Management Reserve for their support in fieldwork operations. Many thanks to Jorge Freitas, Francisco José Vasconcellos (INPA Xylotheque) and Claudete Catanhede do Nascimento (INPA Laboratory of Wood Artifact Engineering) for giving access to laboratory equipment and guidance throughout the wood anatomy analyses. Finally, special thanks for the constructive feedback of anonymous reviewers and the editor for thoroughly revising this manuscript. This present manuscript is based on partial data from the first author’s master’s thesis.
REFERENCES
Amaral, I.L.; Matos, F.D.A.; Lima, J. 2000. Composição florística e parâmetros estruturais de um hectare de floresta densa de terra firme no rio Uatumã, Amazônia, Brasil. Acta Amazonica, 30: 377-392.
Andrade, J.L.; Meinzer, F.C.; Goldstein, G.; Holbrook, N.M.; Cavelier, J.; Jackson, P.; Silvera, K. 1998. Regulation of water flux through trunks, branches, and leaves in trees of a lowland tropical forest. Oecologia, 115: 463-471.
Anhuf, D.; Motzer, T.; Rollenbeck, R.T.; Schroder, B.; Szarzynski, J. 1999. Water budget of the Surumoni-crane-site (Venezuela). Selbyana, 20: 179-185.
Aparecido, L.M.T.; dos Santos, J.; Higuchi, N.; Kunert, N. 2015. Ecological applications of differences in the hydraulic efficiency of palms and broad-leaved trees. Trees, 29: 1431-1445. Aparecido, L.M.T.; Miller, G.R.; Cahill, A.T.; Moore, G.W.
2016. Comparison of tree transpiration under wet and dry
canopy conditions in a Costa Rican premontane tropical forest. Hydrological Processes, 30: 5000-5011.
Apolinario, F.E.; Martius, C. 2004. Ecological role of termites ) Insecta, Isoptera) in tree trunks in central Amazonian rain forests. Forest Ecology and Management, 194: 23-28.
Baas, P. 1982. Systematic, phylogenetic, and ecological wood anatomy—history and perspectives. In: P, Baas. (Ed.), New perspectives in wood anatomy. Forestry Sciences. Springer Science & Business Media, Dordrecht, p.23-58.
Bakshi, B.K. 1960. Heart rot of Sal in India. Phytopathological News, 6: 45-46.
Bamber, R.K. 1975. Heartwood, its function and formation. Wood Science and Technology, 10: 1-8.
Bieker, D.; Rust, S. 2010. Non-destructive estimation of sapwood and heartwood width in Scots Pine. Silva Fenica, 44: 267-273. Brodersen, C.R.; McElrone, A.J. 2013. Maintenance of xylem
Network Transport Capacity: A Review of Embolism Repair in Vascular Plants. Frontiers in Plant Science, 4: 1-11.
Carlquist, S. 1988. Comparative wood anatomy: Systematic, ecological, and evolutionary aspects of dicotyledon wood. Wood Science. 1st. ed. Springer Verlag, Berlin, 448p.
Čermák, J.; Kučera, J.; Nadezhdina, N. 2004. Sap flow measurements with some thermodynamic methods, flow integration within trees and scaling up from sample trees to entire forest stands. Trees, 18: 529-546.
Cermak, J.; Nadezhdina, N. 1998. Sapwood as the scaling parameter: defining according to xylem water content or radial pattern of sap flow? Annals of Forest Science, 55: 509-521.
Chavarro-Rincon, D. 2009. Tree transpiration mapping from upscaled sap flow in the Botswana Kalahari. Doctoral thesis, University of Twente, Netherlands, 159p.
Christman, M.A.; Sperry, J.; Smith, D.D. 2012. Rare pits, large vessels and extreme vulnerability to cavitation in ring-porous tree species. New Phytologist, 193: 713-720.
Clearwater, M.J.; Meinzer, F.C.; Andrade, J.L.; Goldstein, G.; Holbrook, N.M. 1999. Potential errors in measurement of nonuniform sap flow using heat dissipation probes. Tree Physiology, 19: 681-687.
Cochard, H.; Tyree, M.T. 1990. Xylem dysfunction in Quercus: vessel sizes, tyloses, cavitation and seasonal changes in embolism. Tree Physiology, 6: 393-407.
COPANT. 1974. Descripción de características generales, macroscópicas de las maderas angiospermas dicotiledoneas. Comissión Panamericana de Normas Técnicas, COPANT. Copenhaver, P.E.; Tinker, D.B. 2014. Stand density and age affect
tree-level structural and functional characteristics of young, postfire lodgepole pine in Yellowstone National Park. Forest Ecology and Management, 320: 138-148.
Dietz, J.; Leuschner, C.; Holscher, D.; Kreilein, H. 2007. Vertical patterns and duration of surface wetness in an old-growth tropical montane fores, Indonesia. Flora, 202: 111-117. Eleuterio, A.A. 2011. Wood decay in living trees in Estern Amazonia,
Enquist, B.J. 2002. Universal scaling in tree and vascular plant alometry: toward a general quantitative theory linking plant form and function from cells to ecosystems. Tree Physiology, 22: 1045-1064.
Fauset, S.; Johnson, M.O.; Gloor, M.; Baker, T.R.; Monteagudo, A.; Brienen, R.J.W. et al. 2015. Hyperdominance in Amazonian forest carbon cycling. Nature Communications, 6: 1-9.
Fernandes, N.P.; Jardim, F.C.S.; Higuchi, N. 1983. Tabelas de volume para a floresta de terra-firme da estação experimental de silvicultura tropical. Acta Amazonica, 13: 537-545.
Ferreira, G.C.; Gomes, J.I.; Hopkins, M.J.G. 2004. Estudo anatômico das espécies de Leguminosae comercializadas no estado do Pará como “Angelim”. Acta Amazonica, 34: 1-15. Fisher, J.B.; Goldstein, G.; Jones, T.J.; Cordell, S. 2007. Wood vessel
diameter is related to elevation and genotype in the Hawaiian tree Metrosideros polymorpha (Myrtaceae). American Journal of Botany, 94: 709-715.
Franklin, G.L. 1945. Preparation of thin sections of synthetic resins and wood resin composites and a new macerating method for wood. Nature, 155: 51.
Gartner, B.L. 2002. Sapwood and inner bark quantities in relation to leaf area and wood density in Douglas-Fir. IAWA, 23: 267-285. Gebauer, T.; Horna, V.; Leuschner, C. 2008. Variability in radial
sap flux density patterns and sapwood area among seven co-occurring temperate broad-leaved tree species. Tree Physiology, 28: 1821-1830.
Giothiomi, J.K.; Dougal, E. 2002. Analysis of heartwood –sapwood demarcation methods and variation of sapwood and heartwood within and between 15 year old plantation grown Eucalyptus regnans. International Journal of Applied Science and Technology, 2: 63-70.
Granier, A.; Anfodillo, T.; Sabatti, M.; Cochard, T.; Dreyer, E.; Tomasi, M.; et al. 1994. Axial and radial water flow in the trunks of oak trees: a quantitative and qualitative analysis. Tree Physiology, 14: 1383-1396.
Granier, A.; Huc, R.; Barigah, S.T. 1996. Transpiration of natural rain forest and its dependence on climatic factors. Agricultural and Forest Meteorology, 78: 19-29.
Heineman, K.D.; Russo, S.E.; Baillie, I.C.; Mamit, J.D.; Chai, P.P.-K.; Chai, L.; et al. 2015. Evaluation of stem rot in 339 Bornean tree species: implications of size, taxonomy, and soil-related variation for aboveground biomass estimates. Biogeosciences, 12: 5735-5751.
Higuchi, F.G.; Siqueira, J.D.P.; Lima, A.J.N.; Figueiredo Filho, A.; Higuchi, N. 2012. Influencia do tamanho da parcela na precisao da funcao de distribuicao diametrica de Weibull na floresta primaria da Amazonia Central. Floresta, 42: 599-606. Horna, V.; Schuldt, B.; Brix, S.; Leuschner, C. 2011. Environment
and tree size controlling stem sap flux in a perhumid tropical forest of Central Sulawesi, Indonesia. Annals of Forest Science, 68: 1027–1038.
James, S.A.; Frederick, C.M.; Goldstein, G.; Woodruff, D.; Jones, T.; Restom, T.; et al. 2003. Axial and radial water transport and internal water storage in tropical forest canopy trees. Oecologia, 134: 37-45.
Johansen, D.A. 1940. Plant microtechnique. 1st.ed. McGraw-Hill, New York, 523p.
Kammesheidt, L. 2000. Some autecological characteristics of successional and climax tree species in Venezuela. Acta Oecologica, 21: 37-48.
Kitin, P.; Voelker, S.L.; Meinzer, F.C.; Beeckman, H.; Strauss, S.H.; Lachenbruch, B. 2010. Tyloses and phenolic deposits in xylem vessels impede water transport in low-lignin transgenic poplars: a study by cryo-fluorescence microscopy. Plant Physiology, 154: 878-898.
Kostner, B.; Falge, E.; Tenhunen, J.D. 2002. Age-related effects on leaf area/sapwood area relationships, canopy transpiration and carbon gain of Norway spruce stands (Picea abies) in the Fichtelgebirge, Germany. Tree Physiology, 22: 567-574. Kunert, N.; Aparecido, L.M.T.; Higuchi, N.; Santos, J.; Trumbore,
S. 2015. Higher tree transpiration due to road-associated edge effects in a tropical moist lowland forest. Agricultural and Forest Meteorology, 213: 183-192.
Kunert, N.; Aparecido, L.M.T.; Wolff, S.; Higuchi, N.; Santos, J.; Araujo, A.C.; Trumbore, S. 2017. A revised hydrological model for the Central Amazon: the importance of emergent canopy trees in the forest water budget. Agricultual and Forest Meteorology, 239: 47-57.
Machado, J.L.; Tyree, M.T. 1994. Patterns of hydraulic architecture and water relations of two tropical canopy trees with contrasting leaf phenologies: Ochroma pyramidale and Pseudobombax septenatum. Tree Physiology, 14: 219-240.
Machado, S.A.; Figueiredo Filho, A. 2006. Dendrometria. 2nd.ed. Unicentro, Guarapuava, Brazil, 316p.
Marques, M.H.B. 2008. Agrupamento de 41 espécies de madeiras da Amazônia para secagem baseado em características anatômicas e físicas. Doctoral thesis, Universidade de Brasilia, Brazil, 141p. McDowell, N.; Barnard, H.; Bond, B.; Hinckley, T.; Hubbard, R.;
Ishii, H.; et al. 2002. The relationship between tree height and leaf area: sapwood area ratio. Oecologia, 132: 12-20.
Meinzer, F.C.; Bond, B.J.; Warren, J.M.; Woodruff, D.R. 2005. Does water transport scale universally with tree size? Functional Ecology, 19: 558-565.
Meinzer, F.C.; Goldstein, G.; Andrade, J.L. 2001. Regulation of water flux through tropical forest canopy trees: Do universal rules apply? Tree Physiology, 21: 19-26.
Meinzer, F.C.; James, S.A.; Goldstein, G. 2004. Dynamics of transpiration, sap flow and use of stored water in tropical forest canopy trees. Tree Physiology, 24: 901-909.
Moore, G.W.; Bond, B.J.; Jones, J.A.; Meinzer, F.C. 2010. Thermal-dissipation sap flow sensors may not yield consistent sap-flux estimates over multiple years. Trees, 24: 165-174.
Moore, G.W.; Orozco, G.; Aparecido, L.M.T.; Miller, G.R. 2017. Upscaling transpiration in diverse forests: insights from a tropical premontane site. Ecohydrology, 11: 1-13.
Mota, G.S.; Melo, L.E.L.; Ribeiro, A.O.; Pereira, H.; Mori, F.A. 2017. Ecologic features of Wood anatomy of Casearia sylvestris SW (Salicaceae) in three Brazilian ecosystems. Cerne, 23: 445-453. Motzer, T.; Munz, N.; Kuppers, M.; Schmitt, D.; Anhuf, D. 2005.
montane rain forest trees in the southern Ecuadorian Andes. Tree Physiology, 25: 1283-1293.
Moutinho, V.H.P. 2008. Caracterização das madeiras conhecidas na Amazônia brasileira como matá-matá. Master’s dissertation. Universidade Federal de Lavras, Brazil, 88p.
Nikolova, P.S.; Blaschke, H.; Matyssek, R.; Pretzsch, H.; Seifert, T. 2009. Combined application of computer tomography and light microscopy for analysis of conductive xylem area in coarse roots of European beech and Norway spruce. European Journal of Forest Research, 128: 145-153.
Noshiro, S.; Baas, P. 2000. Latitudinal trends in wood anatomy within species and genera: case study in Cornus S. L. (Cornaceae). American Journal of Botany, 87: 1495-1506. Nutto, L.; Machado, S.A.; Cavalheiro, R.; Silva, L.C.R. 2012.
Comparação de metodologias para medição de anéis de crescimento de Mimosa scabrella e Pinus taeda. Scientia Forestalis, 40: 135-144.
Parolin, P.; Muller, E.; Junk, W.J. 2008. Sapwood area in seven common tree species of central amazon floodplains. Pesquisas Botanica, 59: 277-286.
Paula, A.; Silva, A.F.; Marco, P.; Santos, F.A.M.; Souza, A.L. 2004. Sucessão ecológica da vegetação arbórea em uma Floresta Estacional Semidecidual, Viçosa, MG, Brasil. Acta Botânica Brasileira, 18: 407-423.
Schultz, H.R.; Matthews, M.A. 1997. High vapour pressure deficit exacerbates xylem cavitation and photoinhibition in shade-grown Piper auritum H.B. & K. during prolonged sunflecks : I. Dynamics of plant water relations. Oecologia, 110: 312-319.
Shuttleworth, W.J. 1988. Evaporation from Amazonian rainforest. Proceedings of the Royal Society of London, B233: 321-346. Sterck, F.J.; Szweifel, R.; Sass-Klaassen, U.; Chowdhury, Q. 2008.
Persisting soil drought reduces leaf specific conductivity in Scots pine (Pinus sylvestris) and pubescent oak (Quercus pubescens). Tree Physiology, 28: 529-536.
Stewart, C.M. 1966. Excretion and heartwood formation in living trees. Science, 153: 1068-1074.
Team, R.C. 2013. R: a language and environment for statistical computing. R Foundation for Statistical Computing, Vienna, Austria.
ter Steege, H.; Pitman, N.C.A.; Sabatier, D.; Baraloto, C.; Salomão, R.P.; Guevara, J.E.; et al. 2013. Hyperdominance in the Amazonian tree flora. Science, 342: 325-337.
Tyree, M.T.; Sperry, J.S. 1989. Vulnerability of xylem to cavitation and embolism. Annual Review of Plant Physiology and Molecular Biology, 40: 19-38.
Wullscheleger, S.D.; Gunderson, C.A.; Hanson, P.J.; Wilson, K.B.; Norby, R.J. 2001. Sensitivity of stomatal and canopy conductance to elevated CO2 concentration - interacting variables and perspectives of scale. New Phytologist, 153: 485-496.
RECEIVED: 13/03/2018 ACCEPTED: 23/09/2018
ASSOCIATE EDITOR: Cátia Callado
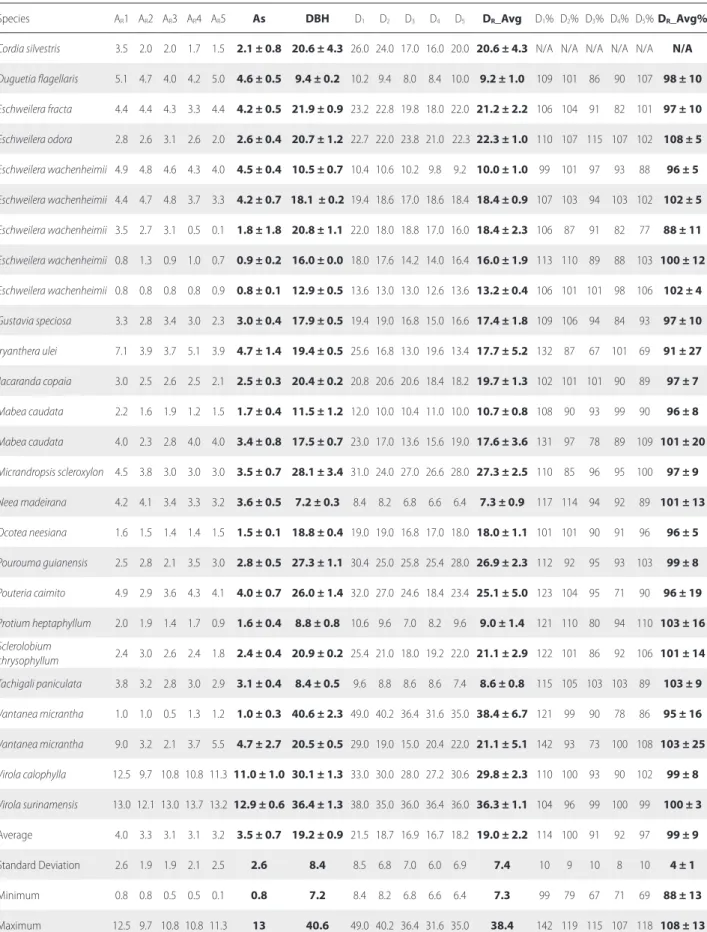
Table S1. Size and characteristics of wood anatomy of all sampled trees. Values are the mean ± standard deviation, when more than one measurement was taken.
Family/species Height
(m) DBH1 (cm)
Sapwood depth2
(cm)
Sapwood area (cm2)
Basal area (cm²)
Sapwood-to-basal area ratio
(%)
Avg vessel diameter
(μm)
Avg vessel frequency
(vessels/ mm2)
Avg vessel element length
(μm)
ANNONACEAE
Bocageopsis multiflora (Mart.) R. E. Fries 26.7 26.8 ± 1.1 2.8 ± 0.2 209.9 545.7 38.5 122.0 ± 32.9 6.6 ± 2.4 463.0 ± 107.0
Duguetia flagellaris Huber 13.0 9.4 ± 0.2 4.6 ± 0.5 66.5 66.5 100.0 75.2 ± 24.0 11.8 ± 3.1 448.4 ± 35.1 BIGNONIACEAE
Jacaranda copaia (Aubl.) D. Don 25.1 20.4 ± 0.2 2.5 ± 0.3 137.1 305.4 44.9 151.6 ± 43.6 3.3 ± 1.3 595.9 ± 382.4 BORAGINACEAE
Cordia silvestris Fresen.3 19.8 20.6 ± 4.3 2.1 ± 0.8 124.1 333.3 37.2 105.2 ± 40.1 5.1 ± 3.0 331.6 ± 74.8
BURSERACEAE
Protium heptaphyllum (Aubl.) March. 11.2 8.8 ± 0.8 1.6 ± 0.4 36.8 63.6 57.9 80.4 ± 27.2 22.0 ± 4.1 428.8 ± 109.2 EUPHORBIACEAE
Mabea caudata Pax & K. Hoffm. 16.0 11.5 ± 1.2 1.7 ± 0.4 47.5 89.6 53.0 134.4 ± 28.4 5.6 ± 2.2 701.5 ± 206.3
Mabea caudata Pax & K. Hoffm. 17.2 17.5 ± 0.7 3.4 ± 0.8 152.8 244.4 62.5 126.8 ± 38.2 4.9 ± 1.6 681.2 ± 163.6
Micrandropsis scleroxylon W. Rodr. 28.0 28.1 ± 3.4 3.5 ± 0.7 259.4 586.2 44.2 176.4 ± 51.2 5.1 ± 2.1 575.8 ± 200.5 FABACEAE - CAESALPINOIDEAE
Sclerolobium chrysophyllum Poepp. 25.1 20.9 ± 0.2 2.4 ± 0.4 143.2 350.3 40.9 212.4 ± 29.8 3.1 ± 1.5 482.1 ± 99.6
Tachigali paniculata Aubl. 14.2 8.4 ± 0.5 3.1 ± 0.4 53.9 58.1 92.7 125.6 ± 38.4 7.8 ± 3.4 381.7 ± 97.0 HUMIRIACEAE
Vantanea micrantha Ducke 21.7 20.5 ± 0.5 4.7 ± 2.7 241.9 349.0 69.3 176.4 ± 37.3 3.3 ± 1.2 759.0 ± 143.7
Vantanea micrantha Ducke 23.0 40.6 ± 2.3 1.0 ± 0.3 117.6 1160.5 10.1 136.4 ± 21.0 4.7 ± 1.4 818.0 ± 176.2 LAURACEAE
Ocotea neesiana (Miq.) Kosterm. 20.0 18.8 ± 0.4 1.5 ± 0.1 76.6 253.3 30.3 100.0 ± 30.0 17.6 ± 4.5 578.4 ± 161.3 LECYTHIDACEA
Eschweilera fracta R. Knuth 18.5 21.9 ± 0.9 4.2 ± 0.5 222.2 351.7 63.2 113.2 ± 34.2 6.9 ± 2.4 410.8 ± 119.1
Eschweilera odora (Poepp. ex O. Berg) 22.7 20.7 ± 1.2 2.6 ± 0.4 83.8 334.9 25.0 130.4 ± 42.1 5.9 ± 3.2 470.8 ± 131.5
Eschweilera wachenheimii Sandwith 12.0 10.5 ± 0.7 4.5 ± 0.4 78.4 79.2 99.0 126.0 ± 46.2 8.0 ± 2.9 432.7 ± 142.2
Eschweilera wachenheimii Sandwith 22.5 18.1 ± 0.2 4.2 ± 0.7 186.7 265.9 70.2 112.0 ± 31.4 6.9 ± 2.6 406.0 ± 86.3
Eschweilera wachenheimii Sandwith 19.0 20.8 ± 1.1 1.8 ± 1.8 91.6 259.0 35.4 129.2 ± 48.6 6.4 ± 2.4 443.1 ± 119.6
Eschweilera wachenheimii Sandwith 18.0 16.0 ± 0.0 0.9 ± 0.2 44.6 202.1 22.1 139.2 ± 33.3 5.8 ± 2.2 543.6 ± 105.9
Eschweilera wachenheimii Sandwith 18.0 12.9 ± 0.5 0.8 ± 0.1 31.8 136.0 23.4 103.2 ± 28.1 9.8 ± 4.1 395.2 ± 80.4
Gustavia speciosa (Kunth) DC. 19.0 17.9 ± 0.5 3.0 ± 0.4 133.9 236.7 56.6 66.0 ± 17.3 29.2 ± 4.6 495.2 ± 77.9 MALPIGHIACEAE
Byrsonima crispa A. Juss 16.0 15.9 ± 2.3 2.2 ± 0.6 95.8 208.2 46.0 93.6 ± 19.6 17.7 ± 4.6 857.2 ± 164.9 MORACEAE
Brosimum utile (Kunth) Pittier 27.0 26.7 ± 1.9 2.7 ± 0.8 203.0 544.1 37.3 118.0 ± 28.7 6.5 ± 2.4 452.5 ± 85.8
SUPPLEMENTARY MATERIAL (only avaliable in the electronic version)
Table S2. Sapwood data of 34 trees belonging to 26 species sampled in a terra firme forest in the central Brazilian Amazon. Sapwood area depth was estimated from each of five radii measured (ARn). Sapwood area was estimated considering all five radii estimates (AS). DBH = diameter-at-breast-height (in cm) (average of two
measures); DR = average diameter estimated for each of the five radii (in cm); DR_Avg = average diameter considering all five radii estimates (in cm); DR% = percentage
difference between DBH and each DR; DR_Avg% = total average difference between DBH and each DR. Overall average, standard deviation, minimum and maximum
values of the measurements are also presented at the end of the table. Note: *Diameter was obtained through radii measurements of a fragmented stem section. N/A represents “non available” data.
Species AR1 AR2 AR3 AR4 AR5 As DBH D1 D2 D3 D4 D5 DR_Avg D1% D2% D3% D4% D5%DR_Avg%
Bocageopsis multiflora 2.5 2.7 3.0 3.0 3.0 2.8 ± 0.2 26.8 ± 1.1 27.4 25.6 26.8 25.0 27.0 26.4 ± 1.0 102 96 100 93 101 99 ± 4
Brosimum utile 3.3 2.2 3.8 2.5 1.9 2.7 ± 0.8 26.7 ± 1.9 29.0 26.0 27.6 21.6 27.4 26.3 ± 2.8 109 98 104 81 103 99 ± 11
Byrsonima crispa 2.3 2.7 2.7 1.6 1.5 2.2 ± 0.6 15.9 ± 2.3 18.4 17.6 15.4 16.0 14.0 16.3 ± 1.8 116 111 97 101 88 102 ± 11
Caliptanthes spruceana 3.6 3.0 2.7 2.9 2.4 2.9 ± 0.4 13.9 ± 1.1 18.0 16.6 11.4 11.4 16.4 14.8 ± 3.1 129 119 82 82 118 106 ± 22
Cecropia sciadophylla 4.7 4.0 3.1 2.7 3.9 3.7 ± 0.8 12.2 ± 0.3 14.0 14.0 11.6 10.2 12.6 12.5 ± 1.6 115 115 95 84 103 102 ± 13
Cecropia sciadophylla 8.7 7.3 4.7 6.7 7.0 6.9 ± 1.4 15.1 ± 1.8 18.6 15.8 11.8 15.0 15.4 15.3 ± 2.4 123 105 78 99 102 101 ± 16
Cecropia sciadophylla 9.5 7.0 5.9 6.5 8.2 7.4 ± 1.4 17.3 ± 1.5 21.0 16.0 13.2 15.0 18.0 16.6 ± 3.0 122 93 77 87 104 96 ± 17 Chrysophyllum
ucuquirana-branca 2.0 1.5 0.6 0.8 2.0 1.4 ± 0.7 18.3 ± 1.1 19.4 19.0 17.2 17.6 17.0 18.0 ± 1.1 106 104 94 96 93 99 ± 6
Family/species Height (m) DBH1 (cm)
Sapwood depth2
(cm)
Sapwood area (cm2)
Basal area (cm²)
Sapwood-to-basal area ratio
(%)
Avg vessel diameter
(μm)
Avg vessel frequency
(vessels/ mm2)
Avg vessel element length
(μm)
MYRISTICACEAE
Iryanthera ulei Warb 23.2 19.4 ± 0.5 4.7 ± 1.4 192.7 245.5 78.5 82.0 ± 22.4 10.0 ± 2.6 765.6 ± 142.2
Virola calophylla (Spruce) Warb. 22.5 30.1 ± 1.3 11.0 ± 1.0 648.8 695.6 93.3 87.2 ± 28.5 12.3 ± 4.6 1020.7 ± 198.6
Virola surinamensis (Rol. Ex. Rottb.) Warb 28.5 36.4 ± 1.3 12.9 ± 0.6 950.7 1040.6 91.4 110.4 ± 28.9 6.9 ± 2.6 1176.6 ± 220.8 MYRTACEAE
Caliptanthes spruceana Berg. 21.0 13.9 ± 1.1 2.9 ± 0.4 108.6 171.1 63.5 76.4 ± 19.3 18.5 ± 5.6 479.8 ± 132.8 NYCTAGINACEAE
Neea madeirana Standl. 11.3 7.2 ± 0.3 3.6 ± 0.5 41.6 41.6 100.0 58.8 ± 19.2 12.0 ± 3.8 147.7 ± 37.8 SAPOTACEAE
Chrysophyllum ucuquirana-branca
(Aubrev & Pellegr) T. D. Penn. 20.1 18.3 ± 1.1 1.4 ± 0.7 72.2 255.6 28.3 86.0 ± 19.2 15.1 ± 4.3 636.9 ± 173.0
Pouteria caimito Radlk. 22.6 26.0 ± 1.4 4.0 ± 0.8 262.8 494.0 53.2 79.6 ± 14.9 19.9 ± 4.7 622.8 ± 156.4 URTICACEAE
Cecropia sciadophylla Mart. 15.5 12.2 ± 0.3 3.7 ± 0.8 101.7 122.3 83.2 238.0 ± 44.2 2.5 ± 0.8 441.5 ± 85.8
Cecropia sciadophylla Mart. 17.6 15.1 ± 1.8 6.9 ± 1.4 182.4 184.3 99.0 210.4 ± 37.8 3.2 ± 1.3 500.4 ± 118.1
Cecropia sciadophylla Mart. 16.5 17.3 ± 1.5 7.4 ± 1.4 214.9 217.5 98.8 232.8 ± 53.5 3.1 ± 1.0 448.0 ± 79.6
Pourouma guianensis Aubl. 19.0 27.3 ± 1.1 2.8 ± 0.5 210.8 569.2 37.0 224.0 ± 29.6 2.6 ± 1.2 485.5 ± 111.6
Overall average 19.6 19.2 3.5 171.4 325.3 58.4 127.6 9.1 554.8
Overall standard deviation 4.7 8.4 2.6 177.6 258.5 27.0 49.2 6.5 201.9
Overall minimum 11.2 7.2 0.8 31.8 41.6 10.1 58.8 2.5 147.7
Overall maximum 28.5 40.6 13.0 950.7 1160.5 100.0 238 29.2 1176.6
1Diameter-at-breast-height obtained from the measures of the smallest and largest diameter; 2Based on measurement of five radii; 3DBH was obtained through radii measurements of a fragmented stem section.
Table S2. Continued.
Species AR1 AR2 AR3 AR4 AR5 As DBH D1 D2 D3 D4 D5 DR_Avg D1% D2% D3% D4% D5%DR_Avg%
Cordia silvestris 3.5 2.0 2.0 1.7 1.5 2.1 ± 0.8 20.6 ± 4.3 26.0 24.0 17.0 16.0 20.0 20.6 ± 4.3 N/A N/A N/A N/A N/A N/A
Duguetia flagellaris 5.1 4.7 4.0 4.2 5.0 4.6 ± 0.5 9.4 ± 0.2 10.2 9.4 8.0 8.4 10.0 9.2 ± 1.0 109 101 86 90 107 98 ± 10
Eschweilera fracta 4.4 4.4 4.3 3.3 4.4 4.2 ± 0.5 21.9 ± 0.9 23.2 22.8 19.8 18.0 22.0 21.2 ± 2.2 106 104 91 82 101 97 ± 10
Eschweilera odora 2.8 2.6 3.1 2.6 2.0 2.6 ± 0.4 20.7 ± 1.2 22.7 22.0 23.8 21.0 22.3 22.3 ± 1.0 110 107 115 107 102 108 ± 5
Eschweilera wachenheimii 4.9 4.8 4.6 4.3 4.0 4.5 ± 0.4 10.5 ± 0.7 10.4 10.6 10.2 9.8 9.2 10.0 ± 1.0 99 101 97 93 88 96 ± 5
Eschweilera wachenheimii 4.4 4.7 4.8 3.7 3.3 4.2 ± 0.7 18.1 ± 0.2 19.4 18.6 17.0 18.6 18.4 18.4 ± 0.9 107 103 94 103 102 102 ± 5
Eschweilera wachenheimii 3.5 2.7 3.1 0.5 0.1 1.8 ± 1.8 20.8 ± 1.1 22.0 18.0 18.8 17.0 16.0 18.4 ± 2.3 106 87 91 82 77 88 ± 11
Eschweilera wachenheimii 0.8 1.3 0.9 1.0 0.7 0.9 ± 0.2 16.0 ± 0.0 18.0 17.6 14.2 14.0 16.4 16.0 ± 1.9 113 110 89 88 103 100 ± 12
Eschweilera wachenheimii 0.8 0.8 0.8 0.8 0.9 0.8 ± 0.1 12.9 ± 0.5 13.6 13.0 13.0 12.6 13.6 13.2 ± 0.4 106 101 101 98 106 102 ± 4
Gustavia speciosa 3.3 2.8 3.4 3.0 2.3 3.0 ± 0.4 17.9 ± 0.5 19.4 19.0 16.8 15.0 16.6 17.4 ± 1.8 109 106 94 84 93 97 ± 10
Iryanthera ulei 7.1 3.9 3.7 5.1 3.9 4.7 ± 1.4 19.4 ± 0.5 25.6 16.8 13.0 19.6 13.4 17.7 ± 5.2 132 87 67 101 69 91 ± 27
Jacaranda copaia 3.0 2.5 2.6 2.5 2.1 2.5 ± 0.3 20.4 ± 0.2 20.8 20.6 20.6 18.4 18.2 19.7 ± 1.3 102 101 101 90 89 97 ± 7
Mabea caudata 2.2 1.6 1.9 1.2 1.5 1.7 ± 0.4 11.5 ± 1.2 12.0 10.0 10.4 11.0 10.0 10.7 ± 0.8 108 90 93 99 90 96 ± 8
Mabea caudata 4.0 2.3 2.8 4.0 4.0 3.4 ± 0.8 17.5 ± 0.7 23.0 17.0 13.6 15.6 19.0 17.6 ± 3.6 131 97 78 89 109 101 ± 20
Micrandropsis scleroxylon 4.5 3.8 3.0 3.0 3.0 3.5 ± 0.7 28.1 ± 3.4 31.0 24.0 27.0 26.6 28.0 27.3 ± 2.5 110 85 96 95 100 97 ± 9
Neea madeirana 4.2 4.1 3.4 3.3 3.2 3.6 ± 0.5 7.2 ± 0.3 8.4 8.2 6.8 6.6 6.4 7.3 ± 0.9 117 114 94 92 89 101 ± 13
Ocotea neesiana 1.6 1.5 1.4 1.4 1.5 1.5 ± 0.1 18.8 ± 0.4 19.0 19.0 16.8 17.0 18.0 18.0 ± 1.1 101 101 90 91 96 96 ± 5
Pourouma guianensis 2.5 2.8 2.1 3.5 3.0 2.8 ± 0.5 27.3 ± 1.1 30.4 25.0 25.8 25.4 28.0 26.9 ± 2.3 112 92 95 93 103 99 ± 8
Pouteria caimito 4.9 2.9 3.6 4.3 4.1 4.0 ± 0.7 26.0 ± 1.4 32.0 27.0 24.6 18.4 23.4 25.1 ± 5.0 123 104 95 71 90 96 ± 19
Protium heptaphyllum 2.0 1.9 1.4 1.7 0.9 1.6 ± 0.4 8.8 ± 0.8 10.6 9.6 7.0 8.2 9.6 9.0 ± 1.4 121 110 80 94 110 103 ± 16 Sclerolobium
chrysophyllum 2.4 3.0 2.6 2.4 1.8 2.4 ± 0.4 20.9 ± 0.2 25.4 21.0 18.0 19.2 22.0 21.1 ± 2.9 122 101 86 92 106 101 ± 14 Tachigali paniculata 3.8 3.2 2.8 3.0 2.9 3.1 ± 0.4 8.4 ± 0.5 9.6 8.8 8.6 8.6 7.4 8.6 ± 0.8 115 105 103 103 89 103 ± 9
Vantanea micrantha 1.0 1.0 0.5 1.3 1.2 1.0 ± 0.3 40.6 ± 2.3 49.0 40.2 36.4 31.6 35.0 38.4 ± 6.7 121 99 90 78 86 95 ± 16
Vantanea micrantha 9.0 3.2 2.1 3.7 5.5 4.7 ± 2.7 20.5 ± 0.5 29.0 19.0 15.0 20.4 22.0 21.1 ± 5.1 142 93 73 100 108 103 ± 25
Virola calophylla 12.5 9.7 10.8 10.8 11.3 11.0 ± 1.0 30.1 ± 1.3 33.0 30.0 28.0 27.2 30.6 29.8 ± 2.3 110 100 93 90 102 99 ± 8
Virola surinamensis 13.0 12.1 13.0 13.7 13.2 12.9 ± 0.6 36.4 ± 1.3 38.0 35.0 36.0 36.4 36.0 36.3 ± 1.1 104 96 99 100 99 100 ± 3
Average 4.0 3.3 3.1 3.1 3.2 3.5 ± 0.7 19.2 ± 0.9 21.5 18.7 16.9 16.7 18.2 19.0 ± 2.2 114 100 91 92 97 99 ± 9
Standard Deviation 2.6 1.9 1.9 2.1 2.5 2.6 8.4 8.5 6.8 7.0 6.0 6.9 7.4 10 9 10 8 10 4 ± 1
Minimum 0.8 0.8 0.5 0.5 0.1 0.8 7.2 8.4 8.2 6.8 6.6 6.4 7.3 99 79 67 71 69 88 ± 13
Table S3. Descriptors of the physical characteristics observed on each sampled tree log cross-section surface (n = 34). For heartwood visibility: V = completely visible, P = partially visible.
Species Vessel type Heartwoodvisibility Exudate Tylose Hollow stem Sapwood reaches heartwood
Bocageopsis multiflora (Mart.) R. E. Fries Diffuse V Sap - - X
Brosimum utile (Kunth) Pittier Diffuse V Resin - -
-Byrsonima crispa A. Juss Diffuse P - - X
-Caliptanthes spruceana Berg. Diffuse - - X -
-Cecropia sciadophylla Mart. Diffuse - - - - X
Cecropia sciadophylla Mart. Diffuse - - - X X
Cecropia sciadophylla Mart. Diffuse - - - X X
Chrysophyllum ucuquirana-branca (Aubrev & Pellegr) T. D. Penn. Diffuse V Latex - -
-Cordia silvestris Fresen. Diffuse P - X -
-Duguetia flagellaris Huber Diffuse V - - - X
Eschweilera fracta R. Knuth Diffuse V - X X1
-Eschweilera odora (Poepp. ex O. Berg) Diffuse V - X X
-Eschweilera wachenheimii Sandwith Diffuse V - X X X
Eschweilera wachenheimii Sandwith Diffuse V Resin X X X
Eschweilera wachenheimii Sandwith Diffuse V - X X
-Eschweilera wachenheimii Sandwith Diffuse V - - X
-Eschweilera wachenheimii Sandwith Diffuse V - X -
-Gustavia speciosa (Kunth) DC. Diffuse P - - -
-Iryanthera ulei Warb Diffuse - Resin X - X
Jacaranda copaia (Aubl.) D. Don Diffuse V - X - X
Mabea caudata Pax & K. Hoffm. Diffuse - - X -
-Mabea caudata Pax & K. Hoffm. Diffuse V - X -
-Micrandropsis scleroxylon W. Rodr. Diffuse V Latex X -
-Neea madeirana Standl. Diffuse - - - -
-Ocotea neesiana (Miq.) Kosterm. Diffuse V - - X X
Pourouma guianensis Aubl. Diffuse P Latex - - X
Pouteria caimito Radlk. Diffuse - - X -
-Protium heptaphyllum (Aubl.) March. Diffuse P - - - X
Sclerolobium chrysophyllum Poepp. Diffuse V Latex - - X
Tachigali paniculata Aubl. Diffuse - - - X X
Vantanea micrantha Ducke Diffuse V - X X X
Vantanea micrantha Ducke Diffuse P - X -
-Virola calophylla (Spruce) Warb. Diffuse - - - - X
Total trait occurrences (n) 34 22 9 17 13 18
% occurrences 100 65 26 50 38 53
1Diseased.
Table S4. Descriptive statistical parameters of exponential power model fits using sapwood area and tree size [diameter-at-breast-height (DBH), total height (Ht)],
volume (estimated using DBH and Ht), and anatomical variables (vessel diameter, element length and frequency). Significance is set at 5%. * P<0.05; ** P<0.01; ***
P<0.001; ns = non-significant. a and b = model coefficients (Y=aXb); R2 = coefficient of determination; r = Pearson correlation coefficient; † = fitted with an exponential decay model (Y=a∙e(-bx)). Note: only the best allometric model fits are shown.
Variables a b R² r F
DBH 0.823 1.781 0.46*** 0.68 27.32
Total height 0.013 3.110 0.33*** 0.58 16.08
Volume (DBH, Ht) 376.95 0.817 0.48*** 0.70 29.96
DBC 0.188 2.307 0.71*** 0.84 39.52
Vessel diameter 11.848 0.499 0.001ns 0.03 0.02
Vessel element length 0.000007 2.628 0.65*** 0.80 58.63
Figure S1. Microscopic wood proprieties classified according to their vessel dimensions as proposed by Copant (1974) and the percentage of trees included in each category. A. Vessel-lumen diameter (µm); B. vessel frequency (vessels per mm2); C. vessel element length (µm); D. vessel groupings (solitary or multiples). This figure


![Table S4. Descriptive statistical parameters of exponential power model fits using sapwood area and tree size [diameter-at-breast-height (DBH), total height (Ht)], volume (estimated using DBH and Ht), and anatomical variables (vessel diameter, element len](https://thumb-eu.123doks.com/thumbv2/123dok_br/16000264.691412/14.892.90.803.958.1105/descriptive-statistical-parameters-exponential-diameter-estimated-anatomical-variables.webp)

