cop
yr
ight
© ABE&M todos os dir
eitos r
eser
v
ados
original
CASSIANO RICARDO RECH
BRAIAN ALVES CORDEIRO
EDIO LUIZ PETROSKI
FRANCISCO A. G. VASCONCELOS
Faculdade of Physical Education, Universidade Estadual de Ponta Grossa (UEPG), Ponta Grossa, PR, Brazil (CRR); Faculdade of Nutrition, Universidade do Vale do Itajaí (Univali), Itajaí, SC, Brazil (BAC); Graduate Program in Physical Education, Universidade Federal de Santa Catarina (UFSC), Florianópolis, SC, Brazil (ELP); Graduate Program in Nutrition, UFSC, Florianópolis, SC, Brazil (FAVG).
Recebido em 10/3/2008 Aceito em 25/8/2008 ABSTRACT
Aging involves both nutritional and physiological changes, reducing fat-free mass (FFM) and increasing body fat, both of which are associated with physical weakness, unfitness and morbidity among the elderly. This study was under-taken to analyze the cross-validity of bioelectrical impedance equations for the prediction of fat-free mass (FFM) in elderly Brazilians. A cross-sectional popu-lation-based study, was performed in Florianópolis, Santa Catarina, Brazil, 2006. The study sample comprised 60 men and 120 women, aged 60 to 81. The dual energy X-ray absorptiometry (DEXA) served as gold standard. Predicted %BF and FFM were obtained from various anthropometric equations and bio-electric impedance. The cross-validation criteria suggested by Lohman and Bland-Altman plots of differences against the mean were used. The body mass index of the sample ranged from 18.4 to 39.3 kg/m2. Mean percent body fat was 23.1 ± 5.8% in men and 37.3 ± 6.9% in women (range: 6 to 51.4%). In men, the equations of Kyle et al. (2001), Dey et al. (2003) and Sun et al. (2003) did not differ significantly from the DEXA measurement, with a constant error (CE) of 0.7 to 2.5 kg. In contrast, among women only the equations of Kyle et al. (2001) and Dey et al. (2003) were found to be valid (CE: 0.3 to 2.7 kg). The bioelectrical impedance equations validated in this study can be used in the Brazilian el-derly population. (Arq Bras Endocrinol Metab 2008; 52/7:1163-1171)
Keywords: Body composition; Elderly; Electric impedance; Bone density; Anthropometry
RESUMO
Predição da Massa Livre de Gordura por Meio da Impedância Bioelétrica para Idosos Brasileiros.
O envelhecimento causa modificações fisiológicas e nutricionais, entre elas, a redução da massa livre de gordura (MLG) e o aumento da gordura corporal, ambas associadas com fraqueza, inaptidão e morbidez de idosos. O estudo teve como objetivo analisar a validade cruzada de equações de impe dância bioelétrica (IB) para a estimativa da massa MLG em idosos brasileiros. Estudo transversal de base populacional, conduzido em Floria nópolis, estado de Santa Catarina, Brasil, 2006. Foram avaliados 60 homens e 120 mulheres com idade entre 60 e 81 anos. A absortometria radiológica de dupla energia foi usada como padrão-ouro para a validação cruzada. A MLG foi estimada por impedância bioelétrica e antropometria. Os procedimentos de validação cru-zada de Lohman e a plotagem de Bland e Altman foram utilizados. O ín dice de massa corporal da amostra variou entre 18,4 kg/m2 e 39,3 kg/m2. O percen-tual médio de gordura foi de 23,1% (desvio-padrão, DP = 5,8) nos homens e 37,3% (DP = 6,9) nas mulheres. As equações de Kyle e cols., Dey médio e Sun e cols. atenderam os critérios de validação para os homens; erro constante entre –0,7 kg e 2,5 kg), e para mulheres, as equações de Kyle e cols. e Dey e cols. (EC entre 0,3 kg e 2,7 kg). As equações de IB validadas no presente estudo podem ser utilizadas para a estimativa da MLG de idosos brasileiros.
(Arq Bras Endocrinol Metab 2008; 52/7:1163-1171)
cop
yr
ight
© ABE&M todos os dir
eitos r
eser
v
ados
INTRODUCTION
C
hanges in body composition during the aging process result from decreases in total body water, bone mass and muscle mass (1),accompanied by an increase in body adiposity (2).Due to these altera-tions, the quantification of body weight often does not reflect changes in fat mass and fat-free mass (FFM) (3), with these two components being of great impor-tance, since they are directly related to the maintenan-ce of the independenmaintenan-ce of elderly individuals and to an increased risk of nontransmissible chronic diseases such as diabetes (4),cardiovascular disease (5)and some types of cancer (6).However, the assessment of body composition components in the elderly is still a matter of discussion among specialists, since body changes that occur as a result of aging are difficult to measure due to the scar-city of adequate methods. In this respect, the validity of noninvasive low cost methods of good applicability have been tested since they represent a suitable alterna-tive for the assessment of body composition in this group of people (7).Among these methods, bioelectri-cal impedance (BI) analysis has been widely used for the study of body composition due to its noninvasive-ness and relatively low cost and because it requires little collaboration from the patient (2). In addition to body components, some of these methods can also be used to estimate the distribution of body fluids in intra- and extracellular spaces (8).
One of the main factors associated with changes in the level of hydration in humans has been attributed to the process of aging, i.e., the reduction of FFM and body water that occurs with age (9). Thus, BI methods validated for the prediction of FFM in young individu-als have been found to be inadequate when used in el-derly populations (10,11).
In this respect, some regression equations based on the measurement of resistance (R) and reactance (Xc) combined with anthropometric measures have been pro-posed for the estimation of FFM in specific elderly groups, or in more encompassing samples of the population, but only few methods have been tested in Brazilian samples.
OBJECTIVE
The purpose of the present study is to evaluate the pre-dictive power of BI equations for the estimation of
FFM in Brazilian elderly subjects, using dual energy X-ray absorptiometry (DEXA) as the reference method.
METHODS
Subjects
The sample consisted of 180 healthy elderly subjects (60 men and 120 women) ranging in age from 60 to 81 years, all of them living in the municipality of Floria-nópolis, State of Santa Catarina, Southern Brazil. The subjects were selected by invitation among participants of four elderly leisure groups. These groups were selec-ted among people living close to the places where the measurements were carried out, thus avoiding major discomfort for the subjects.
A total of 266 elderly subjects (115 men and 151 women) were contacted by telephone and interviewed. 86 subjects (57 men and 29 women) did not fulfill the criteria for inclusion in the sample since they presented symptoms of high blood pressure, had some type of cancer, amputation and pacemaker, were younger than 60 years, were taking diuretics, had a fixed prosthesis or were not interested in participating in the study. Du-ring the telephone contact, the subjects also responded to a questionnaire regarding demographic data and the dates for the anthropometric, BI and DEXA measure-ments were also scheduled.
An interesting socioeconomic demographic cha-racteristic was that 60% (n = 108) of the subjects were between 60 and 70 years of age, characterizing the sample as a young elderly population. Regarding mari-tal status, 88.3% (n = 53) of men and 65% (n = 78) of women were married. The educational level was consi-dered to be above national standards. In the present study, 42.8% of the elderly subjects had completed mi-ddle school or completed high school, and 57.2% com-pleted elementary school (until 8th grade). Most elderly
subjects (84.3%) performed some type of physical acti-vity (more than twice a week). Men were found to be less active than women (p < 0.05, χ2 = 2.35). The main
activities reported by subjects practicing physical exer-cise were walking, localized gymnastics, working out, water gymnastics and dancing.
cop
yr
ight
© ABE&M todos os dir
eitos r
eser
v
ados
Anthropometric measurements
Body weight and height were measured according to international standards (12). Three measurements were obtained and the mean was considered for analysis. Body mass index (BMI) was calculated as the weight in kilograms divided by the square of the height in me-ters. A model Arja scale with a capacity of 150 kg and a wall mounted stadiometer with a precision of 0.1 cm were used for the measurements.
Bioelectrical impedance
BI variables were analyzed using a tetrapolar body-composition analyzer (model BF, Biodynamics Body Composition, Seattle, Washington, USA). Four elec-trodes were placed on the dorsal surface of the right hand, wrist, foot and ankle. During the measurement, the subjects remained lying in the supine position on a nonconducting surface (wooden table). During BI a painless current of low intensity (800 µA) is emitted at a frequency of 50 kHz following the path from the source electrode to the detector electrode. The electro-des were placed on the anatomical points suggested by Heyward and Stolarczyk (7)and Lukaski et al.(13).
R and Xc provided by the analyzer at the emitted electrical current were used for the estimation of FFM. The subjects were asked to obey the following proce-dures before the BI measurements as described by Heyward and Stolarczyk (7): not to eat or drink anything during the 4 hours before the evaluation, not to perform any physical exercise during the 12 hours preceding the test, to urinate at least 30 minutes before the evaluation, not to consume alcohol during the 48 hours preceding the test, and not to take any diuretics during the 7 days prior to the test. The anthropometric and BI measurements were obtained in the fasting state
in the morning at the Laboratory of Kinanthropome-try, Universidade Federal de Santa Catarina.
The R and Xc values were used in regression equa-tions along with anthropometric measures for the esti-mation of FFM, which was compared to the criterion measure (DEXA). Table 1 shows the BI equations for elderly subjects analyzed in the present study.
DEXA
The criterion measure of FFM was determined by who-le-body scanning with a Lunar Prodigy DF + 14319 radiation densitometer (Madison, WI, USA) using the DPX-L software version 7.52.002 for quantification.
Measurements were performed with the subject bare-foot lying in the supine position on a table and wearing only an apron and no earrings, rings, dentures or other type of metal material. The subject was asked not to move and a whole-body scan was performed which lasted on average of 20 to 30 minutes. The densitometer was cali-brated daily according to manufacturer recommendations. Scans were carried out by a medical radiology technician at Centro de Diagnóstico por Imagens (SONITEC), Flo-rianópolis, Santa Catarina, in the afternoon on the same day as the anthropometric and BI measurements.
Statistical analysis
Descriptive statistics was used for the characterization of anthropometric and BI variables: frequency and percent distribution, calculation of central trend (mean), and dispersal (standard deviation). The criteria suggested by Lohman (17)were adopted for cross-validation of the BI equations. The paired t-test was used for comparison
between estimated means (equations) and those measu-red by DEXA. The following procedures were also used for analysis of estimated and measured values: Pearson’s
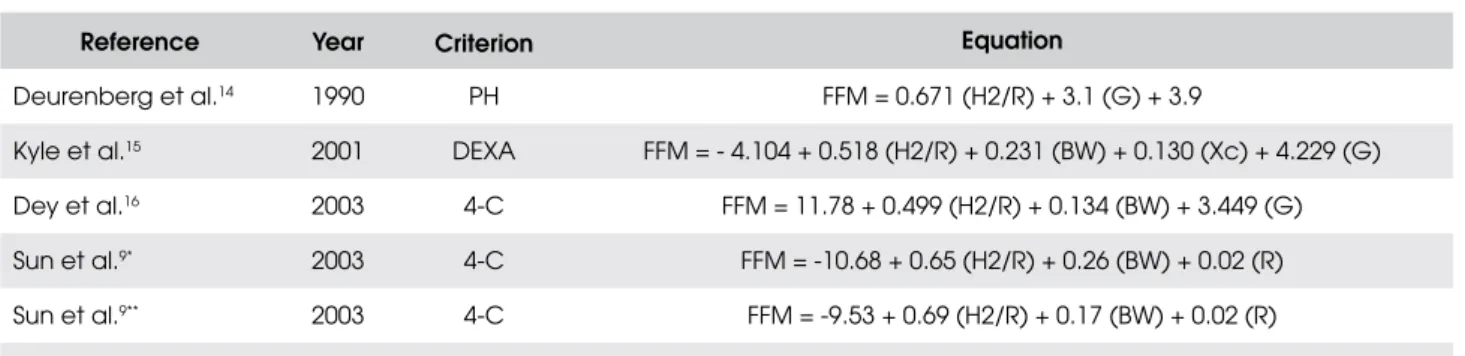
Table 1. Bioelectrical impedance equations for elderly subjects analyzed in the present study.
Reference Year Criterion Equation
Deurenberg et al.14 1990 PH FFM = 0.671 (H2/R) + 3.1 (G) + 3.9
Kyle et al.15 2001 DEXA FFM = - 4.104 + 0.518 (H2/R) + 0.231 (BW) + 0.130 (Xc) + 4.229 (G)
Dey et al.16 2003 4-C FFM = 11.78 + 0.499 (H2/R) + 0.134 (BW) + 3.449 (G)
Sun et al.9* 2003 4-C FFM = -10.68 + 0.65 (H2/R) + 0.26 (BW) + 0.02 (R)
Sun et al.9** 2003 4-C FFM = -9.53 + 0.69 (H2/R) + 0.17 (BW) + 0.02 (R)
cop
yr
ight
© ABE&M todos os dir
eitos r
eser
v
ados
linear correlation coefficient (r) and analysis of standard deviations, constant error (CE) which corresponds to the difference between estimated and measured values, total error (TE) which corresponds to the variation in values as a function of the number of subjects analyzed, and standard error of the estimate (SEE) which corres-ponds to the error expected for the equation analyzed compared to the criterion measure (DEXA).
Finally, Bland and Altman analysis (18) was used to determine the dispersal of residual scores as a func-tion of the estimated and measured means. Cross-va-lidation of the equations was performed according to gender and BMI classification (< 25 kg/m2, 25 to 30
kg/m2 and > 30 kg/m2) using the World Health
Or-ganization classification for nutritional assessment (19). The BI equations were considered to be valid when they fulfilled the criteria cited above, i.e., when they did not present significantly different means, r > 0.79, and CE, TE and SEE for FFM less than 3.5 kg for men and 2.8 kg for women. The Statistical Packa-ge for Social Science (SPSS) program version 10.0 was used for analysis of the data.
RESULTS
The sample consisted of 180 elderly subjects ranging in age from 60 to 81 years, including 66.7% (n = 120) women and 33.3% (n = 60) men. The mean (± stan-dard deviation, SD) age was 69.1 ± 5.6 years for men and 67.2 ± 5.1 years for women.
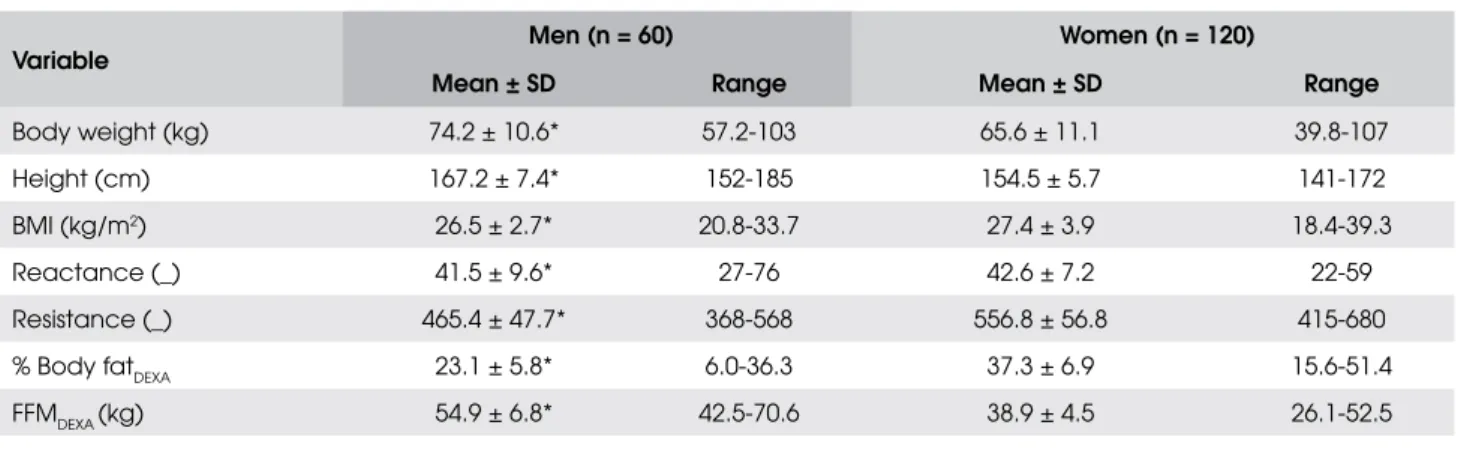
The physical characteristics of the group of elder-ly subjects evaluated in the present study are shown
in Table 2. As can be seen in the table, the body com-position variables measured by DEXA, anthropome-try and BI differed between genders (p < 0.05), thus confirming the need for specific equations for each gender. Percent body fat ranged from 6 to 36.3% in men and from 15.6 to 51.4% in women, being signi-ficantly higher in women compared to men (p < 0.05). In contrast, FFM evaluated by DEXA was sig-nificantly higher in men (54.9 ± 6.8 kg) than in wo-men (38.9 ± 4.5 kg).
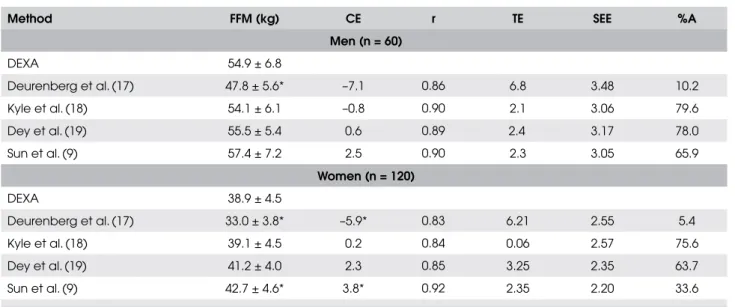
Table 3 shows the mean FFM and standard devia-tion obtained with the different methods tested in the present study, as well as the results of the cross-valida-tion according to the criteria suggested by Lohman (17). In men, only FFM estimated by the equation of Deurenberg et al. (14) differed significantly from the DEXA measure (p < 0.05). In elderly women, the equation of Deurenberg et al. (14) significantly unde-restimated FFM by 5.9 kg, whereas the equation of Sun et al. (9) significantly overestimated FFM by 3.8 kg. For all equations the correlations were found to be significant and above the values recommended by Loh-man (17) for the process of cross-validation. However, the marked correlations agreement in the validation li-mits (3.5 kg for men and 2.8 kg for women) between equations was less than 80%. The best agreement was observed for the equation of Kyle et al. (15) in both men (79.6%) and women (75.6%).
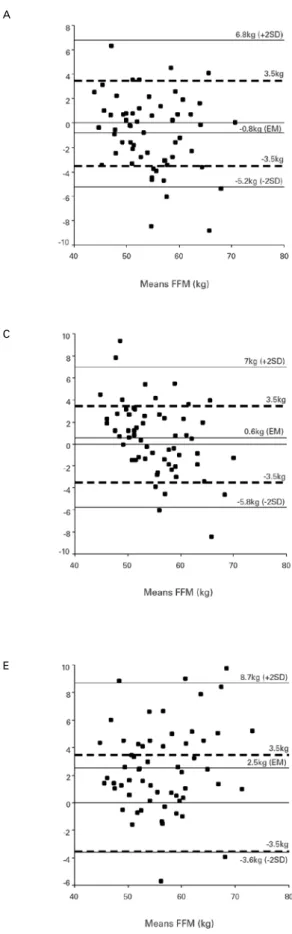
The dispersal graphs illustrate the mean errors and confidence intervals for each equation, which did not differ significantly from the criterion measu-re (Figumeasu-re 1).
Table 2. Body composition variables obtained for elderly subjects from the municipality of Florianópolis, Santa Catarina (2006).
Variable
Men (n = 60) Women (n = 120)
Mean ± SD Range Mean ± SD Range
Body weight (kg) 74.2 ± 10.6* 57.2-103 65.6 ± 11.1 39.8-107
Height (cm) 167.2 ± 7.4* 152-185 154.5 ± 5.7 141-172
BMI (kg/m2) 26.5 ± 2.7* 20.8-33.7 27.4 ± 3.9 18.4-39.3
Reactance (_) 41.5 ± 9.6* 27-76 42.6 ± 7.2 22-59
Resistance (_) 465.4 ± 47.7* 368-568 556.8 ± 56.8 415-680
% Body fatDEXA 23.1 ± 5.8* 6.0-36.3 37.3 ± 6.9 15.6-51.4
FFMDEXA (kg) 54.9 ± 6.8* 42.5-70.6 38.9 ± 4.5 26.1-52.5
BMI = body mass index; FFM = fat-free mass; DEXA = dual energy X-ray absorptiometry; SD = standard desviation; * Significant difference between genders (p < 0.05,
cop
yr
ight
© ABE&M todos os dir
eitos r
eser
v
ados
Table 3. Cross-validation of the bioelectrical impedance equations for the estimation of fat-free mass in elderly subjects from the municipality of Florianópolis, Santa Catarina (2006).
Method FFM (kg) CE r TE SEE %A
Men (n = 60)
DEXA 54.9 ± 6.8
Deurenberg et al. (17) 47.8 ± 5.6* –7.1 0.86 6.8 3.48 10.2
Kyle et al. (18) 54.1 ± 6.1 –0.8 0.90 2.1 3.06 79.6
Dey et al. (19) 55.5 ± 5.4 0.6 0.89 2.4 3.17 78.0
Sun et al. (9) 57.4 ± 7.2 2.5 0.90 2.3 3.05 65.9
Women (n = 120)
DEXA 38.9 ± 4.5
Deurenberg et al. (17) 33.0 ± 3.8* –5.9* 0.83 6.21 2.55 5.4
Kyle et al. (18) 39.1 ± 4.5 0.2 0.84 0.06 2.57 75.6
Dey et al. (19) 41.2 ± 4.0 2.3 0.85 3.25 2.35 63.7
Sun et al. (9) 42.7 ± 4.6* 3.8* 0.92 2.35 2.20 33.6
DEXA = dual energy X-ray absorptiometry; FFM = fat-free mass (reported as mean ± standard deviation, SD); CE = constant error; TE = total error; SEE = standard error of
the estimate; %A = percent agreement with the validation limit (± 3.5 kg for men and 2.8 kg for women); * Significantly different (p < 0.05, paired t-test).
DISCUSSION
The elderly population has grown significantly in deve-loping countries such as Brazil (20), a fact requiring simple accessible methods for the assessment of body composition in this population. The purpose of the present study is to compare FFM measured by DEXA and estimated by BI equations in a sample of Brazilian elderly subjects.
The present results indicate significant differences in body composition variables between elderly men and women (Table 2). This findings demonstrate that equations for the assessment of body composition in the elderly need to be gender specific, since this parti-cular group is highly heterogenous in terms of gender. Women presented a lower body weight and height than men of the same age, whereas BMI was signifi-cantly higher in women (p < 0.05). These results agree with Goodman-Gruen and Barret-Connor (21) who demonstrated differences in body composition varia-bles between genders, which became more marked with age.
With respect to the criteria used for the cross-vali-dation of the equations, Lohman (17)recommended for a technique to be valid to a correlation coefficient higher than 0.80, compared to the criterion measure and a low SEE. In the present study, the correlation coefficient was adequate and the criterion measure and
standard error were also low, i.e., less than 2.5 kg in men and 2.8 kg in women.
The use of field methods such as BI analysis for the assessment of body composition is attractive, since it requires little collaboration from the patient and redu-ces interobserver errors compared to the measurement of skinfold thickness.
cop
yr
ight
© ABE&M todos os dir
eitos r
eser
v
ados
Figure 1. Dispersal graphs and mean error between the dual-energy X-ray absorptiometry (DEXA) method and the equation of Kyle et al. (18) for the estimation of fat-free mass (FFM) in elderly men (A) and elderly women (B), between the DEXA method and the equation of Dey et al. (19) for the estimation of fat-free mass (FFM) in elderly men (C) and elderly women (D), and between the DEXA method and the equation of Sun et al. (9) for the estimation of FFM in elderly men (E).
A
C
E
B
cop
yr
ight
© ABE&M todos os dir
eitos r
eser
v
ados
that might result in marked errors when assessing body composition in the elderly.
The other three equations analyzed were develo-ped using DEXA and 4-component model estimates as a criterion measure, which take into account aging-as-sociated changes in FFM (24) and bone mineral densi-ty (23). The mean FFM estimated by the equation of
Kyle et al. (18) did not differ significantly from the cri-terion measure (p > 0.05) in either men or women, with an underestimation of FFM of 0.8 kg in men and an overestimation of 0.2 kg in women. The SEE, stan-dard deviation and TE are considered to valid for the estimation of FFM in the elderly (17). Figure 1 shows the error values and 95% confidence intervals of the error variations obtained with the equation of Kyle et al. (15) Application of this equation to the elderly po-pulation showed a higher variation in men compared to women, a finding that might be explained by the grea-ter loss of FFM in men with increasing age (8).
With respect to the equation of Dey e cols. (16), we observed a slight overestimation of FFM by 0.6 kg in men and by 2.3 kg in women, and a high correlation coefficient in men (r = 0.89) and women (r = 0.85). Agreement between methods ranged from 63.7 to 78%, i.e., a large part of the elderly subjects studied presented acceptable errors when using the validation criteria suggested by Lohman (17), demonstrating that this equation presents cross-validity in Brazilian elderly subjects. This was confirmed by the analysis of residual scores (Figure 1).
Another equation found to be valid for the estima-tion of FFM in men was that developed by Sun et al. (9),with a CE of 2.5 kg and 65.9% agreement in sam-ple scores. However, this equation presented a signifi-cant difference in women (3.8 kg). Despite a high correlation (r = 0.90), agreement between the two me-thods was low (33.6%).
Analysis of the validation criteria showed that nei-ther the equation of Dey et al. (16) nor the equation of Sun et al. (9)was influenced by BMI categories. In men, the errors did not increase along with increasing overweight in neither equation. In women, this ten-dency was only observed for the equation of Sun et al. (9),which underestimated FFM in elderly subjects with a BMI < 25 kg/m2, and overestimated this parameter in
those with a BMI > 30 kg/m2. Gray et al. (25)
repor-ted that excess adiposity may result in errors in the esti-mation of FFM from bioelectrical impedance, mainly due to changes in the hydration of body components.
According to Baumgartner et al. (26), this variation may also be related to anisotropic components (intra-cellular fluids, air spaces and the orientation of the elec-trodes itself which impairs the passage of the electrical current in trunk muscles, whose muscle fibers possess different orientations).
The ratio between the square of the height and resistance has proved to be an excellent predictor of FFM (27), Kyle et al. (18)reported a correlation of r = 0.93 and SEE of 2.8 kg. These data are similar to tho-se reported by Sun et al. (9) who obtained values of r
= 0.79 and SEE of 2.6 to 3.8 kg when including the square of the height and body weight in the regression model. In the present study, coefficients of determina-tion for this variable were high in men (R2 = 0.74) and
women (R2 = 0.68).
Other studies have also validated BI equations in groups of elderly subjects. Lupoli et al. (28)observed that the equation developed by Deurenberg et al. (14) underestimated FFM by 5.2 kg in men and by 6 kg in women with a BMI less than 20 kg/m2.
Dey and Bosaeus (2) also found that the BI equa-tion of Deurenberg et al. (14) underestimated FFM by 7.9 kg in men and by 9 kg in women. In contrast, the equation of Kyle et al. (15) underestimated FFM by 2.6 kg in men and by 4.2 kg in women when compared to FFM predicted with a 4-component model in a sample from the Nordic Research on Ageing Study. Fregonasse (29) reported the validity of the BI equations developed by Lohman (14) and of specific equations developed for different body fat levels (< 30% and > 30%) by Segal et al. (30) ,in a group of 95 postmenopausal elderly wo-men. The results demonstrated that the equation of Lo-hman (17) significantly overestimated FFM by 0.63 kg, while the equation of Segal et al. (30) was found to be valid for the estimation of FFM in the cited sample.
cop
yr
ight
© ABE&M todos os dir
eitos r
eser
v
ados
The use of a criterion measure (DEXA) compared to regression equations, that estimate FFM using other criterion measures (e.g., hydrostatic weighing), may re-sult in additional errors due to differences in the techni-ques used and their measurement principle. Another limitation is related to the technique for the establish-ment of the criterion measure (DEXA), in which sub-jects with body dimensions above 190 × 60 centimeters remain outside the limit estimated by the equipment. Thus, subjects with these characteristics were excluded.
Considering the limitations of the present study, we conclude that the generalized BI equation develo-ped by Kyle et al. (15) and the specific equation deve-loped by Dey et al. (16) are valid for the prediction of FFM in elderly men and women, for all BMI categories analyzed. The generalized BI equation developed by Sun et al. (9) is valid for the prediction of FFM in elder-ly men, irrespective of BMI classification. In contrast, the BI equation of Deurenberg et al. (14) showed no cross-validity for the prediction of FFM in Brazilian el-derly subjects.
CONCLUSIONS
BI was found to be a valid and precise method for the prediction of FFM in elderly subjects, suggesting its use in follow-up studies in order to reduce the interobser-ver errors of the equipment. Howeinterobser-ver, criteria need to be established before BI analysis so that the results will not be significantly influenced by other factors.
Acknowledgments. The authors wish to thank the elderly sub-jects who took part in this study and the SONITEC Laboratory for help with the measurements. Conflict of interest: No other potencial conflict of interest relevant to this article was reported.
REFERENCES
Steen B. Body composition and aging. Nutr Res. 1988;46(2): 1.
45-51.
Dey DK, Bosaeus I. Comparison of bioelectrical impedance 2.
prediction equations for fat-free mass in a population-based sample of 75 y olds: the Nora study. Nutrition. 2003;19(10): 858-64.
Lee S, Kuk JL, Davidson LE, Hudson R, Kilpatrick K, Graham 3.
TE, et al. Exercise without weight loss is an effective strategy for obesity reduction in obese individuals whit and without type 2 diabetes. J Appl Physiol. 2005;99(3):1220-5.
Smith SR, Ravussin E. Emerging paradigms for understanding 4.
fatness and diabetes risk. Curr Diab Rep. 2002;2(3):223-30. Rashid MN, Fuentes F, Touchon RC, Wehner PS. Obesity and the 5.
risk for cardiovascular disease. Prev Cardiol. 2003;6(1):42-7.
Calle EE, Rodriguez C, Walker-Thurmond K, Thun MJ. Overwei-6.
ght, obesity, and mortality from cancer in a prospectively stu-died cohort of U.S. adults. N Engl J Med. 2003;348(17): 1625-38.
Heyward VH, Stolarczyk LM. Avaliação da composição corpo-7.
ral aplicada. São Paulo: Manole; 2002.
Kyle UG, Genton L, Hans D, Karsegard L, Slosman DO, Pi-8.
chard C. Age-related differences in fat-free mass, skeletal muscle, body cell mass and fat mass between 18 and 94 ye-ars. Eur J Clin Nutr. 2001;55(8):663-72.
Sun SS, Chumlea WC, Heymsfield SB, et al. Development 9.
of bioelectrical impedance analysis prediction equations for body composition with use of a multicomponent model for use in epidemiologic surveys. Am J Clin Nutr. 2003;77(2):331-40.
Rodrigues Barbosa A, Santarém JM, Jacob Filho W, Souza 10.
Meirelles E, Nunes Marucci MF. Comparação da gordura cor-poral de mulheres idosas segundo antropometria, bioimpe-dância e DEXA [Comparison of body fat using anthropometry, bioelectrical impedance and DEXA in elderly women]. Arch Latinoam Nutr. 2001;51(1):49-56.
Haapala I, Hivornen A, Niskanen L, et al. Anthropometry, bio-11.
electrical impedance and dual-energy X-ray absorptiometry in the assessment of body composition in elderly Finnish wo-men. Clin Physiol Funct Imaging. 2002;22(6):383-91.
Gordon CC, Chumlea WC, Roche AF. Stature, recumbent 12.
length, weight. In: Lohman TG, Roche AF, Martorell R, edi-tors. Anthropometric standardizing reference manual. Cham-paign, Illinois: Human Kinetics Books; 1991. p. 3-8.
Lukaski HC, Bolonchuk WW, Hall CB, Siders WA. Validation of 13.
tetrapolar bioelectrical impedance method to assess human body composition. J Appl Physiol. 1986;60(4):1327-32. Deurenberg, P, van der Kooij K, Evers P, Hulshof T. Assess-14.
ment of body composition by bioelectrical impedance in a population aged greater 60 y. Am J Clin Nutr. 1990;51(1):3-6. Kyle UG, Genton L, Karsegard L, Slosman DD, Pichard C. Sin-15.
gle prediction equation for bioelectrical impedance analysis in adults aged 20-94 years. Nutrition. 2001;17(3):248-53. Dey DK, Bosaeus I, Lissner L, Steen B. Body composition es-16.
timated by bioelectrical impedance in the Swedish elderly. Development of population-based prediction equation and reference values of fat-free mass and body fat for 70- and 75-y olds. Eur J Clin Nutr. 2003;57(9):909-16.
Lohman TG. Advances in body composition assessment. 17.
Champaign, Illinois: Human Kinetics Publishers; 1992. Bland JM, Altman DG. Statistical methods for assessing 18.
agreement between two methods of clinical measurements. Lancet. 1986;1(8476):307-10.
World Health Organization. Obesity: preventing and mana-19.
ging the global epidemic. Report of a WHO consultation in Geneva, 3-5 Jun 1997. Geneva, Switz: World Health Organiza-tion; 1998.
Instituto Brasileiro de Geografia e Estatística (IBGE) (2005). 20.
Síntese dos indicadores sociais 2004: estudos e pesquisas, informação demográfica e socioeconômica. [Available from URL: http://www.ibge.gov.br/home/estatistica/]. Accessed in 2005 (May 23).
Goodman-Gruen D, Barret-Connor E. Sex differences in mea-21.
sures of body distribution in the elderly. Am J Epidemiol. 1996;143(9):898-906.
Goran MI, Toth MJ, Poehlman ET. Cross-validation of anthro-22.
4-compart-cop
yr
ight
© ABE&M todos os dir
eitos r
eser
v
ados
ment model as a criterion method. J Am Geriatr Soc. 1997;45(7):837-43.
Mazess RB, Barden HS, Bisek JP, Hanson J. Dual-energy x-ray 23.
absorptiometry for total-body and regional bone-mineral and soft-tissue composition. Am J Clin Nutr. 1990;51(6):1106-12. Wang Z, Deurenberg P, Wang W, Pietrobelli A, Baumgartner 24.
RN, Heymsfield SB. Hydration of fat-free body mass: new physiological modeling approach. Am J Physiol. 1999;276(6 Pt 1):E995-1003.
Gray DS, Bray GA, Gemayel N, Kaplan K. Effect of obesity on 25.
bioelectrical impedance. Am J Clin Nutr. 1989;50(2):255-60. Baumgartner RN, Chumlea WC, Roche AF. Estimation of body 26.
composition from bioelectric impedance of body segments. Am J Clin Nutr. 1989;50(2):221-6.
Baumgartner RN, Heymsfield SB, Lichtman S, Wang J, Pier-27.
son RN. Body composition in elderly people: effect of crite-rion estimates on predictive equations. Am J Clin Nutr. 1991;53(6):1345-53.
Lupoli L, Sergi G, Coin A, et al. Body composition in un-28.
derweight elderly subjects: reliability of bioelectrical impe-dance analysis. Clin Nutr. 2004;23(6):1371-80.
Fregonasse AT. Precisão de equações de bioimpedância (BIA) 29.
em mulheres brasileiras pós-menopausa por meio de absor-tometria radiológica de dupla energia (DXA). [Thesis]. Brasí-lia: Universidade Católica de Brasília; 2001.
Segal KR, Van Loan M, Fitzgerald PI, Hodgdon JA, Van Itallie 30.
TB. Lean body mass estimation by bioelectrical impedance analysis: a four-site cross-validation study. Am J Clin Nutr. 1988;47(1):7-14.
Correspondence to: