its Regions and Federative Units, 2006-2016
Correspondence:
Rosália Garcia Neves – Rua Vitor Valpirio No. 34, apto. 304, Centro, Pelotas, RS, Brazil. CEP: 96020-250 E-mail: rosaliagarcianeves@gmail.com
Rosália Garcia Neves1 – orcid.org/0000-0001-6798-9130
Thaynã Ramos Flores1
Suele Manjourany Silva Duro2
Bruno Pereira Nunes2
Elaine Tomasi1
1Universidade Federal de Pelotas, Faculdade de Medicina, Pelotas, RS, Brasil 2Universidade Federal de Pelotas, Faculdade de Enfermagem, Pelotas, RS, Brasil
Abstract
Objective: to analyze the Family Health Strategy (FHS) coverage time trend in Brazil, its Regions and Federative Units (FUs) from 2006-2016. Methods: this was an ecological study with time series analysis of Ministry of Health Primary Care Department data; Prais-Winsten regression was used. Results: FHS coverage in Brazil in 2006 and 2016 was 45.3% and 64.0%, respectively, with an increasing trend of coverage (annual variation = 8.4%: 95%CI 7.4;9.3); all five regions showed an increasing trend in coverage, as did the majority of FUs, with the exception of Roraima, Amapá, Piauí, Rio Grande do Norte and Paraíba, which showed stability; in 2016, 14 FUs had coverage of between 75 and 100%, and 11 had coverage of between 50 and 74,9%; coverage in São Paulo and the Federal District was below 50%. Conclusion: although, overall, FHS coverage increased, 13 FUs had coverage below 75% in 2016; therefore, more efforts are needed to universalize FHS coverage.
Keywords: Family Health; Health Services Coverage; Primary Health Care; Time Series Studies.
Introduction
The Brazilian Family Health Programme (FHP), a development of the Community Health Agent Programme (CHA), arose in 1994 to modify health care and reorient the care model, with focus on health promotion and disease prevention, so as to reorganize health services according to the Brazilian Unified Health System (SUS) principles of universality, integrality and equity.1,2 The Program for Family Health
Expansion and Consolidation (PROESF) began in 2003, and in 2006 FHP was renamed Family Health Strategy (FHS). Since then, this strategy has achieved high population coverage in proving integral care to the population,3,4 as well as promoting reduced inequities
in access to health services.5
The basis of FHS actions is the territorialization of Family Health teams. It reorganizes and directs the expansion, qualification and consolidation of Primary Health Care (PHC) to health in accordance with SUS principles,6 in addition to expanding health care
problem-solving ability and recovery of the health status of individuals and groups through actions directed towards health promotion and prevention of diseases and their associated complaints.6,7
Increased FHS coverage has been associated with improvements in the population’s health status, such as the fall in infant mortality,4 greater vaccination
coverage, reduced malnutrition and increased prenatal checkups.8,9 There is also evidence that an increase in
the coverage of the strategy contributes to the reduction of hospitalizations for ambulatory care sensitive conditions and cardiovascular mortality.10-12
A verification study of possible differences between the FHS care model and the traditional model found that actions such as the promotion of breastfeeding, child care, the management of the most prevalent childhood diseases, diagnosis and treatment of certain diseases and the use of protocols for the guidance of
health professional activities were more frequent in primary health care units (PHU) that relied on the ESF model in the Brazilian Southern and Northeastern regions.3 Another similar study, conducted in these
same regions, found a higher prevalence of educational counseling for the practice of physical activity among adults and the elderly covered by PHU with FHS.13
The recognition of the role of ESF for the population’s health, especially in the poorest regions of the country,1,3,4,6,14 indicates the importance of monitoring the
coverage of this strategy in the whole country, its Regions and Federative Units (FUs). However, investigations from this perspective and statistical analysis of time trends are still scarce in the literature, even when considering the ease of access to publicly available information.
The objective of this study was to analyze coverage time trend in Brazil, its Regions and Federative Units (FUs) in 2006-2016.
Methods
This was an ecological study of the coverage indicator of the Family Health Strategy, by means of time-series analysis for the period 2006-2016.
Data from the Primary Care Information System (SIAB) and the Health Information System for Primary Care (SISAB) were used, in relation to health teams that had already deployed the e-SUS Primary Health Care strategy (e-SUS-AB). These systems are updated monthly on the electronic platform of the Primary Health Care Department of the Health Ministry’s Primary Health Care Secretariat (DAB/SAS/MS).15 The selection of the start
year of the time series evaluation (2006) was based to coincide with the change in the design of the program, when it became the Family Health Strategy.
The indicator used was FHS population coverage, calculated for Brazil, its Regions and FUs, obtained on the basis of the following calculation:
Number of FHS x 3,450
Demographic Census Population as per the Brazilian Institute of Geography and Statistics (IBGE)
Where:
3,450 = average number of people accompanied by a FHS team.16
This number (3,450) is an effective reference number, even though the normative reference for the
Increased FHS coverage has been
whole period was 3,000 people per team.17,18 Average
FHS coverage between January and December was calculated for each year from 2006 to 2016.
FHS coverage was described according to FUs, regions and the country as a whole from 2006 to 2016. Prais-Winsten regression was used for trend analysis considering serial autocorrelation19, i.e., the
dependency of a measure compared in series with its own values at earlier stages. Annual FHS coverage variation and its respective 95% confidence intervals were calculated according to the method proposed by Antunes, 19 using the following formula:
TIA = (-1+[10β])*100 Where:
β = natural logarithm resulting from Prais-Winsten regression.
A significance level of 5% was adopted. Non-significant p values (≥0.05) were interpreted as a tendency to stability (accepting the null hypothesis that FHS coverage over the years did not change). Significant P values (<0.05) resulted in classification as a tendency to growth (positive annual variation) or a decreasing trend (negative annual variation).
The ratios and differences of coverage in 2016 compared to 2006 were calculated in percentage points (p.p.). In addition, FUs coverage in 2006 and 2016, specifically, were categorized into three groups: 0-49.9%; 50-74.9%; and 75-100%.
The data were stored in csv files using Microsoft® Office Excel® 2010, They were subsequently tabulated and analyzed using Stata 12.1 (College Station, Texas, USA).
The analysis was performed exclusively based on aggregated secondary source open access data. It was therefore not characterized as a study involving human beings and was exempted from submission to a Ethics Research Committee.
Results
In Brazil as a whole, FHS coverage in 2006 and 2016 was 45.3% and 64.0%, respectively. There was an increase of 18.7 p.p. in the period, revealing a growing trend of coverage in the country: annual growth of 8.4% (95% CI 7.4;9.3) (Table 1).
All five regions of Brazil showed an increasing trend in FHS coverage. The Northern (22.7 p.p.), Southern (22.4 p.p.) and Southeast (19.8 p.p.) Regions showed
a higher increase in coverage in 2016 when compared to 2006. The majority of FUs showed an increasing trend in FHS coverage, with the exception of Roraima, Amapá, Piauí, Rio Grande do Norte and Paraíba which showed stability. The Southeast Region had the highest annual variation (11.8%). Among the FUs, standing out as having the highest variations were the Federal District (53.8%), Rondônia (18.3%), Rio de Janeiro (16.7%) and Rio Grande do Sul (16.4%) in that order (Table 1).
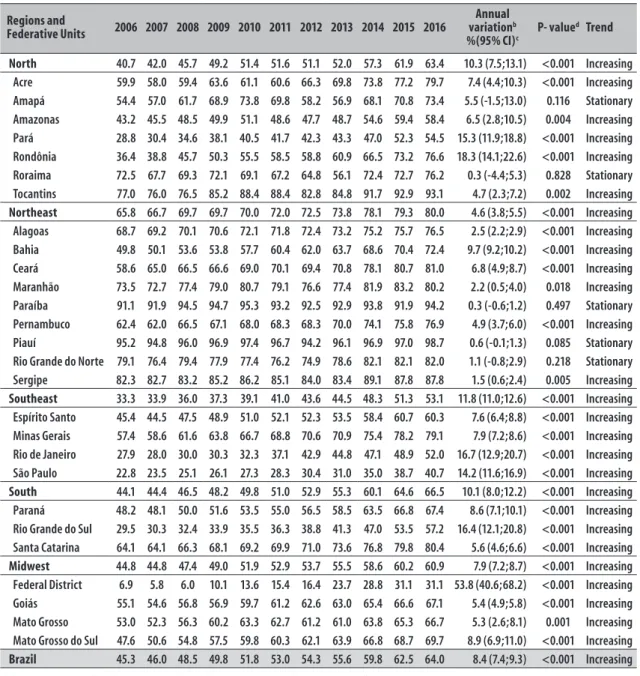
Figure 1 shows the 2016 : 2006 coverage ratios in the FUs. Rondônia, Pará, Rio de Janeiro and Rio Grande do Sul showed FHS coverage in 2016 approximately two times higher compared to 2006; the Federal District showed coverage 4.5 times greater.
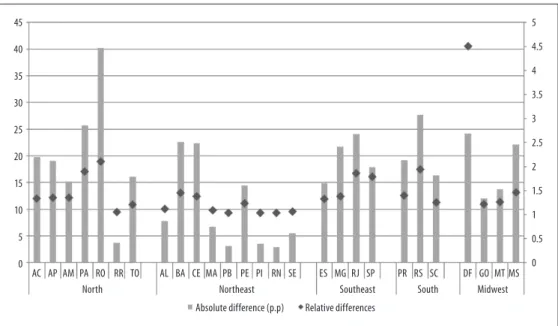
In 2006 FHS coverage was still very incipient in most parts of the country. Only Tocantins, Piauí, Rio Grande do Norte, Paraíba and Sergipe had coverage between 75 and 100%. In 2016 the scenario had changed, with only São Paulo state and the Federal District having FHS coverage below 50%; all the rest had achieved higher coverage, the majority (n=14) between 75 and 100% (Figure 2).
Discussion
The findings showed an increasing FHS coverage trend in Brazil, its macro regions and majority of its FUs. An increase in coverage of approximately 20 p.p. was found for the country as a whole; i.e., in 2006, approximately 84 million people were covered by FHS, while in 2016 approximately 125 million were covered. The regions that showed greater coverage growth were the Northern, Southeast and Southern regions, where more than half of FUs had coverage greater than or equal to 75% in 2016.
This increase in coverage of the strategy is the result of efforts led by the Brazilian Ministry of Health – whilst respecting local autonomy - for each municipality to adhere spontaneously to FHS, its expansion and consolidation. Federal initiatives and investments to improve primary care network were undertaken. Examples include the National Program for Improving Primary Health Care Access and Quality (PMAQ-AB),20
the Primary Health Care Unit Requalification Program,21
Primary Health Care Valorization Progams22 and the
Mais Médicos (More Doctors) Programme.23
Table 1 – Family Health Strategy coverage (%)a Regions, Federative Units and Brazil as a whole, 2006-2016
Regions and
Federative Units 2006 2007 2008 2009 2010 2011 2012 2013 2014 2015 2016
Annual variationb
%(95% CI)c P- value d Trend
North 40.7 42.0 45.7 49.2 51.4 51.6 51.1 52.0 57.3 61.9 63.4 10.3 (7.5;13.1) <0.001 Increasing
Acre 59.9 58.0 59.4 63.6 61.1 60.6 66.3 69.8 73.8 77.2 79.7 7.4 (4.4;10.3) <0.001 Increasing Amapá 54.4 57.0 61.7 68.9 73.8 69.8 58.2 56.9 68.1 70.8 73.4 5.5 (-1.5;13.0) 0.116 Stationary Amazonas 43.2 45.5 48.5 49.9 51.1 48.6 47.7 48.7 54.6 59.4 58.4 6.5 (2.8;10.5) 0.004 Increasing Pará 28.8 30.4 34.6 38.1 40.5 41.7 42.3 43.3 47.0 52.3 54.5 15.3 (11.9;18.8) <0.001 Increasing Rondônia 36.4 38.8 45.7 50.3 55.5 58.5 58.8 60.9 66.5 73.2 76.6 18.3 (14.1;22.6) <0.001 Increasing Roraima 72.5 67.7 69.3 72.1 69.1 67.2 64.8 56.1 72.4 72.7 76.2 0.3 (-4.4;5.3) 0.828 Stationary Tocantins 77.0 76.0 76.5 85.2 88.4 88.4 82.8 84.8 91.7 92.9 93.1 4.7 (2.3;7.2) 0.002 Increasing
Northeast 65.8 66.7 69.7 69.7 70.0 72.0 72.5 73.8 78.1 79.3 80.0 4.6 (3.8;5.5) <0.001 Increasing
Alagoas 68.7 69.2 70.1 70.6 72.1 71.8 72.4 73.2 75.2 75.7 76.5 2.5 (2.2;2.9) <0.001 Increasing Bahia 49.8 50.1 53.6 53.8 57.7 60.4 62.0 63.7 68.6 70.4 72.4 9.7 (9.2;10.2) <0.001 Increasing Ceará 58.6 65.0 66.5 66.6 69.0 70.1 69.4 70.8 78.1 80.7 81.0 6.8 (4.9;8.7) <0.001 Increasing Maranhão 73.5 72.7 77.4 79.0 80.7 79.1 76.6 77.4 81.9 83.2 80.2 2.2 (0.5;4.0) 0.018 Increasing Paraíba 91.1 91.9 94.5 94.7 95.3 93.2 92.5 92.9 93.8 91.9 94.2 0.3 (-0.6;1.2) 0.497 Stationary Pernambuco 62.4 62.0 66.5 67.1 68.0 68.3 68.3 70.0 74.1 75.8 76.9 4.9 (3.7;6.0) <0.001 Increasing Piauí 95.2 94.8 96.0 96.9 97.4 96.7 94.2 96.1 96.9 97.0 98.7 0.6 (-0.1;1.3) 0.085 Stationary Rio Grande do Norte 79.1 76.4 79.4 77.9 77.4 76.2 74.9 78.6 82.1 82.1 82.0 1.1 (-0.8;2.9) 0.218 Stationary Sergipe 82.3 82.7 83.2 85.2 86.2 85.1 84.0 83.4 89.1 87.8 87.8 1.5 (0.6;2.4) 0.005 Increasing
Southeast 33.3 33.9 36.0 37.3 39.1 41.0 43.6 44.5 48.3 51.3 53.1 11.8 (11.0;12.6) <0.001 Increasing Espírito Santo 45.4 44.5 47.5 48.9 51.0 52.1 52.3 53.5 58.4 60.7 60.3 7.6 (6.4;8.8) <0.001 Increasing Minas Gerais 57.4 58.6 61.6 63.8 66.7 68.8 70.6 70.9 75.4 78.2 79.1 7.9 (7.2;8.6) <0.001 Increasing Rio de Janeiro 27.9 28.0 30.0 30.3 32.3 37.1 42.9 44.8 47.1 48.9 52.0 16.7 (12.9;20.7) <0.001 Increasing São Paulo 22.8 23.5 25.1 26.1 27.3 28.3 30.4 31.0 35.0 38.7 40.7 14.2 (11.6;16.9) <0.001 Increasing
South 44.1 44.4 46.5 48.2 49.8 51.0 52.9 55.3 60.1 64.6 66.5 10.1 (8.0;12.2) <0.001 Increasing
Paraná 48.2 48.1 50.0 51.6 53.5 55.0 56.5 58.5 63.5 66.8 67.4 8.6 (7.1;10.1) <0.001 Increasing Rio Grande do Sul 29.5 30.3 32.4 33.9 35.5 36.3 38.8 41.3 47.0 53.5 57.2 16.4 (12.1;20.8) <0.001 Increasing Santa Catarina 64.1 64.1 66.3 68.1 69.2 69.9 71.0 73.6 76.8 79.8 80.4 5.6 (4.6;6.6) <0.001 Increasing
Midwest 44.8 44.8 47.4 49.0 51.9 52.9 53.7 55.5 58.6 60.2 60.9 7.9 (7.2;8.7) <0.001 Increasing
Federal District 6.9 5.8 6.0 10.1 13.6 15.4 16.4 23.7 28.8 31.1 31.1 53.8 (40.6;68.2) <0.001 Increasing Goiás 55.1 54.6 56.8 56.9 59.7 61.2 62.6 63.0 65.4 66.6 67.1 5.4 (4.9;5.8) <0.001 Increasing Mato Grosso 53.0 52.3 56.3 60.2 63.3 62.7 61.2 61.0 63.8 65.3 66.7 5.3 (2.6;8.1) 0.001 Increasing Mato Grosso do Sul 47.6 50.6 54.8 57.5 59.8 60.3 62.1 63.9 66.8 68.7 69.7 8.9 (6.9;11.0) <0.001 Increasing
Brazil 45.3 46.0 48.5 49.8 51.8 53.0 54.3 55.6 59.8 62.5 64.0 8.4 (7.4;9.3) <0.001 Increasing
a) The coverage percentages for each year were obtained by calculating the mean coverage between the months of January to December.
b) Annual percentage changes and their 95% CI were calculated using the following formula: TIA= (-1+[10β])*100, where β is the natural logarithm resulting from Prais-Winsten regression. c) 95%CI: 95% confidence interval.
d) P-value of the Prais-Winsten regression.
trend of growth in coverage. Roraima, Amapá, Piauí, Rio Grande do Norte and Paraíba showed stability, possibly due to fluctuations in coverage from year to year, and did not show progressive increase over the course of time. It must be emphasized that none of the FUs, regions or Brazil as a whole showed a downward trend in Family Health Strategy coverage. Piauí and Paraíba, for example, showed coverage of 90% with
45
40
35
30
25
20
15
10
5
0
5
4.5
4
3.5
3
2.5
2
1.5
1
0.5
0 AC AP AM PA RO RR TO AL BA CE MA PB PE PI RN SE ES MG RJ SP PR RS SC DF GO MT MS
North Northeast Southeast South Midwest
Absolute difference (p.p) Relative differences
a) Coverage in 2016 - coverage in 2006, in percentage points (p.p.). b) Coverage in 2016/coverage in 2006.
Note: For the relative differences, see the y axis on the right.
Figure 1 – Absolute differencea and relative differenceb of Family Health Strategy coverage between periods, by
Federative Units, Brazil, 2006 and 2016
Figure 2 – Family Health Strategy coverage, categorized into three groups, by Federative Units, Brazil, 2006 and 2016
2006 2016
N
0 250 500km 0-49.9%
50-74.9%
75-100%
disparities can be seen in its progression, possibly because of the different management processes adopted by municipalities and the FUs, which are endowed with autonomy to define priorities in the use of resources allocated health, and may or not prioritize investments in Primary Health Care.6
contrast, in the same year (2016), between eight and ten people residing in the Northeast were covered by FHS; studies3,24,25 have demonstrated a consolidation
of FHS in this region, as a result of the pioneer way it has been deployed.3,24,25
The federal option for a National Primary Health Care Policy (PNAB) deployment and management model of the, based on funding to encourage service supply (financial incentives and federal transfers), might help to explain, in broader terms, greater or lesser adherence to FHS by FUs. When transfers received from the Union form a relatively larger part of FUs budgets, they adhere more. The opposite is also observed in terms of the lower adherence of wealthier FUs the budgets of which are less dependent on transfers of federal resources.
Among other factors, there is also the possibility of action of forces involved in the reproduction of practices of the medical-industrial complexes of economically richer health regions, FUs and municipalities, involving greater investment in specialized services and tertiary care26 and, consequently, having a larger specialized
workforce, which is either against or at least not interested in FHS expansion and changing the model of care.
It is unlikely that one factor alone would be able to explain the situation of each region, FUs or municipality, in view of each of them having their own particular historical, political, economic and social complexity.
The findings presented here are in keeping with a study performed on data from the 2013 National Health Survey (PNS),24 which investigated FHS population
coverage through self-reporting. Even considering that self-reported estimated coverage is, in general, lower than that provided by the Department of Health Care/Ministry of Health, neverthelesss that study demonstrated that the FUswith greater coverage were Piauí, Tocantins and Paraíba, while coverage was lowest in the Federal District.24
The same study24 showed that about one-fifth of the
Brazilian population covered by FHS had never received a visit from a Family Health team member, and less than half had received such a visit on a monthly basis. Perhaps many people are unaware that they fall within the coverage area of a PHU operating under the FHS. This might be attributed to PHU failures in registering and monitoring families in their area. In many cases, there is a lack of health professionals and complete
teams. This results in teams being responsible for more than 4,000 people – the maximum number recommended by the Ministry of Health.1,6
Some authors3,4,8,27 point to an expansion of the
Primary Health Care network, increased access and, consequently, greater equity in the provision of these services and improvement of some health indicators such as, for example, infant mortality, hospitalizations for ambulatory care sensitive conditions and basic prenatal care. The FHS model of care has shown better health outcomes when compared to the traditional model,3,8 probably because it is a strategy aimed at
qualifying the work process, reinforcing the principles and guidelines of Primary Health Care and expanding the effectiveness of their actions.1
Because it is a study that used secondary data, some limitations should be considered. Over the years, Brazilian health information systems have improved and become more reliable;28 however, as
this is a trend study that used data from 2006 to 2016, it is possible that some coverage records are not so accurate, especially at the beginning of the period. Furthermore, adequate data input on the systems may vary according to each region and FU, thus hindering their comparability. Another point to be stressed is the fact that the study has evaluated FHS coverage, and not FHS performance or quality. Even though some areas have high coverage, this does not mean that the strategy is running optimally. Despite the limitations of this study, we believe that the use of such data has not caused significant bias in the trend estimates, so that the findings are relevant for describing the FHS time series status in Brazil.
1. Ministério da Saúde (BR). Secretaria de Assistência à Saúde. Coordenação de Saúde da Comunidade. Saúde da família: uma estratégia para reorientação do modelo assistencial [Internet]. Brasília: Ministério da Saúde; 1997 [citado 2018 abr 23]. 36 p. Disponível em: http:// bvsms.saude.gov.br/bvs/publicacoes/cd09_16.pdf 2. Sisson MC. Considerações sobre o programa
de saúde da família e a promoção de maior equidade na política de saúde. Saúde Soc. 2007set-dez;16(3):85-91.
3. Facchini LA, Piccini RX, Tomasi E, Thumé E, Silveira DS, Siqueira FV, et al. Desempenho do PSF no Sul e no Nordeste do Brasil: avaliação institucional e epidemiológica da Atenção Básica à Saúde. Ciênc Saúde Coletiva. 2006 set;11(3):669-81.
4. Macinko J, Guanais FC, Fátima M, Souza M. Evaluation of the impact of the family health program on infant mortality in Brazil, 1990-2002. J Epidemiol Community Health. 2006 Jan;60(1):13-9.
5. Macinko J, Lima-Costa MF. Horizontal equity in health care utilization in Brazil, 1998-2008. Int J Equity Health. 2012 Jun;11(1):33.
6. Ministério da Saúde (BR). Secretaria de Atenção à Saúde. Departamento de Atenção Básica. Política nacional de atenção básica [Internet]. Brasília: Ministério da Saúde: 2012 [citado 2018 abr 24]. 110 p. Disponível em: http://189.28.128.100/dab/docs/ publicacoes/geral/pnab.pdf
7. Costa GD, Cotta RMM, Ferreira MLSM, Reis JR, Franceschini SCC. Saúde da família: desafios no processo de reorientação do modelo assistencial. Rev Bras Enferm. 2009 fev;62(1):113-8.
8. Mendoza-Sassi RA, Cesar JA, Teixeira TP, Ravache C, Araújo GD, Silva TC. Diferenças no processo de atenção ao pré-natal entre unidades da estratégia saúde da família e unidades tradicionais em um município da Região Sul do Brasil. Cad Saúde Pública. 2011 abr;27(4):787-96.
9. Anversa ETR, Dal Pizzol TS, Bastos GAN, Nunes LN. Qualidade do processo da assistência pré-natal: unidades básicas de saúde e unidades de estratégia saúde da família em município no Sul do Brasil. Cad Saúde Pública. 2012 abr;28(4):789-800.
10. Rasella D, Harhay MO, Pamponet ML, Aquino R, Barreto ML. Impact of primary health care on mortality from heart and cerebrovascular diseases in Brazil: a nationwide analysis of longitudinal data. BMJ. 2014 Jul;349:g4014.
11. Macinko J, Dourado I, Aquino R, Bonolo PF, Lima-Costa MF, Medina MG, et al. Major expansion of primary care in Brazil linked to decline in unnecessary hospitalization. Health Aff. 2010 Dec;29(12):2149-60.
12. Macinko J, Oliveira VB, Turci MA, Guanais FC, Bonolo PF, Lima-Costa MF. The influence of primary care and hospital supply on ambulatory care-sensitive hospitalizations among adults in Brazil, 1999-2007. Ame J Public Health. 2011 Oct;101(10):1963-70. 13. Siqueira FV, Nahas MV, Facchini LA, Silveira DS,
Piccini RX, Tomasi E, et al. Aconselhamento para a prática de atividade física como estratégia de educação à saúde. Cad Saúde Pública. 2009 jan;25(1):203-13.
14. Paim J, Travassos C, Almeida C, Bahia L, Macinko J. The brazilian health system: history, advances, and challenges. Lancet. 2011 May;377(9779):1778-97. 15. Ministério da Saúde (BR). Departamento de Atenção
Básica. Histórico de cobertura da saúde da família. 2016 [citado 2016 nov 7]. Disponível em: http://dab. saude.gov.br/portaldab/historico_cobertura_sf.php. 16. Ministério da Saúde (BR). Departamento de Atenção
Básica. Nota técnica: histórico de cobertura da saúde da família Brasília [Internet]. Brasília: Ministério da Saúde; [s.d.] [ citado 2016 nov 7]. 3 p. Disponível em: http://189.28.128.100/dab/docs/geral/historico_ cobertura_sf_nota_tecnica.pdf.
17. Brasil. Ministério da Saúde. Portaria MS/GM nº 648, de 28 de março de 2006. Aprova a política nacional de atenção básica, estabelecendo a revisão de diretrizes e normas para a organização da atenção básica para o programa saúde da famísia (PSF) e o programa agentes comunitários de saúde (PACS). Diário Oficial da República Federativa do Brasil, Brasília (DF), 2006 mar 29; Seção 1:71. 18. Brasil. Ministério da Saúde. Portaria MS/GM nº
2.488, de 21 de outubro de 2011. Aprova a política
References
Authors' contributions
Neves RG, Flores TR, Duro SMS, Nunes BP and Tomasi E participated in the conception, data analysis and interpretation and writing of the manuscript. All
nacional de atenção básica, estabelecendo a revisão de diretrizes e normas para a organização da atenção básica, para a estratégia saúde da família (ESF) e o programa de agentes comunitários de saúde (PACS). Diário Oficial da República Federativa do Brasil, Brasília (DF), 2011 dez 24; Seção 1:48.
19. Antunes JLF, Cardoso MRA. Uso da análise de séries temporais em estudos epidemiológicos. Epidemiol Serv Saúde. 2015 jul-set;24(3):565-76.
20. Pinto HA, Sousa A, Florêncio AR. O programa nacional de melhoria do acesso e da qualidade da atenção básica: reflexões sobre o seu desenho e processo de implantação. R Eletr Com Inf Inov Saúde. 2012 ago;6(2).
21. Ministério da Saúde (BR). Departamento de Atenção Básica. Programa de requalificação de unidades básicas de saúde [Internet]. 2017 [citado 2017 fev 1]. Disponível em: http://dab.saude.gov.br/portaldab/ ape_requalifica_ubs.php.
22. Ministério da Saúde (BR). Programa de valorização dos profissionais da atenção básica [Internet]. 2017 [citado 2017 fev 1]. Disponível em: http://provab. saude.gov.br/.
23. Santos LMP, Costa AM, Girardi SN. Programa mais médicos: uma ação efetiva para reduzir iniquidades em saúde. Ciênc Saúde Coletiva. 2015 nov;20(11):3547-52.
24. Malta DC, Santos MAS, Stopa SR, Vieira JEB, Melo EA, Reis AAC. A cobertura da estratégia de saúde da família (ESF) no Brasil, segundo a pesquisa nacional de saúde, 2013. Ciênc Saúde Coletiva. 2016 fev;21(2):327-38.
25. Copque HLF, Trad LAB. Programa saúde da família: a experiência de implantação em dois Municípios da Bahia. Epidemiol Serv Saúde. 2005 out-dez;14(4):223-33.
26. Viana ALA, Rocha JSY, Elias PE, Ibañez N, Novaes MHD. Modelos de atenção básica nos grandes municípios paulistas: efetividade, eficácia, sustentabilidade e governabilidade. Ciênc Saúde Coletiva. 2006 jul-set;11(3):577-606.
27. Nedel FB, Facchini LA, Martín M, Navarro A. Características da atenção básica associadas ao risco de internar por condições sensíveis à atenção primária: revisão sistemática da literatura. Epidemiol Serv Saúde. 2010 jan-mar;19(1):61-75.
28. Lima CRA, Schramm JMA, Coeli CM, Silva MEM. Revisão das dimensões de qualidade dos dados e métodos aplicados na avaliação dos sistemas de informação em saúde. Cad Saúde Pública. 2009 out;25(10):2095-109.
Received on 22/05/2017