ABSTRACT:Objective: To analyze the spatial risk of AIDS mortality in census tracts in a large Brazilian city. Method:
We studied three retrospective cohorts of individuals with AIDS, who were residents in the city of Campinas, in the State of São Paulo, Brazil. The occurrence of death was analyzed from 1980 to 1990 (cohort 1), 1996 to 2000 (cohort 2), and from 2001 to 2005 (cohort 3). We adjusted a Bayesian semi-parametric model, using the Integrated Nested Laplace Approximation (INLA) method, which allowed for the mapping of mortality risk for the three cohorts. Results: The incidence of death in cohorts 1, 2 and 3 were, respectively, 72.73, 32.21 and 13.11%. The death risk maps showed a tendency of mortality decrease, and presented the sectors with the highest and lowest risk for each period. The model showed that, in the three cohorts, factors associated with the highest risk of death were: being male, and having an age at diagnosis greater than 49 years old. The homosexual/bisexual orientation was associated with lower risk of dying. Conclusions: Even considering the reduction in the risk of death from AIDS in recent years, after access to highly active antiretroviral therapy, the highest incidence was found among the poorest individuals in the three studied cohorts. The maps and risk factors obtained suggest possible actions for monitoring the disease in the city.
Keywords: AIDS. Mortality. Antiretroviral therapy, highly active. Survival analysis.
Spatial risk of death in patients with
AIDS in Campinas, São Paulo, Brazil
Risco espacial de óbito de pacientes com aids em Campinas, São Paulo, Brasil
Thiago Santos MotaI, Maria Rita DonalisioII, Liciana Vaz de Arruda SilveiraI
ORiginAl ARTiCle / artigo original
IDepartment of Biostatistics, Universidade Estadual Paulista “Júlio de Mesquita Filho” – Botucatu (SP), Brazil.
IIDepartment of Collective Health, School of Medical Sciences, Universidade Estadual de Campinas – Campinas (SP), Brazil.
Corresponding author: Thiago Santos Mota. Rua Professora Doutora Irina Delanova Gemtchujnicov, sem número, Caixa Postal: 510, Distrito de Rubião Junior, CEP: 18618-693, Botucatu, SP, Brazil. E-mail: thiagosanmota@ibb.unesp.br
INTRODUCTION
Over the past three decades, the AIDS epidemic has been affecting several segments of the population, particularly young adults. The epidemic has a major impact on the finances and the quality of life of individuals1.
Several studies point to a drastic reduction in AIDS mortality in several parts of the world due to the use of antiretroviral therapy (TARV)1-4. In Brazil, the Ministry of Health has
guar-anteed access to combined antiretroviral medication since 1996. Its impact on increasing patient survival, reducing hospitalizations and opportunistic infections, and on the increase of chronic diseases has been recorded in several studies in the country3,5-7.
Geospatial approaches have been used to study AIDS epidemic trends in Brazil, and they point to regional disparities with regard to the risks of becoming ill and dying8,9.
In the State of São Paulo, in the 1980s, the disease affected mainly homosexual people, indi-viduals using injectable drugs, and patients undergoing transfusions. In the following decades the epidemic reach several other groups in society, and underwent a process where hetero-sexual people, women, and impoverished people also became affected. Currently, the disease has expanded in young adults with a low socioeconomic status10,11.
Considering this perspective, and in order to understand the dynamics of the AIDS epi-demic in the city of Campinas, São Paulo, Brazil, the cases reported by the Information System for Notifiable Diseases (Sistema de Informação de Agravos de Notificação – SINAN) and the death of city dwellers reported in the Mortality Information System (Sistema de Informação sobre Mortalidade - SIM) database. The objective was to analyze the spatial risk of death among patients reported to have AIDS in the census tracts of this city, over time.
ReSUMO:Objetivo: O estudo teve como objetivo analisar o risco espacial de mortalidade por aids em setores censitários de município brasileiro de grande porte. Método:Foram estudadas três coortes retrospectivas de indivíduos notificados por aids e residentes no município de Campinas, São Paulo, nos períodos de 1980 a 1990 (coorte 1), 1996 a 2000 (coorte 2) e 2001 a 2005 (coorte 3), a fim de identificar a ocorrência do óbito. Foi ajustado um modelo semiparamétrico Bayesiano, empregando o método de Aproximação de Laplace Aninhada e Integrada (INLA), que permitiu obter mapas de risco de óbito nas três coortes estudadas. Resultados:A incidência de óbito nas coortes 1, 2 e 3 foram, respectivamente, 72,73; 32,21 e 13,11%. Os mapas de risco de óbito apontaram tendência de queda da mortalidade e evidenciaram os setores que apresentaram maior e menor risco em cada período. O modelo mostrou que, nas três coortes, os fatores associados ao maior risco de óbito foram: ser do sexo masculino e possuir idade de diagnóstico superior a 49 anos. A orientação homossexual/bissexual foi associada ao menor risco de morrer.
Conclusões:Mesmo diante da diminuição do risco de morte por aids nos últimos anos, após o acesso à terapia antirretroviral altamente ativa, a maior incidência se concentra entre os mais pobres nas três coortes estudadas. Os mapas e o fatores de risco obtidos orientam possíveis ações e monitoramento da doença no município.
METHODS
The study involved three retrospective cohorts of patients who were over 13 years of age, reported to have AIDS according to SINAN, and who were residents of the city of Campinas, located in the northeast region of the State of São Paulo (approximately 1 million inhabitants). We excluded 1,091 (26.13%) patients whose report coincided with the date of death, in order to reduce the impact of the survival time of these patients, focusing instead on the results of the survival time of patients with access to follow-up and treatment.6 One cohort was composed
of individuals who reported having AIDS in the early years of the epidemic. This was done in order to identify occurrence of death from 1980 to 1990 (cohort 1 – follow-up of 10 years, with an average survival time of 5.7 years, and with a standard deviation of 6.5 years). Another cohort reported from 1996 to 2000 (cohort 2 – follow-up of 10 years, with an average survival time of 9.2 years, and with a standard deviation of 5.6 years). And a third was from 2001 to 2005 (cohort 3 – follow-up of 7 to 9 years, with an average survival time of 8.9 years, and with a standard deviation of 3 years). In addition to SINAN, information was obtained in the SIM regarding the deaths of the reported patients. Patients who were not on the SINAN notifica-tion list were not included. After checking for duplicanotifica-tion and inconsistency in the database, the final variables used in the study were: gender, age at diagnosis, schooling, transmission cat-egory (sexual: homosexual / bisexual or heterosexual, use of injectable drugs), and CD4 T lym-phocyte cell count categorized into counts less than or equal to 350 cells per mm3 of blood as
a criterion for AIDS. They were all analyzed in the model as a continuous variable. In addition, the location of the geo-referenced residences in the census tracts was also obtained. In cohort 1, there were a total of 286 individuals, 245 (85.66%) men and 41 (14.34%) women. In cohort 2, the data showed 1,456 individuals, consisting of 1,006 (69.09%) men and 450 (30.91%) women. In cohort 3, there were 1,342 individuals, 831 (61.92%) men and 511 (38.08%) women.
To model the death risk, an approach was necessary that would take into account the variables of interest and the spatial information of the cases. We used a semi-parametric regression model in a Bayesian scenario, which allowed us to model the risk of death in relation to the census tracts.
The semi-parametric Bayesian model used was implemented in program R, of the INLA package12,13.
The assumption was that the times until death are partitioned into a finite interval, 0 = S0
< S1 < ⋅⋅⋅ < SX, ti < SZ, for ∀ti with i = 1 ⋅⋅⋅, n, and that baseline risk is constant over time ]Sk-1,
Sk], with k = 1 ⋅⋅⋅ , K, so, h0(t) = hk , for each t∈ ]Sk-1, Sk]. The model for the i-th individual in the k-th time interval belonging to the j-th census sector is given by (Equation 1):
hikj(t) = h0(t) exp{X' iβ+f(zj)} = exp{Xi' β+f(zj)+bk}=exp{ηikj}, (1)
So that:
hikj: risk rate function;
bk=log[h0(t)] ;
xi: dimension vector p×1 of covariates observed for the i-th individual; and
f(zj): spatial effect in the j-th census sector of the city of Campinas, São Paulo.
For the f(zj), component, the ICAR model was adopted14, which can be expressed by
(Equation 1):
⎛ ⎜ ⎝
⎞ ⎟ ⎠
Σ
1 1
( )| ( ) ~j w ~ (Z ),w
j j Z
f z f z N j wf
l l τ (2)
So that:
lj: the number of sectors that share the same border with the j; and
j~w : two census tracts j e w are neighbors;
For the parameter vector, Gaussian prioris are,β∼N(0 ;104I) for the vector b=(b 1,⋅⋅⋅,bk),
Gaussian prioris, bk+1-bk∼N(0,τb-1), of a first order random walk (RW1) and for the
hyperpa-rameters, τb e τz, independent prioris with gamma distribution, Γ(1;0,0001).
Considering the Bayesian scenario, in order to make inferences from this model, the Bayesian Integrated Nested Laplace Approximation (INLA) approach is an alternative to the Markov Chain Monte Carlo (MCMC)15.
Basically, the INLA methodology was created for a class of structured additive regression models. The central idea of the INLA methodology is to make numerical integrations in a Bayesian context, in which only deterministic approximations are used to obtain the posterior distri-butions, thus obtaining an expressive computational gain15.
In order to aggregate the residential locations of the individuals belonging to the same census sector, we used the QGIS 2.8.2 software and a map of the city of Campinas, São Paulo, which was obtained from the website of the Brazilian Institute of Geography and Statistics (Instituto Brasileiro de Geografia e Estatística – IBGE) of the Urban Census Bureau from the year 2000. All of the statistical analyzes were carried out using the R program13.
In order to identify the regions of the city with the greatest social and environmental disad-vantages, a spatial distribution map from the Socio-environmental Disadvantage Index (Índice de Carência Socioambiental – ICSA) was used, according to socioeconomic and environmental classes according to coverage area of the Health Centers in Campinas, which was developed by Costa et al.16. This map makes it possible to extract three low, moderate and high
socioenviron-mental disadvantages from a statistical analysis of the main components of demographic and socioenvironmental variables, based on the Foundation of the Brazilian Institute of Geography and Statistics (Fundação Instituto Brasileiro de Geografia e Estatística – FIBGE) Census in 2000.
RESULTS
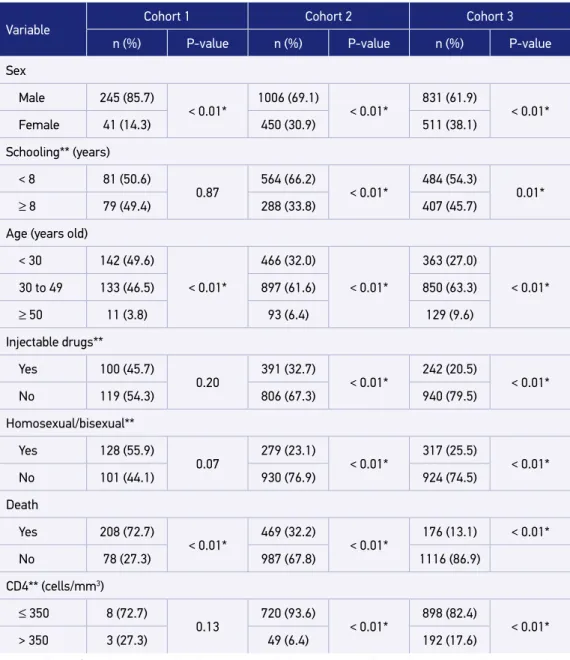
diagnoses: in women, heterosexual individuals, and in the age groups older than 30 years old. In relation to schooling, the majority of the diagnoses occurred in individuals with less than 8 years of schooling. There was a reduction in the category of transmission for use of injectable drugs among the reported patients, which can be seen in cohorts 2 and 3. When the
Table 1. Number and proportions of individuals diagnosed with AIDS according to the variables
in the three cohorts studied, Campinas, São Paulo.
Variable
Cohort 1 Cohort 2 Cohort 3
n (%) P-value n (%) P-value n (%) P-value
Sex
Male 245 (85.7)
< 0.01* 1006 (69.1) < 0.01* 831 (61.9) < 0.01*
Female 41 (14.3) 450 (30.9) 511 (38.1)
Schooling** (years)
< 8 81 (50.6)
0.87
564 (66.2)
< 0.01*
484 (54.3)
0.01*
≥ 8 79 (49.4) 288 (33.8) 407 (45.7)
Age (years old)
< 30 142 (49.6)
< 0.01*
466 (32.0)
< 0.01*
363 (27.0)
< 0.01*
30 to 49 133 (46.5) 897 (61.6) 850 (63.3)
≥ 50 11 (3.8) 93 (6.4) 129 (9.6)
Injectable drugs**
Yes 100 (45.7)
0.20
391 (32.7)
< 0.01*
242 (20.5)
< 0.01*
No 119 (54.3) 806 (67.3) 940 (79.5)
Homosexual/bisexual**
Yes 128 (55.9)
0.07 279 (23.1) < 0.01* 317 (25.5) < 0.01*
No 101 (44.1) 930 (76.9) 924 (74.5)
Death
Yes 208 (72.7)
< 0.01* 469 (32.2) < 0.01* 176 (13.1) < 0.01*
No 78 (27.3) 987 (67.8) 1116 (86.9)
CD4** (cells/mm3)
≤ 350 8 (72.7)
0.13
720 (93.6)
< 0.01*
898 (82.4)
< 0.01*
> 350 3 (27.3) 49 (6.4) 192 (17.6)
death variable is evaluated, a drastic drop in the number of deaths in cohort 3 was observed, when compared to the other two cohorts. In all three cohorts, most of the reported individ-uals had a CD4 cell count lower than 350 cells per mm3 at the time of diagnosis.
A large percentage of information loss was observed in the three study periods, as shown in Table 1. Because cohort 1 presented 96% lack of information on the CD4 variable, which is understandable considering the reality of services available in the first decade of the epi-demic, it was not included in the model fit of cohort 1. Also, it was considered a continuous variable in the model adjustments in order to maximize the information.
Table 2 presents the results of the adjustment of the semi-parametric model (Equations 1 e 2) with the subsequent estimates (mean and standard deviation). Table 3 shows the risk
Table 2. Subsequent estimates (mean, standard deviation and 95% credible interval) of the parameters of the semi-parametric model for the variables in cohorts 1, 2 and 3.
Variable Category
Cohort 1 Cohort 2 Cohort 3
Mean (SD) 95%CI Mean (SD) 95%CI Mean (SD) 95%CI
Intercept
- -8.78 (0.44) - 9.71 – -7.99 -10.90 (0.26) -11.46 – -10.43 -12.01 (0.32) -12.68 – -11.99
Sex
Male 0.23 (0.21) -0.18 – 0.66 0.444 (0.12) 0.22 – 0.67 0.65 (0.18) 0.30 – 1.02
Female – – – – – –
Schooling (years)
< 8 0.01 (0.16) -0.31 – 0.32 -0.34 (0.10) -0.53 – -0.14 0.18 (0.15) -0.12 – 0.49
≥ 8 – – – – – –
Age (years old)
≤ 30 – – – – – –
30 – 49 0.78 (0.15) 0.49 – 1.08 0.25 (0.11) 0.04 – 0.46 0.34 (0.20) -0.04 – 0.74
≥ 50 0.84 (0.35) 0.12 – 1.48 0.92 (0.18) 0.56 – 1.25 0.95 (0.25) 0.46 – 1.44
Injectable drugs
Yes -0.31 (0.16) -0.63 – 0.00 0.09 (0.11) -0.11 – 0.30 0.01 (0.19) -0.38 – 0.38
No – – – – – –
Homosexual/ bisexual
Yes -0.72 (0.17) -1.05 – -0.38 -0.57 (0.13) -0.84 – -0.32 -0.72 (0.22) -1.16 – -0.30
No – – – – – –
CD4* – – -0.006 (0.001) -0.007 – -0.005 -0.001 (0.003) -0.004 – 0.004
Table 3. Ratio of death risk and their respective 95% credible intervals obtained from the adjustment of the semi-parametric model, for individuals diagnosed with AIDS, in cohorts 1, 2 and 3, Campinas, SP.
Variable Category
Cohort 1 Cohort 2 Cohort 3
RR 95%CI RR 95%CI RR 95%CI
Sex
Male 1.26 0.84 – 1.94 1.55 1.24 – 1.95 1.91 1.36 – 2.73
Female – – – – – –
Schooling (years)
< 8 1.01 0.74 – 1.37 0.71 0.59 – 0.87 1.20 0.88 – 1.63
≥ 8 – – – – – –
Age (years old)
≤ 30 – – – – – –
30 – 49 2.19 1.62 – 2.95 1.28 1.04 – 1.58 1.41 0.96 – 2.10
≥ 50 2.32 1.13 – 4.39 2.50 1.76 – 3.50 2.59 1.58 – 4.24
Injectable drugs
Yes 0.73 0.53 – 1.00 1.10 0.89 – 1.35 1.01 0.68 – 1.46
No – – – – – –
Homosexual/Bisexual
Yes 0.49 0.35 – 0.68 0.56 0.43 – 0.73 0.49 0.31 – 0.74
No – – – – – –
CD4 (cells/mm3) – – 0.994 0.992 – 0.995 1.00 0.99 – 1.01
RR: death risk ratio; 95%CI: credible interval of 95%.
ratios associated with the study variables and their respective 95% credible intervals (95%CI). In cohort 1, the effects of gender, schooling and category of transmission due to use of inject-able drugs were not significant, since the posteriori average equal to zero was found in the 95%CI. In cohorts 2 and 3, the category of transmission due to use of injectable drugs was not significantly associated with the risk of dying. In cohort 3, it was also observed that the effects of the variables of age, in the range of 30 to 49 years old, schooling and CD4 count were not significant.
0 1.000 2.000
A B
C D
Cohort 1: 1980–1990 Cohort 2: 1996–2000
Cohort 3: 2001–2005 Spatial risk of the area
Spatial risk of the area
Spatial risk of the area (0.000126, 0.000263]
(-1,31e-05, 0.000126] (-0.000111, -1.31e-05] [-0.00036, -0.000111]
(0.000172, 0.000849] (-4.13e-05, 0.000172] (-0.000173, -4.13e-05] [-0.000489, -0.000173]
(8.68e-05, 0.000577] (1.27e-06, 8.68e-05] (-0,000101, 1.27e-06] [-0.00025, -0.000101]
small disadvantage moderate major disadvantage
ICSA
Classes of social-environmental disadvantages
0 10
BraZil São Paulo Campinas
km
km
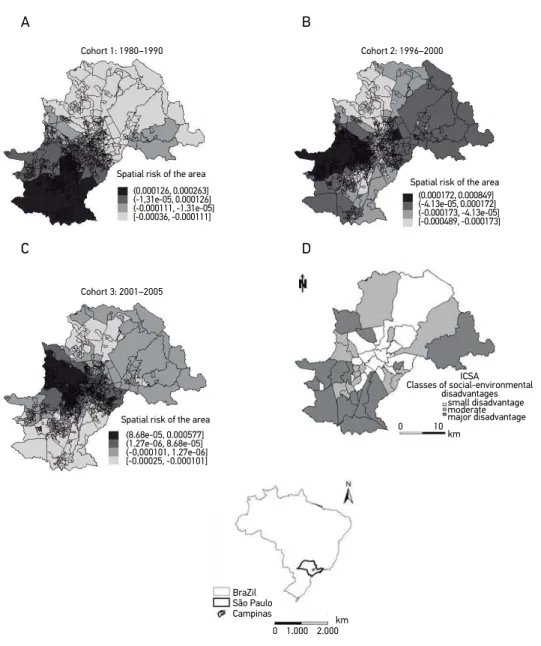
Figure 1. Maps of the spatial effects for the census tracts (posteriori means) for AIDS mortality in the cohorts studied (A, B, C) and a map of socio-environmental disadvantage classes (D, obtained from article Costa et al.16) of the city of Campinas, São Paulo.
The maps presented in Figure 1 (A, B and C) show the risk of death by census tract in the city of Campinas, indicating that the higher the value on the scale, the higher the risk of death of the individuals reported to have AIDS during the study period.
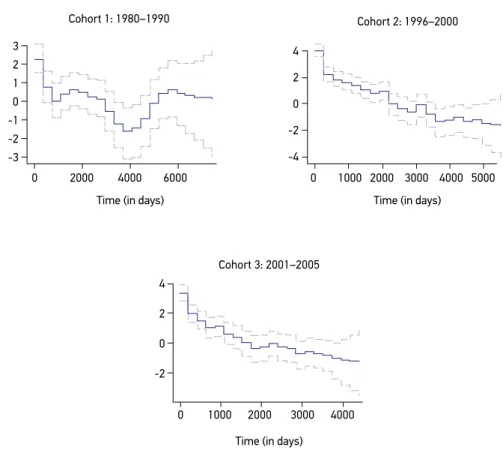
Figure 2. Posteriori mean (solid line) and credible interval of 95% (dashed line) to log the baseline risk of the adjusted model for mortality.
Cohort 1: 1980–1990 Cohort 2: 1996–2000
Cohort 3: 2001–2005 3
2 1
0 -1
-2 -3
4
2
0
-2
-4
4
2
0
-2
Time (in days) Time (in days)
Time (in days)
0 2000 4000 6000 0 1000 2000 3000 4000 5000
0 1000 2000 3000 4000
was higher among the north, northwest, southwestern and central regions. The maps show differences in the spatial distribution with regard to the risk of dying, but the highest risk predominates in areas with precarious socio-environmental indicators, as shown in Figure 1D. Figure 2 shows the baseline risk graphs of the adjusted model in each of the cohorts. We emphasize that the risk of death decreases over time in cohorts 2 and 3, and becomes close to 0 after around 2,000 days of follow-up.
DISCUSSION
This study demonstrates the increasing decline in the risk of dying among residents reported to have AIDS in the city of Campinas in three periods. Mortality among patients has decreased over time, as has been pointed out in other studies in Brazil and in other parts of the world3,4,6,17. With access to highly active antiretroviral therapy (HAART) from 1996,
In addition to the impact on mortality, the morbidity of patients with an HIV infection has progressively decreased, increasing the survival and quality of life of infected patients. However, AIDS continues to be a disease that has a major impact on morbidity and mor-tality, and requires ongoing prevention and care.
Estimates of the analyzes in the cohorts studied identify men — older than 50 years old and in the sexual orientation heterosexual — as the ones with the highest risk of dying, according to the periods studied in Campinas.
Several authors have associated greater survival of patients with AIDS with the vari-ables of age at diagnosis, sex, socioeconomic status and category of exposure, as observed in this study in Campinas8,17-19. The socioeconomic conditions of patients can influence
the risk of dying due to differences in access to clinical follow-up, complication preven-tion, and adherence to antiretroviral, which are lower among poorer populations4,11,17,18.
The maps presented show worse survival estimators in the south and southwestern regions of the city, especially in the first cohorts. The southwestern region is the most at risk in the 2001-2005 cohort in all of the maps. These regions coincide with areas of high socio-en-vironmental disadvantages16.
The spatial distribution of risk among the census tracts in Campinas shows differences among the cohorts. Although the risk scales are declining, the maps indicate that the poor-est regions of the city (northwpoor-est, southwpoor-est) have always been those with the highpoor-est AIDS-related mortality. Possible explanations include precarious living conditions, lack of access to services, or the high percentage of drug use in the first decades of the epidemic.
The “aging” of the epidemic and a worse prognosis for patients over 50 years old have also been identified by other authors20. It is necessary to recognize this age group’s
vulner-ability to infection, considering the lower perception of risk, less knowledge reduced access to prevention methods, in addition to late diagnosis in this age group19.
Some clinical variables not addressed in this study have also been identified as survival predictors of patients with AIDS, such as opportunistic diseases, comorbidities, access to and adherence to therapeutic regimens, and specialized services3,4,6,17. Most individuals with
a CD4 count ≤ 350 cells per mm3 at the time of diagnosis suggest a late diagnosis of the
dis-ease. The negative association of a CD4 count at the first visit (continuous variable) with mortality in cohort 2 reinforces this laboratory parameter as a way to predict the worst clinical evolution. However, in cohort 3, other variables displaced CD4, including age and sex, which explained the death risk. Access to antiretroviral medication given at referral services in the city possibly decreased the influence of this laboratory indicator as a predic-tor of death. Campinas has two municipal reference centers for STIs / AIDS, a guidance center and a serological support center, as well as reference outpatient clinics at Hospital das Clínicas at the Universidade Estadual de Campinas (Unicamp) and at the Celso Pierro Hospital of the Pontifícia Universidade Católica (PUC) of Campinas, with a wide range of coverage of individuals with HIV / AIDS in the municipality and in the metropolitan region.
1. Fonseca MGP, Bastos FI. Twenty-five years of the AIDS epidemic in Brazil: principal epidemiological findings, 1980-2005. Cad Saúde Pública. 2007. DOI: 10.1590/S0102-311X2007001500002
2. Fordyce EJ, Singh TP, Nash D, Gallagher B, Forlenza S. Survival rates in NYC in the era of combination ART. J Acquir Immune Defic Syndr. 2002; 30(1): 111-8.
3. Lima VD, Hogg RS, Harrigan PR, Moore D, Yip B, Wood E, et al. Continued improvement in survival among HIV-infected individuals with newer forms of highly active antiretroviral therapy. AIDS. 2007; 21(6): 685-92. DOI: 10.1097/QAD.0b013e32802ef30c
4. Schneider MF, Gange SJ, Williams CM, Anastos K, Greenblatt RM, Kingsley L, et al. Patterns of the hazard of death after AIDS through the evolution of
antiretroviral therapy: 1984-2004. AIDS. 2005. DOI: 10.1097/01.aids.0000189864.90053.22
5. Chequer P, Hearst N, Hudes ES, Castilho E, Rutherford G, Loures L, et al. Determinants of survival in adult Brazilian AIDS patients, 1982-1989. The Brazilian State AIDS Program Co-Ordinators. AIDS. 1992.
6. Guibu IA, Barros MB de A, Donalísio MR, Tayra Â, Alves MCGP. Survival of AIDS patients in the Southeast and South of Brazil: analysis of the 1998-1999 cohort. Cad Saúde Pública. 2011; 27(Suppl 1): S79-92. http:// dx.doi.org/10.1590/S0102-311X2011001300009
7. Tancredi MV, Waldman EA. Survival of AIDS patients in Sao Paulo-Brazil in the pre- and post-HAART eras: a cohort study. BMC Infect Dis. 2014. DOI: 10.1186/ s12879-014-0599-8
REFERENCES
late, others are detected at the time of clinical intercurrence, or death. Excluding patients reported with AIDS at the time of death sought to reduce such distortions. The underre-porting of AIDS cases and deaths may occur due to a lack of diagnosis or incomplete death certificates. In addition, the notification sheets are not always well filled out, thus providing inaccurate information. However, this study deals with a database that has valuable informa-tion on disease trends in Brazil and over time. On the other hand, the long follow-up period of the three cohorts implies that there will be a comparison between the cohorts in different risk contexts, with regard to therapeutic options and prevention, and in relation to impact on the prognosis of the patients. The study periods are certainly heterogeneous, as they result from different epidemiological conjunctures.
CONCLUSIONS
8. Teixeira TR de A, Gracie R, Malta MS, Bastos FI. Social geography of AIDS in Brazil: identifying patterns of regional inequalities. Cad Saúde Pública. 2014; 30(2): 259-71. DOI: 10.1590/0102-311X00051313
9. Sousa AIA de, Pinto VL. Análise espacial e temporal dos casos de aids no Brasil em 1996-2011: áreas de risco aumentado ao longo do tempo. Epidemiol Serv Saúde. 2016; 25(3): 467-76. DOI: 10.5123/ S1679-49742016000300003
10. Santos NJS, Tayra A, Silva SR, Buchalla CM, Laurenti R. A aids no Estado de São Paulo: as mudanças no perfil da epidemia e perspectivas da vigilância epidemiológica. Rev Bras Epidemiol. 2002; 5(3): 286-310. DOI: 10.1590/ S1415-790X2002000300007
11. Pellini ACG, Bellini JH, Cavalin RF, Chiaravalloti Neto F, Zanetta DMT. Distribuição espacial das notificações de aids em mulheres no município de São Paulo nos períodos de 1999-2001 e 2009-2011: uma análise sob a ótica da desigualdade socioespacial. Rev Espaço Geogr [Internet]. 2015; 18(2). Disponível em: http://www.lsie.unb.br/espacoegeografia/index. php/espacoegeografia/article/view/441 (Acessado em 05 de janeiro de 2016).
12. Martino S, Akerkar R, Havard R. Approximate Bayesian Inference for Survival Models. Scand J Stat. 2011; 38(3): 514-28. DOI: 10.1111/j.1467-9469.2010.00715.x
13. R Development Core Team. R: A language and environment for statistical computing [Internet]. Viena: R Found Stat Comput Vienna; 2017. Disponível em: http://www.r-project.org/ (Acessado em 10 de março de 2017).
14. Besag J, Kooperberg C. On conditional and intrinsic autoregressions. Biometrika. 1995; 82(4): 733-46. https://doi.org/10.1093/biomet/82.4.733
15. Rue H, Martino S, Chopin N. Approximate Bayesian inference for latent Gaussian models by using integrated nested Laplace approximations. J R Stat Soc Ser B Stat Methodol. 2009; 71(2): 319-92.
16. Costa JV, Donalisio MR, Silveira LV de A. Spatial distribution of dengue incidence and socio-environmental conditions in Campinas, São Paulo State, Brazil, 2007. Cad Saúde Pública. 2013; 29(8): 1522-32. DOI: 10.1590/0102-311X00110912
17. Burch LS, Smith CJ, Phillips AN, Johnson MA, Lampe FC. Socioeconomic status and response to antiretroviral therapy in high-income countries. AIDS. 2016; 30(8): 1147-62. DOI: 10.1097/QAD.0000000000001068
18. Arnold M, Hsu L, Pipkin S, McFarland W, Rutherford GW. Race, place and AIDS: The role of socioeconomic context on racial disparities in treatment and survival in San Francisco. Soc Sci Med. 2009. DOI: 10.1016/j. socscimed.2009.04.019
19. Barboza R. Homens idosos e o HIV/Aids no campo da Saúde Coletiva: vulnerabilidades e desafios na quarta década da epidemia. BIS Bol Inst Saúde. 2012; 14: 81-9.
20. Sousa ACA, Suassuna DSB, Costa SML. Perfil Clínico Epidemiológico de Idosos com AIDS. J Bras Doenças Sex Transm. 2009; 21(1): 22-6.
Received on: 10/20/2016
Final version presented on: 08/02/2017 Accepted on: 08/10/2017