Adherence to healthy lifestyles in the Programa
Academia da Saúde
Adesão a estilos de vida saudáveis no Programa Academia da Saúde
AUTHOR’SRaquel de Deus Mendonça¹ Mariana Souza Lopes²
Maria Cecília Ramos de Carvalho² Patrícia Pinheiro de Freitas² Aline Cristine Souza Lopes²
1 Universidade Federal de Ouro Preto, Departamento de Nutrição Clínica e Social, Ouro Preto, Minas Gerais, Brasil.
2 Universidade Federal de Minas Gerais, Departamento de Nutrição, Belo Horizonte, Minas Gerais, Brasil.
CORRESPONDING Aline Cristine Souza Lopes
Avenida Alfredo Balena, 190, Escola de En-fermagem, sala 316, Belo Horizonte, Minas Gerais, Brasil.
CEP: 30130-100. DOI
10.12820/rbafs.25e0127
ABSTRACT
This study aims to measure healthy lifestyles according to the time of participation in the Programa Academia da Saúde (PAS). We used baseline data from a randomized controlled community trial with a representative sample of PAS users from Belo Horizonte, Brazil (n = 3,414). The data on healthy lifestyles collected were: daily fruit and vegetables intake (≥5 servings); physical activity en-gagement (≥180min/week); body mass index (18.5kg/m² ≥ BMI ≤ 24.9kg/m²), smoking and drink-ing habits. The time of participation in the PAS was calculated by the difference between the date of registration in the program and the date of the data collection. Logistic regression models were used to evaluate associations between healthy lifestyles and time of participation in the PAS. Almost half of the participants (43.3%) had three healthy lifestyle factors. The prevalence of having all five factors varied according to the time of participation in the service; the lowest rates were in the first quartile (4.9%) and the highest rates in the fourth quartile (8.1%). Those who have attended the service for the longest time (fourth quartile) were more likely to have a healthy BMI (OR = 1.43; 95%CI: 1.14-1.80; p = 0.002) and to avoid smoking (OR = 1.62; 95%CI: 1.06-4.49; p = 0.01), compared to those who have attended the program for less time (first quartile). The prevalence of healthy lifestyles in PAS users was low. However, a longer permanence in the program seems to favor positive changes on BMI and on smoking habits.
Keywords: Fruits; Vegetables; Physical activity; Body mass index; Health services.
RESUMO
Este estudo avaliou estilos de vida saudáveis segundo o tempo de participação no Programa Academia da Saúde (PAS). Para tanto, foram utilizados dados da linha de base de um ensaio comunitário controlado e aleatorizado com amostra representativa (n = 3.414) do PAS de Belo Horizonte, Brasil. Os dados sobre estilos de vida coletados foram: consumo diário de frutas e hortaliças (≥ 5 porções); prática de atividade física (≥180min/semana); índice de massa corporal (18,5kg/m² ≥ IMC ≤ 24,9kg/m²), não fumar e não ingerir bebidas alcoólicas. O tempo de participação no PAS foi calculado pela diferença entre data de ingresso no serviço e da coleta de dados. Modelos de regressão logística foram ajustados para avaliar as associações entre estilo de vida e tempo de participação no PAS. Quase a metade dos participantes (43,3%) apresentou adesão a três fatores de estilo de vida saudável. As prevalências de todos os cinco fatores variaram segundo o tempo de participação no Programa; as menores prevalências foram no primeiro quartil (4,9%) e maiores do quarto quartil (8,1%) de tempo. Aqueles que participavam do PAS a mais tempo apresentaram maiores probabi-lidades de ter um IMC saudável (OR = 1,43; IC95%: 1,14-1,80; p = 0,002) e de não fumar (OR = 1,62; IC95%: 1,06-4,49; p = 0,01), comparados aos que participavam do Programa a menos tempo (primeiro quartil). A adesão aos estilos de vida saudáveis entre os usuários do PAS foi baixa. No entanto, maior tempo de participação no serviço pode favorecer mudanças positivas no IMC e no hábito de fumar.
Palavras-chave: Frutas; Hortaliças; Atividade física; Índice de massa corporal; Serviços de saúde.
Introduction
The adherence to healthy lifestyle factors such as fruit and vegetables (FV) regular intake, physical activity practice, healthy body mass index (BMI), absence of smoking habits, and moderate alcohol intake is the main approach for reducing morbidity and mortality by chronic diseases1. A healthy lifestyle may
substan-tially reduce the risk of early death1, and the burden of
cardiovascular diseases2-4. The reduction in the relative
risk of cardiovascular diseases could be proportional to the number of healthy lifestyle factors2,4,5.
However, the adherence to healthy lifestyles has de-creased in the past 18 years. In the United States, the observance of 5 healthy lifestyle factors by adults (FV intake, physical activity, healthy BMI, nonsmoking habits, and moderate alcohol intake) has fallen from 15% to 8%, according to the National Health and Nu-trition Examination Survey results from 1988-1994 This work is licensed under a Creative Commons
and 2001-20066. In 20 European countries, only 5.8%
of adults report adherence to 5 healthy lifestyle factors (FV intake, physical activity, non-smoking habits, mod-erate alcohol intake, and good sleep quality)7. In Brazil,
the 2013 National Health Survey has shown that 37.3% of the Brazilian population eat 5 or more FV servings a day, 22.5% practice leisure time physical activity, 14.5% currently smoke, and 13.7% report alcohol abuse8.
Environmental policy interventions hold promise to promote healthy habits because they are designed to influence large groups, even entire populations. Exam-ples are community gardens, media campaigns, public parks and walking routes often located close to popu-lation centers, which provide opportunities for physical activity and policies to promote a healthy diet9,10,11.
A two-armed randomized controlled trial conduct-ed in China involving a lifestyle intervention program was able to improve the implementation of health pro-moting behaviors (diet, physical activity levels) in
pa-tients with metabolic syndrome12. Another study
cov-ering a healthy lifestyle program with 645 women from socio-economic disadvantaged communities in Aus-tralia identified weight loss after 1 year13. A study with
individuals who attended a primary healthcare service in Sweden detected that the promotion of a healthy lifestyle, including physical activities, was associated with lower risk of cardiovascular events (12%), cardio-vascular deaths (21%) and all-cause deaths (17%) after two decades14.
People in countries with high social inequalities, such as Brazil, have fewer opportunities for adopting a healthy lifestyle15. Brazil has invested in its Unified
Health System, especially in Primary Health Care ser-vices such as the Health Academy Program (Programa Academia da Saúde, PAS, in Portuguese) to encourage the acquisition and the adherence to healthy lifestyles. The program focuses on building appropriate facilities for physical activities, and offering disease prevention and health education at no charge16. PAS units consist
of a standardized built structure where guided physical activity classes, health promotion, food and nutrition education, artistic and cultural practices, and other actions are offered at no cost, operating with proper equipment and qualified professionals17.
Even though the adherence to healthy lifestyle fac-tors is an important health indicator, to the best of our knowledge, it hasn’t been performed any studies to as-sess the association between time of participation in public health promotion services and the adherence to
healthy lifestyle factors. Additionally, we haven’t found any information about the prevalence of a healthy life-style in developing countries.
This study aims to analyze the prevalence of adher-ence to healthy lifestyle factors according to the time of participation in PAS. We hypothesize that a longer participation in this program is associated with the ad-herence to higher numbers of healthy lifestyle factors by its users.
Methods
This cross-sectional study evaluated baseline data (2013-2014) from a randomized controlled commu-nity trial. The study was carried out with a representa-tive sample of PAS in Belo Horizonte, Brazil.
PAS is present in almost half of Brazilian cities, with 2,010 working units and 1,811 units under con-struction in 201718. In 2019 there were 78 PAS units,
preferably located at socially vulnerable areas, which serve a total of 19,000 individuals. Most PAS users are low-income women, with a high prevalence of obesity and unhealthy eating habits19. The predominant
activ-ities of PAS in Belo Horizonte are supervised group-based physical activity sessions, offered three times a week for 60 minutes each.
The sampling process was carried out in November 2012, and all the 50 PAS units that were operating in Belo Horizonte in this year were initially considered. The inclusion criteria were: being located in an area of medium or high/very high vulnerability (priority neighborhoods for PAS implementation in the munic-ipality), and not having participated in food and nutri-tion research two years before (to reduce informanutri-tion bias). Units that had participated in food and nutrition research in the past 2 years (n = 2) or were located in less vulnerable areas (n = 6) were excluded. Therefore, 42 units were eligible for sampling individuals22.
Sampling was performed, stratified by the nine ad-ministrative regional units of the municipality. In each of the nine administrative districts of the city, two PAS units were randomly selected; thus, 18 PAS units par-ticipated in this study22. The units were paired according
to vulnerability, based on the Health Vulnerability In-dex (a composite inIn-dex that covers aspects of sanitation, housing, education, income, and health. Higher values indicate high vulnerability and are intended to highlight epidemiological inequalities of distinct social groups)20.
In the sampling process, three different data sources were used: 1) registered users, meaning those who are
frequent or were temporarily removed, according to in-formation obtained from the PAS management data; 2) frequent users, meaning those who are frequent us-ers, according to the local service coordinators; and 3) users identified randomly in the PAS units by the re-search team. The total number corresponded to 3.763 eligible individuals.22
Inclusion criteria for study participants were: being 20 years or older, regularly attending the sampled PAS unit in the previous month (according to the daily at-tendance records available in the units), provided they have given written informed consent. Pregnant women and individuals with cognitive impairments were exclud-ed. All eligible users were invited to participate in the study (n = 3,763), and 3,414 (90.7%) were interviewed, with 237 (6.3%) exclusions and 112 (3.0%) refusals22.
To verify sample representativeness, sociodemo-graphic data of all units (n = 50) were compared to those of the sample (n = 18). Such results indicated that the sample represented the total with a confidence level of 95%. Details of the sampling process and re-cruitment of participants are available elsewhere 21,22.
Face-to-face data collection was performed at the PAS units by trained, non-blinded nutrition under-graduate students, nursing masters and doctoral stu-dents, registered dietitians and health professionals. A pilot test identified the adequacy of the research instru-ments for the population. Further details about data collection can be found in a previous publication21,22.
FV intake, practice of physical activity, current smoking status, and current alcohol intake were assessed through questionnaires, while weight and height were measured in order to calculate participant’s BMI23,24.
FV intake was assessed using questions adapted from the National Risk Factor Surveillance System for Chronic Diseases and validated for this study25.
Participants were asked about how often they ate fruit (excluding fruit juices) and vegetables (excluding po-tatoes, yams and cassava). Six frequency possibilities were offered: less than once a month or never; up to 3 times a month; 1-2 days a week; 3-4 days a week; 5-6 days a week; daily (including weekends). Usual serving sizes were specified (pieces or slices of fruit, and ta-blespoons or serving spoons of vegetables). Vegetable intake was assessed with the help of kitchen utensils, and the number of servings was subsequently calculat-ed according to prcalculat-edefincalculat-ed criteria.
Participants were asked about frequency and du-ration of physical activity. A composite variable was
created, based on the following questions: “How many
days a week do you usually practice physical activity or sports?”, and “On the days you exercise, how long does that activity last?”. These questions were related to
physi-cal activity in general (inside or outside the PAS). To calculate the total time of weekly physical activity, the number of active days per week was multiplied by the activity time in minutes.
Body mass index (BMI) was calculated as the weight measurement in kilograms divided by the square of the height measurement in meters23. Weight
was measured with a calibrated digital scale, with an accuracy of 0.1 kg. Height was measured using a stadi-ometer with a fixed vertical backboard and adjustable headboard, with an accuracy of 0.1 cm. Weight and height were measured with individuals wearing light clothing and barefoot, without accessories, and with empty pockets. Face-to-face data collection was per-formed at the PAS units, before or after the activities offered by the service.
Participants were asked about their current habits of smoking (yes or no) and alcohol intake. A nonsmok-er was defined as someone who reported themselves as such at the time of data collection. Frequency of alco-hol intake was measured in 5 categories: never, almost never (less than once a month), monthly, weekly, or daily; categories “never” and “almost never” were recat-egorized as “no alcohol intake”.
The following characteristics were considered as healthy lifestyle factors: consuming 5 or more daily FV servings; engaging in physical activity for at least 180 minutes/week (according to the physical activity prac-tice recommended at PAS units - three times a week for 60 minutes); not being underweight or overweight (18.5kg/m² ≥ BMI ≤ 24.9kg/m²); being non-smok-er and non-alcohol drinknon-smok-er19. The composite “healthy
lifestyle” variable was expressed as the sum of healthy lifestyle factors, in a range from 0-5.
The time of participation in PAS was calculated as the interval between data collection and the date when the participant joined the service. The sample was split into quartiles according to the total time of participa-tion (years).
Demographics and health data were collected. De-mographics included sex, age, educational attainment (years), marital status (single, married, divorced, wid-owed), employment status (housewife, retired, unem-ployed, employed), and economic classification accord-ing to the Brazilian Economic Classification Criteria26.
Health conditions were assessed by self-reported diagnosis of hypertension, diabetes, and dyslipidemia. Participants self-rated their health on a 5-point scale: very good, good, fair, poor, or very poor.
Participants were described according to the number of healthy lifestyle factors and their time of participation in PAS. Descriptive statistics were calculated (means, standard deviations, and percentages) stratified by the time of participation in the health service (quartiles).
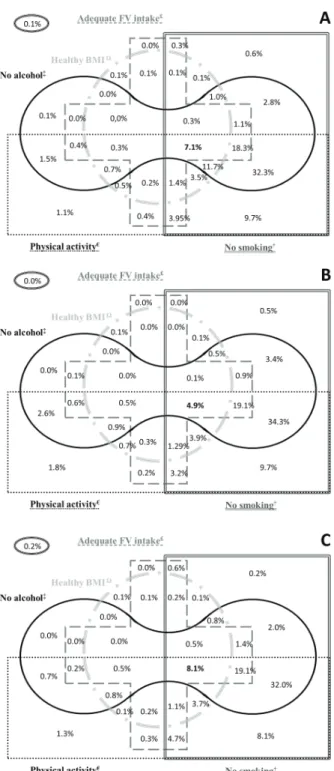
The coexistence of healthy lifestyle factors was graphically represented in Venn diagrams. This type of diagram is made of geometrical shapes that overlap to demonstrate the co-occurrence of selected character-istics, and the logical relationships among them. Each shape in a Venn diagram represents one characteristic; intersections between shapes demonstrate all possible combinations of characteristics and their frequencies in the sample. Therefore, this diagram makes it possible to describe the prevalence of healthy lifestyle factors and their combinations. The Venn diagrams were creat-ed in the Microsoft Office Excel software.
Chi-square test and linear regression models were used to verify if participants’ characteristics were asso-ciated with the number of healthy lifestyle factors and the time of participation in PAS.
Logistic regression models were used to evaluate the relationship between time of participation in PAS and the presence of each healthy lifestyle factor. The lowest quartile of time was used as the reference cat-egory to estimate ORs and 95% confidence intervals. To calculate P for linear trend, time of participation in PAS was introduced as a continuous variable. Models were first estimated without adjustments.
Multivariate models were adjusted for sex, age, education, marital status, Brazilian Economic Clas-sification Criteria, occupation, self-reported diabetes, self-reported hypertension, and self-rated health, ex-cept for the model with adequate BMI as the outcome that was not adjusted by BMI. The variables that pre-sented a value of p<0.20 in the univariate analysis, bi-ological plausibility or scientific support were inserted in multivariate models.
The analyses were performed with the statistical package Stata/SE version 14.0, and statistical signifi-cance was set at 5%.
This study was carried out according to the guide-lines laid down in the Declaration of Helsinki, and all the procedures involving human subjects were approved by the University’s and City Hall’s
Insti-tutional Review Boards (0537.0.0203.000-11 and 0537.0.0203.410-11A). The randomized controlled community trial was recorded in the Brazilian Registry of Clinical Trials (RBR-9h7ckx).
Results
We interviewed 3,414 individuals. Most were women, middle-aged, married, overweight, with low schooling, low income, and self-reported hypertension. For the whole sample, 2.1% did not have any healthy lifestyle factors or had only one, and 7.1% had all of them. The main baseline characteristics of participants are pre-sented in Table 1.
Individuals in the fourth quartile of time in PAS were more likely to be housewives or retired, and to have hypertension or dyslipidemia. They also had the highest age, if compared to those in the first quartile. In addition, they had a lower level of education and a lower BMI (Table 1).
The number of healthy lifestyle factors varied ac-cording to the time in PAS. For individuals in the high-est quartile of time in the program (3.5 years), 8.1% had all the healthy lifestyle factors while only 4.9% in the lowest quartile of time (0.2 years) had all of them. Users who had been in the service for the longest time had higher prevalence of adequate FV intake, healthy BMI, and were non-smokers (Table 2).
The most common combinations of healthy lifestyle factors were sufficient physical activity, no smoking, and no alcohol intake (32.3%), followed by adequate FV intake, sufficient physical activity, no smoking, and no alcohol intake (18.3%) - Figure 1.
In the multivariate models, participants with the longest time in PAS had higher chances of having a healthy BMI and being non-smokers, compared to those who had been in the service for less time (Table 3).
Discussion
The prevalence of healthy lifestyle factors in PAS was low, but still higher than in other contexts6,27. The
re-sults suggest that adherence to healthy lifestyle factors can increase with time of participation in this health promotion service. PAS seems to favor positive chan-ges in body mass index and smoking habits.
Low adherence to healthy lifestyle factors (i.e., a healthy diet, physical activity, healthy BMI, no smok-ing, moderate alcohol intake, quality sleep) is observed throughout the world. In the United States, only 1.7% of adults with self-reported hypertension reported
adher-ence to adequate FV intake, healthy weight,
non–smok-ing habits, and moderate alcohol intake27. Data from the 2013 Behavioral Risk Factor Surveillance (n = 412 942) showed that only 7.7% of adults reported adherence to
Table 1 – Characteristics of participants according to the time of participation in the PAS (n = 3,414). Belo Horizonte, Brazil, 2013-2014.
Characteristics Total Quartile of total time in PAS
1 2 3 4 p valuea
Number of participants 3 414 855 873 834 852
Time in PAS (years) 1.5±7.8 0.2±0.2 1.0±0.2 1.9±0.3 3.5±0.6 < 0.001
Sex (%) 0.127 Female 88.1 87.1 87.1 88.7 89.3 Male 11.9 12.9 12.9 11.3 10.7 Age (years) 56.7±11.8 53.4±12.7 57.8±12.0 58.4±10.9 59.2±10.1 < 0.001 Education (years) 7.3±4.7 8.0±4.2 7.5±4.1 6.9±4.2 6.5±3.8 < 0.001 Marital status (%) 0.699 Married 61.6 60.7 59.3 63.5 62.9 Divorced 8.3 10.4 8.9 7.3 6.5 Single 14.2 15.8 15.6 13.4 11.7 Widowed 15.9 13.1 16.2 15.7 18.9 Occupation (%) < 0.001 Housewife 28.7 26.9 27.5 28.7 31.7 Retired 36.7 29.6 38.1 40.2 39.0 Unemployed 2.0 4.6 1.8 0.8 0.7 Employed 32.6 38.9 32.5 30.3 28.6 Economic classificationb (%) 0.145 A/B 29.5 30.3 31.5 29.4 26.9 C 55.0 54.7 52.9 55.4 57.1 D/E 15.6 15.0 15.6 15.2 16.0 BMI (kg/m2) 27.9±4.9 28.5±5.3 27.8±4.6 27.7±5.0 27.6±4.6 < 0.001 Diabetes (%) 16.9 16.8 15.8 17.5 17.6 0.573 Hypertension (%) 53.2 48.1 52.4 54.7 57.6 < 0.001 Dyslipidemia (%) 43.7 37.7 44.1 45.8 49.0 < 0.001 Self-rated health (%) 0.142 Very good/good 71.7 67.8 73.2 75.3 70.5 Fair/poor/very poor 28.3 32.2 26.8 24.7 29.5
BMI = body mass index. PAS = Programa Academia da Saúde; a = Chi-square test for trend (categorical variables) and linear regression models (continuous variables) across number of healthy lifestyle factors; b = Brazilian Economic Classification Criteria.
Table 2 – Healthy lifestyle factors according to the time of participation in the PAS (n = 3,414). Belo Horizonte, Brazil, 2013-2014.
Healthy lifestyle Total Quartile of total time in PAS
1 2 3 4 p valuea
Adequate FV intake c (%) 34.2 31.5 34.4 33.8 37.0 0.021
Physical activity (minutes/week) 209±79.6 208±79.0 210±83.5 209±76.2 211±79.4 0.508
Healthy BMI (%) 27.2 23.7 27.5 28.7 28.9 0.011
No smoking (%) 94.4 92.2 94.4 95.6 95.3 0.003
No alcohol (%) 77.8 77.9 74.5 80.1 78.8 0.259
Number of healthy lifestyle factors (%)
< 0.001 0 - 1 2.1 2.3 2.3 1.6 1.9 2 15.5 17.0 17.1 15.9 12.1 3 43.2 44.5 42.7 41.5 44.2 4 32.1 31.3 30.5 33.0 33.8 5 7.1 4.9 7.4 8.0 8.1
FV = fruit and vegetables. PAS = Programa Academia da Saúde; a = Chi-square test for trend (categorical variables) and linear regression models (continuous variables) across number of healthy lifestyle factors; c = ≥ 5 servings/day.
adequate FV intake, physical activity, non-smoking hab-its, moderate alcohol intake, and adequate sleep. In the same study, 77% reported adherence to three of those five factors. The most reported factors were moderate al-cohol intake (82.1%) and non–smoking habits (81.8%), while only 17.2% reported adequate FV intake28.
In 20 European countries, the most commonly re-ported healthy lifestyle factors were moderate alcohol intake (89.1%), sleep quality (83.1%), and non-smok-ing habits (75.7%). Adequate FV intake was report-ed by 21.0% of adults7. In 52 low and middle-income
countries (2002–2003), 78.0% of subjects had an insuf-ficient FV intake29. Worldwide, in 2013, 31% of adults
were insufficiently active, and there were about 1 bil-lion smokers. Moreover, in 2015, a total of 603.7 mil-lion adults were obese30. Our results follow the same
overall patterns, except for adequate FV intake, which was reported by approximately 30% of the sample.
A healthy lifestyle is associated with better health and a lower risk of diseases. A prospective cohort study with 37634 North American women demonstrated a direct association between a higher number of healthy lifestyle factors and a decrease in the risk of total and ischemic strokes with mild, moderate and severe func-tional outcomes31. An analysis of three cohorts and one
cross-sectional study showed that a healthy lifestyle (a healthy diet, regular physical activity, adequate weight, and no current smoking habits) was associated with a reduced risk of coronary events, regardless of genet-ic risk32. Data from the 2013 Behavioral Risk Factor
Surveillance have shown that the adoption of a healthy lifestyle was associated with better health, lower rates of chronic disease, and better access to health care28.
We believe that the time of participation in the PAS may increase adherence to a healthy lifestyle, mainly maintaining a normal weight and nonsmoking status. The healthy BMI prevents obesity and reduces the risk of diabetes, cardiovascular diseases, and can-cer33. Smoking is a risk factor for cancer, cardiovascular
disease, and mortality; nonsmoking status or smoking cessation has been associated with a reduction of these risks23,32. According to our results, PAS can be an
im-portant service in combating major health challenges: smoking and overweight .
PAS is a privileged place for the adoption and main-tenance of a healthy lifestyle. This is due to the high adherence of its users to the actions, the availability of a physical space, the presence of qualified health profes-sionals, especially from Primary Health Care, and the way of working that prioritizes health promotion. All
Table 3 – Associations between healthy lifestyle factors and time in PAS according to logistic regression models. Belo Horizonte, Brazil, 2013-2014.
Quartile of total time in PAS (years) a
1 2 3 4 p for trend Number of participants 855 873 834 852 Adequate FV intake Crude 1 (ref) 1.14 (0.93-1.39) 1.11 (0.91-1.36) 1.27 (1.04-1.56) 0.031 Adjustedb 1 (ref) 1.02 (0.82-1.26) 0.98 (0.79-1.22) 1.13 (0.91-1.41) 0.313 Physical activity Crude 1 (ref) 0.69 (0.47-1.01) 0.73 (0.49-1.07) 0.87 (0.59-1.31) 0.641 Adjustedb 1 (ref) 0.66 (0.44-0.98) 0.73 (0.48-1.10) 0.89 (0.59-1.37) 0.842 Healthy BMI Crude 1 (ref) 1.22 (0.98-1.51) 1.29 (1.04-1.60) 1.30 (1.05-1.62) 0.011 Adjustedc 1 (ref) 1.25 (1.00-1.56) 1.38 (1.10-1.74) 1.43 (1.14-1.80) 0.001 No smoking Crude 1 (ref) 1.43 (0.98-2.10) 1.83 (1.21-2.77) 1.73 (1.15-2.59) 0.003 Adjustedb 1 (ref) 1.32 (0.88-1.96) 1.74 (1.12-1.70) 1.62 (1.06-2.49) 0.012 No alcohol Crude 1 (ref) 0.83 (0.66-1.03) 1.14 (0.90-1.44) 1.05 (0.84-1.32) 0.190 Adjustedb 1 (ref) 0.82 (0.65-1.04) 1.10 (0.86-1.41) 0.95 (0.74-1.21) 0.697
BMI = body mass index; FV = fruit and vegetables; PAS = Programa Academia da Saúde; a = All values are ORs; 95% confidence intervals in parentheses unless otherwise indicated; b = Adjusted for sex, age, education, marital status, Brazilian Economic Classification Criteria, occu-pation, body mass index, diabetes, hypertension, and self-rated health; c = Adjusted for sex, age, education, marital status, Brazilian Economic Classification Criteria, occupation, diabetes, hypertension and self-rated health.
of which culminate in the construction and strength-ening of the partnership between users, professionals, and the community17,34.
As seen, studies have shown associations between
adherence to healthy lifestyle factors and a lower risk of morbidity and mortality1,2,5,24,29. To the best of our
knowledge, the association between time of participa-tion in a health promoparticipa-tion service and the adherence to healthy lifestyle factors has not been extensively ex-plored by the literature. However, PAS and other public physical activity programs can be appropriate settings for health promotion and adoption of healthy lifestyle factors. Despite that, only 20.1% of Brazilian adults are aware of these programs, and only 9.7% participate in them, with a higher prevalence of participation in the most developed regions35.
Our results demonstrate that an extended time of participation in PAS can increase adherence to healthy lifestyle factors, suggesting the effectiveness of this public health promotion service. Probably, individuals who participated in PAS for longer periods of time are exposed to additional incentives to adopt or maintain healthy lifestyles, besides increasing physical exercise. A cross-sectional study in a Brazilian Primary Health Care service showed that 40.8% of the subjects received counseling from healthcare professionals, and 50.9% of them demonstrated adherence to healthy lifestyle fac-tors. Furthermore, adherence to counseling was 55% higher between Primary Health Care users who also participated in PAS36.
A combination of multiple actions addressing healthy lifestyle factors may decrease the risk of chron-ic diseases24. Examples of these potential actions are
public spaces for physical activity and counseling about healthy eating, like the PAS. In addition, the taxation of tobacco and ultra-processed foods, and reduction in marketing of ultra-processed foods are important11,16,24.
Strengths of this study include the large sample size and the representativeness of a public primary health care service – a ‘real life’ setting. These results stress the importance of continued public efforts for promoting healthy lifestyle factors: improving diets and the level of physical activity, reducing the prevalence of obesity, smoking, and alcohol misuse.
Some limitations may be observed. First, our results require caution regarding external validity. This sample could be more health conscious and the prevalence of healthy lifestyle factors may be even lower in the gen-eral population. In addition, the definition of a healthy lifestyle has varied and hinders comparison. However, the most frequently investigated factors are measures of diet, physical activity, overweight or obesity, smok-ing, and alcohol use, which were analyzed in this study.
Figure 1 – Coexistence of healthy lifestyle factors among PAS par-ticipants (n = 3.414). Belo Horizonte, Brazil, 2013-2014.
BMI = body mass index; FV = fruit and vegetables; Ω = healthy BMI (18.5kg/m²≥BMI≤24.9kg/m²); £ = ≥5 daily servings of fruit and vegetables; ‡ = no alcohol intake; € = engaging in physical activ-ity for ≥180 minutes/week, † = no smoking
We conclude that PAS is an important strategy for health promotion in the Brazilian Health Public System. Participating in PAS seems to favor positive changes in body mass index and smoking habits. So, that should be encouraged worldwide, especially in de-veloping countries. However, further studies in differ-ent contexts are necessary to confirm our findings.
Conflict of interest
The authors declare no conflict of interest.
Funding
This work was supported by the Fundação de Amparo à Pesquisa de Minas Gerais (project and a graduate studies scholarship for MRCR); Conselho Nacional de Desenvolvimento Científico e Tecnológico (project and a research productivity scholarship to the researcher ACSL) and Coordenação de Aperfeiçoamento de Pes-soal de Nível Superior - Brasil (CAPES) - Finance Code 001. The funders had no role in the study design, collection, analysis and interpretation of data, or writing and submission of this article.
Author’s contributions
Mendonça RD, analysis and interpretation of data;statistical analy-sis; drafting of manuscript; data collection and input; review of the final version and approval for publication. Lopes MS, analysis and interpretation of data; drafting of manuscript; data collection and input; review of the final version and approval for publication. Car-valho MCR, drafting of manuscript; data collection and input; re-view of the final version and approval for publication. Freitas PP, analysis and interpretation of data;drafting of manuscript; data col-lection and input; review of the final version and approval for publi-cation. Lopes ACS, conception and design; critical review of ma-nuscript; obtaining funding; administrative, technical and material support; review of the final version and approval for publication.
Acknowledgments
The authors thank the Municipal Health Department of Belo Horizonte for enabling the contact and research with the centers of the Health Academy Program.
References
1. Ford ES, Bergmann MM, Boeing H, Li C, Capewell S.
Healthy lifestyle behaviors and all-cause mortality among adults in the United States. Prev Med. 2012;55(1):23-7.
2. Lv J, Yu C, Guo Y, Bian Z, Yang L, Chen Y, et al. Adherence to healthy lifestyle and cardiovascular diseases in the Chinese population. J Am Coll Cardiol. 2017;69(9):1116–25.
3. Akesson A, Larsson SC, Discacciati A, Wolk A.
Low-risk diet and lifestyle habits in the primary prevention of myocardial infarction in men: a population-based prospective cohort study. J Am Coll Cardiol. 2014;64(13):1299–306.
4. Ford ES, Bergmann MM, Kröger J, Schienkiewitz A,
Weikert C, Boeing H. Healthy living is the best revenge: findings From the European Prospective Investigation into Cancer and Nutrition–Potsdam Study. Arch Intern Med. 2009;169(15):1355-62.
5. Gaziano TA. Lifestyle and Cardiovascular Disease: More Work to Do. J Am Coll Cardiol. 2017;69(9):1126–28.
6. King DE, Mainous AG, Carnemolla M, Everett CJ.
Adherence to healthy lifestyle habits in US adults, 1988-2006. Am J Med. 2009;122(6):528–34.
7. Marques A, Peralta M, Martins J, Loureiro V, Almanzar PC, Matos MG. Few European adults are living a healthy lifestyle. American Journal of Health Promotion. 2019;33(3):391-98.
8. Malta DC, Andrade SSCA, Stopa SR, Pereira CA,
Szwarcwald CL, Silva Júnior JB, et al. Brazilian lifestyles: National Health Survey results, 2013. Epidemiol. Serv. Saúde. 2015;24(2):217-26.
9. Carney PA, Hamada JL, Rdesinski R, Sprager L, Nichols KR, Liu BY, et al. Impact of a community gardening project on vegetable intake, food security and family relationships: a community-based participatory research study. J Community Health. 2012;37(4):874-81.
10. da Silva LS, Cotta RM, Rosa CdO. Health promotion and primary prevention strategies to fight chronic disease: a systematic review. Rev Panam Salud Publica. 2013;34(5):343-50.
11. World Health Organization. 2015. Measuring the
age-friendliness of cities: a guide to using core indicators. WHO, Geneva, Switzerland; 2015. [citado em 2020 mai 25]. Disponível em: https://www.who.int/ageing/publications/ measuring-cities-age-friendliness/en/.
12. Zheng X, Yu H, Qiu X, Chair SY, Wong EM, Wang
Q. The effects of a nurse-led lifestyle intervention program on cardiovascular risk, self-efficacy and health promoting behaviours among patients with metabolic syndrome: Randomized controlled trial. Int J Nurs Stud. 2020;109:103638. [published online ahead of print].
13. Kozica SL, Lombard CB, Harrison CL, Teede HJ. Evaluation of a large healthy lifestyle program: informing program implementation and scale-up in the prevention of obesity. Implement Sci. 2016;11(1):151.
14. Journath G, Hammar N, Vikström M, et al. A Swedish
primary healthcare prevention programme focusing on promotion of physical activity and a healthy lifestyle reduced cardiovascular events and mortality: 22-year follow-up of 5761 study participants and a reference group. Br J Sports Med. 2020;2019:101749. . [published online ahead of print].
15. Barros MBA, Lima MG, Medina LPB, Szwarcwald CL,
Malta DC. Social inequalities in health behaviors among adults: National Health Survey, 2013. Int J Equity Health. 2016;15:148.
16. Costa BVL, Oliveira CL, Lopes ACS. Food environment of fruit and vegetables in the territory of the Health Academy Program. Cad Saude Publica. 2015;31(Suppl1):159–69.
17. Lopes ACS, Freitas PP, Lopes MS, Mendonça RD. Programa Academia da Saúde: Principais Resultados no campo da Alimentação e Nutrição. In: Malta DC, Mielke GI, Costa NCP (org). Pesquisas de avaliação do Programa Academia da Saúde. 1. ed. Florianópolis-SC: Sociedade Brasileira de Atividade Física e Saúde; 2020. p.98-126.
18. Ministério da Saúde. Panorama Nacional de Implementação do Programa Academia da Saúde. Monitoramento nacional da gestão do Programa Academia da Saúde. Brasília (Brasil): Ministério da Saúde; 2017. p. 62. [citado em 2020 abr 8]. Disponível em: http://bvsms.saude.gov.br/bvs/publicacoes/ panorama_academia_saude_monitoramento_programa.pdf.
Quote this article as:
Mendonça RD, Lopes MS, Carvalho MCR, Freitas PP, Lopes ACS. Adherence to healthy lifestyles in the Programa Academia da Saúde. Rev Bras Ativ Fís Saúde. 2020;25:e0127. DOI: 10.12820/rbafs.25e0127
19. Prefeitura de Belo Horizonte. Academia da Cidade. Belo Horizonte, 2019. [citado em 2019 jul 4]. Disponível em: <https://prefeitura.pbh.gov.br/saude/informacoes/atencao-a-saude/promocao-da-saude/academia-da-cidade>.
20. Prefeitura de Belo Horizonte. Estatística e Indicadores: mapa de Índice de Vulnerabilidade Social. Belo Horizonte, 2000. [citado em 2011 set 14]. Disponível em: <http://portalpbh.pbh.gov.br/pbh/ecp/comunidade. d o ? e v e n t o = p o r t l e t & p I d P l c = e c p Ta x o n o m i a M e n u P o r t a l & a p p = e s t a t i s t i c a s e i n d i c a d o r e s &tax=25583&lang=pt_BR&pg=774 2&taxp=0&>.
21. Menezes MC, Mendonça RD, Ferreira NL, Guimarães
LMF, Lopes ACS. Promoting fruit and vegetable consumption: methodological protocol of a randomized controlled community trial. Contemp Clin Trials Commun. 2018;10:131–6.
22. Menezes MC, Costa BVL, Ferreira NL, Freitas PP,
Mendonca RD, Lopes MS, et al. Methodological course of a community controlled trial in health care services: a translational epidemiological research on Nutrition. Demetra. 2017;12:1203–22.
23. World Health Organization. Obesity: preventing and
managing the global epidemic. Report of a WHO Consultation. WHO Technical Report Series 894. WHO, Geneva, Switzerland; 2000. [citado em 2020 abr 8]. Disponível em: https://www.who.int/nutrition/publications/ obesity/WHO_TRS_894/en/
24. World Health Organization. Burden: mortality, morbidity and risk factors. in: Global status report on noncommunicable diseases 2010. WHO, Geneva, Switzerland; 2011. [citado em 2020 mar 20]. Disponível em: https://www.who.int/nmh/ publications/ncd_report2010/en/.
25. Lopes MS, Santos LC, Lopes ACS, Abreu, MNS. Comparison between two assessment tools for fruit and vegetable intake relative to the 24-h recall. Nutrition. 2017;38:34-40.
26. Associação Brasileira de Empresas de Pesquisa. 2013. Brazilian Economic Classification Criteria; 2013. [citado em 2017 em jul 12]. Disponível em: http://www.abep.org/ criterio-brasil.
27. Fang J, Moore L, Loustalot F, Yang Q, Ayala C, et al. Reporting of adherence to healthy lifestyle behaviors among hypertensive adults in the 50 states and the District of Columbia, 2013. J Am Soc Hypertens. 2016;10(3):252-62.
28. Adams ML, Katz DL, Shenson D. A healthy lifestyle
composite measure: significance and potential uses. Preventive Medicine. 2016; 84:41-47.
29. Hall JN, Moore S, Harper SB, Lynch JW. Global variability in fruit and vegetable consumption. Am J Prev Med. 2009;36(5):402-409.
30. GBD 2015 Obesity Collaborators. Health Effects of
Overweight and Obesity in 195 Countries over 25 Years. N Engl J Med. 2017;377(1):13-27.
31. Rist PM, Buring JE, Kase CS, Kurth T. Healthy lifestyle and functional outcomes from stroke in women. Am J Med. 2016;129(7):715-24.
32. Khera AV, Emdin CA, Drake I, Natarajan P, Bick AG, Cook NR et al. Genetic risk, adherence to a healthy lifestyle, and coronary disease. N Engl J Med. 2016;375(24):2349-58.
33. World Health Organization & Food and Agriculture
Organization of the United Nations. Diving commitment for nutrition within the UN Decade of Action on Nutrition. Policy Brief. WHO/NMH/NHD/17.11, FAO/ CA1340EN/1/09.18; 2018 [citado em 2020 mar 20]. Disponível em: https://www.who.int/publications/i/item/ WHO-NMH-NHD-17.11.
34. Silva KL, Sena RR, Matos JAV, Lima KMSV, Silva PM.
Acesso e utilização da Academia da Cidade de Belo Horizonte: perspectiva de usuários e monitores. Rev Bras Ativ Fís. 2014;19(6):700-10.
35. Mussi RFF, Figueiredo ACM, Queiroz BM, Petróski ED.
Conhecimento dos programas públicos de atividade física pelos adultos brasileiros: Pesquisa Nacional de Saúde. Rev. port. ciênc. desporto. 2017;17(S5A):169-80.
36. Toledo MTT, Abreu MN, Lopes ACS. Adherence to healthy ways of life through counselling by health care professionals. Rev Saúde Publica. 2013;47(3):540-48.
Received: 10/06/2020 Approved: 20/08/2020