DOI: http://dx.doi.org/10.5007/1980-0037.2014v16s1p55
original article
Licence Creative Commom
CC
RBCDH
1 Federal University of Santa Cata-rina, Graduate Program of Physical Education, Florianopolis, Santa Catarina, Brazil.
2 Pernambuco University, Gradua-te Program of Physical Education, Recife, Pernambuco, Brazil
Received: 11 January 2014 Accepted: 22 March 2014
Changes in lifestyle and self-rated health
among high school students: A prospective
analysis of the “Saúde na Boa” project
Mudanças no estilo de vida e na percepção da saúde
em estudantes do ensino médio: análise prospectiva do
projeto “Saúde na Boa”
Valter Cordeiro Barbosa Filho1
Kelly Samara Silva1
Cassiano Ricardo Rech1
Anísio Luiz Silva Brito2
Elusa Santina Antunes de Oliveira2
Markus Vinicius Nahas1
Abstract – Lifestyle characteristics can modify the self-rated health of young people, but additional prospective evidence is needed. his study examined the association be-tween changes in lifestyle and self-rated health among students. A secondary analysis of the “Saúde na Boa” project was performed, considering data from 984 students (14-24 years old, 56.9% girls) who were randomly selected from 20 public schools in Recife and Florianopolis, Brazil. Two sets of data 9-months apart were collected, and self-reported data about lifestyle characteristics (physical activity practices, TV watching time, dietary habits, alcohol and tobacco consumption, and sleep time) and self-rated health (poor, fair, good, very good and excellent) were obtained. Diferences in self-rated health between collections were categorized as negative changes, stable (no changes) or positive changes. Adjusted multinomial logistic regression analysis was used (p < 0.05). Ater adjustment for confounding variables, increasing the weekly frequency of active commuting to school (adjusted odds ratio [aOR] = 2.06) and intake of fruits/fruit juice (aOR = 1.81), as well as reducing the monthly frequency of alcohol consumption (aOR = 2.17), was signiicantly associated with positive changes in self-rated health. Consumption of sweets was also associated with stable self-rated health. In conclusion, our prospective evidence demon-strated that changes in lifestyle characteristics appear to be essential to ensure or generate positive self-rated health in youth.
Key words: Eating habits; Health status; Motor activity; Prospective studies; Young.
Resumo– O estilo de vida pode modiicar a percepção da saúde em jovens, porém evidências
INTRODUCTION
A relatively old concept from the World Health Organization (1946) emphasizes that health is “not merely the absence of disease but a state of
complete physical, mental and social well-being”1. Based on this
deini-tion, psychological measures such as self-rated health (i.e., self-assessment about a person’s own conditions and his/her current health status) have become objects of epidemiological studies as important as the
identiica-tion of physiological diseases2,3. here is evidence indicating that self-rated
health in youth4 and adulthood5,6 is inversely associated with morbidity
and mortality. hus, building positive self-ratings of health in earlier years can be an important step for assuring the present and future health status of a population.
By contrast, approximately 15% of the youth population of European
countries report negative self-rated health2. In the United States, the
esti-mate is approxiesti-mately 10%7, which is similar to the rate observed in
Brazil-ian adolescents8. here was a trend towards stabilization of self-rated health
in the European youth population from 2006 to 20102, but an increase
occurred among the North American young7. Brazil, a middle-income
country, experienced a slight increase in the proportion of young people
with negative self-rated health from 2003 to 2008 (from 9.3% to 10.0%)8.
herefore, studying health perceptions and their potential determinants is crucial to help plan and target interventions for the modiiable factors
that are associated with self-rated health in youth3,9.
Lifestyle factors, such as physical activity9-16, watching TV11, eating
habits10,16, substance abuse (e.g., alcohol and tobacco)10,13,17 and sleep time11,
have been associated with self-rated health among young people. However, most of this evidence has been obtained in cross-sectional studies, and they are limited in their ability to explore causal relationships between two variables. Limited longitudinal evidence has focused on the relationship be-tween lifestyle and other psychological components (e.g., mental well-being
and depression)18-21 or has assessed only self-rated health in adulthood12,15.
herefore, a study evaluating prospective changes in lifestyle factors and their role in self-rated health among young people is needed for targeting interventions to promote health and well-being in young populations.
hus, the present study prospectively examined the association between changes in lifestyle factors (physical activity, watching TV, eating habits, alcohol and tobacco consumption and sleep time) and self-rated health in a sample of Brazilian adolescents.
METHODOLOGICAL PROCEDURES
his study was a secondary and prospective analysis of data from a
rand-omized-controlled intervention entitled the “Saúde na Boa” project22. he
stud-ied at night in public schools from two Brazilian cities: Florianopolis (Santa Catarina), southern Brazil, and Recife (Pernambuco), northeastern Brazil.
Approximately two thousand youths were evaluated in March 2006 (aged 14-24 years) from 20 randomly selected schools (10 in each city, with 5 schools for the experimental group and 5 for the control group). he selection was stratiied by school size (small 200 students or less, medium 200-499 students, and large 500 students or more) and geographical loca-tion. Nine months ater baseline (December 2006), a new data collection wave was performed, with response rates of 45.9% (989 students assessed at follow-up). Detailed information about the characteristics of the cities involved, the target population and the sample selection procedure were
described in a previous publication22. Additionally, the dropout sample’s
demographic, socioeconomic and behavioral characteristics have been
analyzed in another manuscript in this supplement23. For the present study,
we considered students that had valid data for self-rated health, totaling a sample of 984 high school students. It was possible to detect a statistically signiicant odds ratio > 1.34 for watching TV (factor with higher exposure to positive change) and an odds ratio > 1.63 for tobacco consumption (fac-tor with lower exposure to positive change). For other lifestyle fac(fac-tors, the sample size could detect statistical signiicance for an odds ratio in this range. he prevalence of outcomes (positive change in self-rated health) in unexposed groups was 25.2% and 24.4% for watching TV and tobacco consumption, respectively. A conidence interval (CI) of 95% and a power of 80% was ixed in this estimate.
In March and December 2006, students answered the questionnaire
the “Saúde na Boa” project, which was previously validated24. he
ques-tionnaire included close answer items on physical activity practices, eating habits and other lifestyle factors (e.g., alcohol and tobacco consumption and sleep duration) based on the PACE+ questionnaire (Patient-Centered
Assessment and Counseling for Exercise Plus Nutrition)24. he
question-naire also included sections for personal and sociodemographic informa-tion, sedentary behaviors, body weight control and preventive behaviors. he instrument was applied in the classroom following previous in-structions. he application of standardized collection protocols in both cities was conducted by a properly trained team consisting of students and teachers of Physical Education and Nutrition.
Students answered the following question, “Overall, how would you rate your health?” Each student reported their health on a Likert scale with ive points (“poor,” “fair,” “good,” “very good” or “excellent”). he diference in responses between baseline and 9-month follow-up collection allowed for the generation of a score categorized as one of three levels: 1) negative change (e.g., from good to fair), 2) stable (not modiied), or 3) positive change (e.g., from very good to excellent).
he weekly frequency (days/week) of active commuting (walking/biking) to school and exercise for muscular strength/endurance was also evaluated. We evaluated the daily duration of TV viewing (hours/day) as a sedentary behavior factor. In the eating habits section, we considered the weekly frequency (days/week) of the consumption of fruits/fruit juice and sweet/ sot drinks. We also investigated the monthly frequency (days/month) of tobacco and alcohol consumption and the daily sleep duration (hours/day). For each lifestyle component, we calculated the diference in responses be-tween baseline and 9-month follow-up. he scores were grouped into three categories: decreased, stable or increased. We ordered the categories from the worst to the most favorable scenario for a healthy lifestyle outcome.
Demographic and socioeconomic variables were included as potential confounds: gender (boys and girls), age group (14-16 years, 17-19 years and 20-24 years), skin color (white and non-white), marital status (single or otherwise), occupation (work, volunteer or not working), residence with family (yes or no) and type of property (house, apartment/other). Nutritional status at follow-up was determined by calculating body mass index (body weight [kg]/height² [m²]) and its classiication according to
gender and age25.
Absolute and relative frequencies (with 95% CI) were used to describe the control variables, the lifestyle components, and self-rated health. We also showed the proportion of students in each lifestyle category and self-rated health change group. Multinomial logistic regression was used to calculate odds ratios for prospective changes in lifestyle and changes in self-rated health among students. A negative change in self-rated health was considered to be the outcome reference. For the exposure variables, the categories that represented the worst lifestyle changes (e.g., decrease in the frequency of weekly physical activity) were considered to be the exposure reference. Gender was not associated with changes in self-rated health and did not moderate the results when we performed these analyses using the entire sample. All analyses were adjusted for potential confounds (gender, age group, skin color, marital status, occupation, type of property, residence with family, nutritional status, situation in the intervention, city and self-rated health and lifestyle factor at baseline). All analyses were per-formed with Stata v. 11 (Stata Corp., College Station, TX, USA) considering a signiicance level of p < .05.
All procedures were approved by the Ethics Committee of the Federal
University of Santa Catarina (031/2005) and the Instituto Materno Infantil
de Pernambuco (587/2005). he negative consent term (“passive parental consent form”) of the parents or guardians of students under 18 years was obtained, as well as from students with 18 or more years.
RESULTS
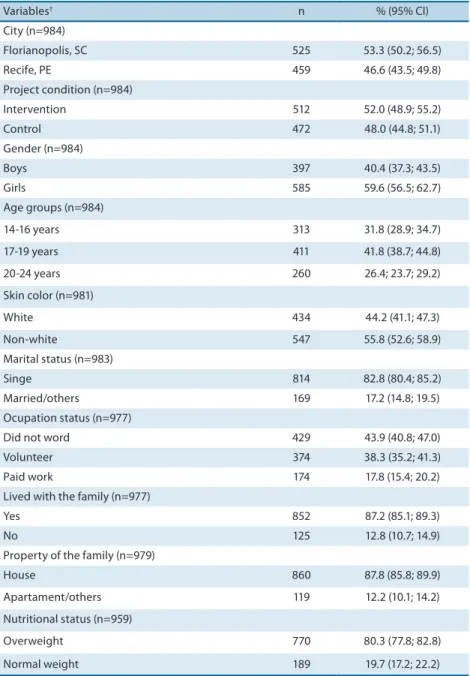
intervention schools and 48.0% were from control schools. he majority of the sample was female, aged 17-19 years, non-white, single, unemployed, living with his/her family and living in houses. Two out of ten students were overweight (Table 1).
Table 1. Baseline characteristics from the sample with valid data. (n=984).
Variables† n % (95% CI)
City (n=984)
Florianopolis, SC 525 53.3 (50.2; 56.5)
Recife, PE 459 46.6 (43.5; 49.8)
Project condition (n=984)
Intervention 512 52.0 (48.9; 55.2)
Control 472 48.0 (44.8; 51.1)
Gender (n=984)
Boys 397 40.4 (37.3; 43.5)
Girls 585 59.6 (56.5; 62.7)
Age groups (n=984)
14-16 years 313 31.8 (28.9; 34.7)
17-19 years 411 41.8 (38.7; 44.8)
20-24 years 260 26.4; 23.7; 29.2)
Skin color (n=981)
White 434 44.2 (41.1; 47.3)
Non-white 547 55.8 (52.6; 58.9)
Marital status (n=983)
Singe 814 82.8 (80.4; 85.2)
Married/others 169 17.2 (14.8; 19.5)
Ocupation status (n=977)
Did not word 429 43.9 (40.8; 47.0)
Volunteer 374 38.3 (35.2; 41.3)
Paid work 174 17.8 (15.4; 20.2)
Lived with the family (n=977)
Yes 852 87.2 (85.1; 89.3)
No 125 12.8 (10.7; 14.9)
Property of the family (n=979)
House 860 87.8 (85.8; 89.9)
Apartament/others 119 12.2 (10.1; 14.2)
Nutritional status (n=959)
Overweight 770 80.3 (77.8; 82.8)
Normal weight 189 19.7 (17.2; 22.2)
† Sample values in parentheses indicate the valid data for the respective variable.
95% CI = 95% conidence interval
Figure 1. Prevalence (95% conidence interval) of self-rated health at baseline, 9-months follow-up and changes between the two assessments among high school students. (n = 984).
† Diferences between baseline and 9-months follow-up were classiied as negative change (e.g., from good to
fair), stable or positive change (e.g., from very good to excellent).
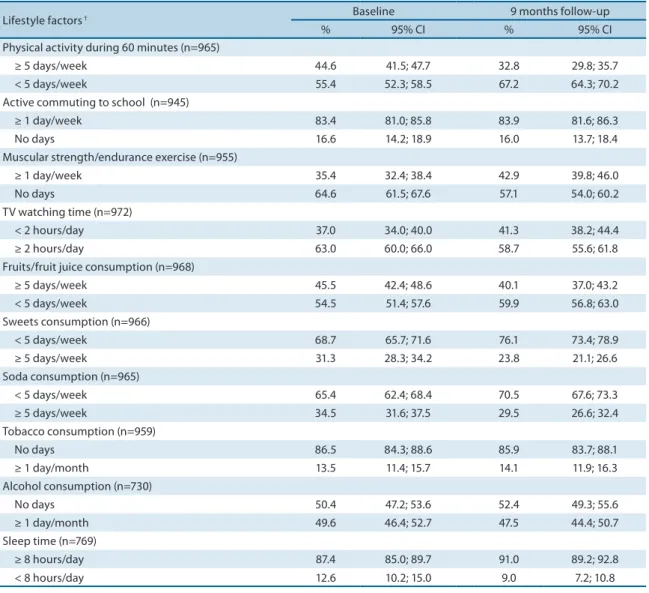
Table 2. Prevalence and 95% conidence interval of the lifestyle variables among high school students at baseline and 9-months follow-up. (n = 984).
Lifestyle factors † Baseline 9 months follow-up
% 95% CI % 95% CI
Physical activity during 60 minutes (n=965)
≥ 5 days/week 44.6 41.5; 47.7 32.8 29.8; 35.7
< 5 days/week 55.4 52.3; 58.5 67.2 64.3; 70.2
Active commuting to school (n=945)
≥ 1 day/week 83.4 81.0; 85.8 83.9 81.6; 86.3
No days 16.6 14.2; 18.9 16.0 13.7; 18.4
Muscular strength/endurance exercise (n=955)
≥ 1 day/week 35.4 32.4; 38.4 42.9 39.8; 46.0
No days 64.6 61.5; 67.6 57.1 54.0; 60.2
TV watching time (n=972)
< 2 hours/day 37.0 34.0; 40.0 41.3 38.2; 44.4
≥ 2 hours/day 63.0 60.0; 66.0 58.7 55.6; 61.8
Fruits/fruit juice consumption (n=968)
≥ 5 days/week 45.5 42.4; 48.6 40.1 37.0; 43.2
< 5 days/week 54.5 51.4; 57.6 59.9 56.8; 63.0
Sweets consumption (n=966)
< 5 days/week 68.7 65.7; 71.6 76.1 73.4; 78.9
≥ 5 days/week 31.3 28.3; 34.2 23.8 21.1; 26.6
Soda consumption (n=965)
< 5 days/week 65.4 62.4; 68.4 70.5 67.6; 73.3
≥ 5 days/week 34.5 31.6; 37.5 29.5 26.6; 32.4
Tobacco consumption (n=959)
No days 86.5 84.3; 88.6 85.9 83.7; 88.1
≥ 1 day/month 13.5 11.4; 15.7 14.1 11.9; 16.3
Alcohol consumption (n=730)
No days 50.4 47.2; 53.6 52.4 49.3; 55.6
≥ 1 day/month 49.6 46.4; 52.7 47.5 44.4; 50.7
Sleep time (n=769)
≥ 8 hours/day 87.4 85.0; 89.7 91.0 89.2; 92.8
< 8 hours/day 12.6 10.2; 15.0 9.0 7.2; 10.8
† Values in parentheses indicate valid data for the respective lifestyle variable.
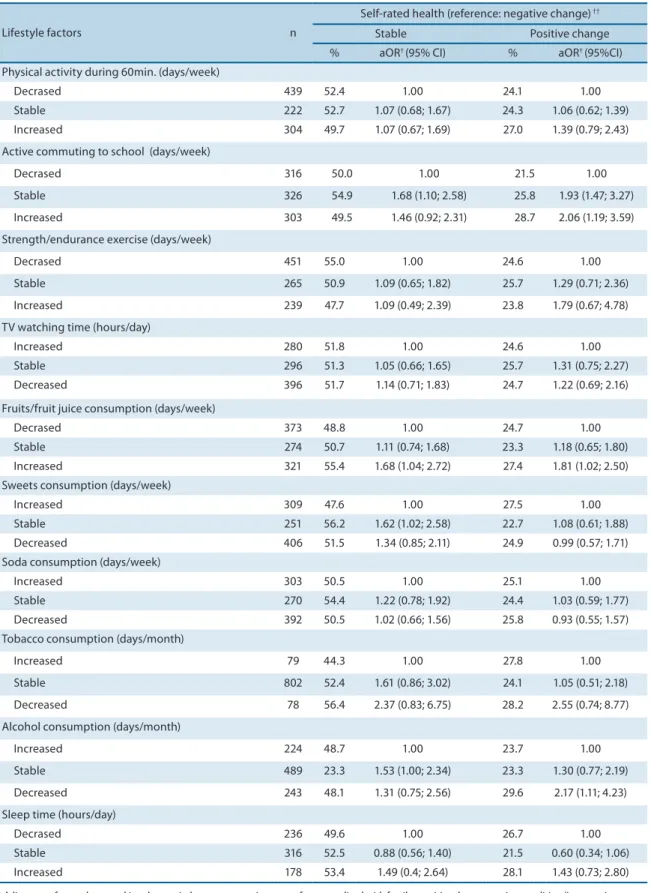
Table 3. Prevalence and odds ratio of the association between changes in lifestyle and self-rated health among high school students. (n = 984).
Lifestyle factors n
Self-rated health (reference: negative change) ††
Stable Positive change
% aOR† (95% CI) % aOR† (95%CI)
Physical activity during 60min. (days/week)
Decrased 439 52.4 1.00 24.1 1.00
Stable 222 52.7 1.07 (0.68; 1.67) 24.3 1.06 (0.62; 1.39)
Increased 304 49.7 1.07 (0.67; 1.69) 27.0 1.39 (0.79; 2.43)
Active commuting to school (days/week)
Decrased 316 50.0 1.00 21.5 1.00
Stable 326 54.9 1.68 (1.10; 2.58) 25.8 1.93 (1.47; 3.27)
Increased 303 49.5 1.46 (0.92; 2.31) 28.7 2.06 (1.19; 3.59)
Strength/endurance exercise (days/week)
Decrased 451 55.0 1.00 24.6 1.00
Stable 265 50.9 1.09 (0.65; 1.82) 25.7 1.29 (0.71; 2.36)
Increased 239 47.7 1.09 (0.49; 2.39) 23.8 1.79 (0.67; 4.78)
TV watching time (hours/day)
Increased 280 51.8 1.00 24.6 1.00
Stable 296 51.3 1.05 (0.66; 1.65) 25.7 1.31 (0.75; 2.27)
Decreased 396 51.7 1.14 (0.71; 1.83) 24.7 1.22 (0.69; 2.16)
Fruits/fruit juice consumption (days/week)
Decrased 373 48.8 1.00 24.7 1.00
Stable 274 50.7 1.11 (0.74; 1.68) 23.3 1.18 (0.65; 1.80)
Increased 321 55.4 1.68 (1.04; 2.72) 27.4 1.81 (1.02; 2.50)
Sweets consumption (days/week)
Increased 309 47.6 1.00 27.5 1.00
Stable 251 56.2 1.62 (1.02; 2.58) 22.7 1.08 (0.61; 1.88)
Decreased 406 51.5 1.34 (0.85; 2.11) 24.9 0.99 (0.57; 1.71)
Soda consumption (days/week)
Increased 303 50.5 1.00 25.1 1.00
Stable 270 54.4 1.22 (0.78; 1.92) 24.4 1.03 (0.59; 1.77)
Decreased 392 50.5 1.02 (0.66; 1.56) 25.8 0.93 (0.55; 1.57)
Tobacco consumption (days/month)
Increased 79 44.3 1.00 27.8 1.00
Stable 802 52.4 1.61 (0.86; 3.02) 24.1 1.05 (0.51; 2.18)
Decreased 78 56.4 2.37 (0.83; 6.75) 28.2 2.55 (0.74; 8.77)
Alcohol consumption (days/month)
Increased 224 48.7 1.00 23.7 1.00
Stable 489 23.3 1.53 (1.00; 2.34) 23.3 1.30 (0.77; 2.19)
Decreased 243 48.1 1.31 (0.75; 2.56) 29.6 2.17 (1.11; 4.23)
Sleep time (hours/day)
Decrased 236 49.6 1.00 26.7 1.00
Stable 316 52.5 0.88 (0.56; 1.40) 21.5 0.60 (0.34; 1.06)
Increased 178 53.4 1.49 (0.4; 2.64) 28.1 1.43 (0.73; 2.80)
† Adjustment for gender, age, skin color, marital status, occupation, type of property, lived with family, nutritional status, project condition (intervention or
control), city, self-rated health and behavior at baseline. †† Diferences between baseline and 9-months follow-up in self-rated health were classiied as negative
Considering the prevalence of lifestyle factors at baseline and at 9-month follow-up, there was overlap in the 95% CI window for most of the measured lifestyle factors. he exceptions were the weekly frequency of physical activity (decreased) and exercise for muscular strength/endur-ance (increased, Table 2).
Ater adjustment for potential confounds, students who maintained their weekly frequency of active commuting to school and sweets con-sumption had higher odds ratios for maintaining their self-rated health (reference: negative change in self-rated health) compared to peers who reduced their weekly frequency of these behaviors. Additionally, a higher odds ratio for maintaining their self-rated health was observed among students who increased their weekly frequency of fruits/fruit juice con-sumption (Table 3).
Considering the odds ratio for a positive change in self-rated health (reference: negative change in self-rated health), we observed that both main-taining and increasing their weekly frequency of active commuting to school was signiicantly associated with positive changes in students’ self-rated health. Additionally, increasing their weekly frequency of fruits/fruit juice consumption and reducing their monthly frequency of alcohol consumption were also signiicantly associated with greater odds ratios for having posi-tive changes in self-rated health. Changes in other behaviors (total physical activity, TV watching time, sweets, sot drinks and tobacco consumption, and sleep duration) were not signiicantly associated with a maintenance or positive change in self-rated health at 9-month follow-up (Table 3).
DISCUSSION
To our knowledge, this is the irst study to examine whether prospective lifestyle changes are associated with changes in self-rated health among young students. Two extant investigations that examined the prospective association between physical activity and self-rated health measured
out-comes only in adulthood12,15. Other studies have examined the prospective
association between lifestyle factors and psychological components in
young people, but they did not evaluate self-rated health18-21. Our results
demonstrated that changes in some lifestyle factors (active commuting to school, eating habits and alcohol consumption) were statistically associated with positive changes in self-rated health in young people. hese associa-tions remained signiicant even ater adjustment for potential confounding factors, such as gender, age, nutritional status, socioeconomic status and self-rated health at baseline. his evidence reinforces the importance of promoting healthy lifestyles, as well as how these changes may provide improvements in the perceived health of youth.
variables. Only two prospective studies have indicated that the weekly
frequency of physical activity in adolescence12 and changes during
ado-lescence in this variable (i.e., becoming active)15 are positively associated
with self-rated health in adulthood. However, these studies assessed physi-cal activity during leisure time, and the extrapolation of these indings to other domains of physical activity (in this case, the transport domain) is infeasible. Active commuting to school has decreased among youth over the years, and intervention actions have had modest efects in promoting
active commuting in these populations26. A recent systematic review27
in-dicated that active commuting to school could bring health beneits, such as reducing obesity, but prospective evidence for other health outcomes are needed. Our indings suggest that incentives to promote active com-muting may be essential not only to increase total physical activity time and to promote active lifestyle physiological beneits but also to promote a positive perception of health status among young people.
here was not a signiicant prospective association between the weekly frequency of physical activity for at least 60 minutes daily or the weekly frequency of muscular strength/endurance exercises and self-rated health.
hese results difer from studies with cross-sectional designs9-11,13,14,16.
How-ever, we performed our assessment of physical activity subjectively. While subjective and objective (e.g., accelerometry or pedometrics) measures can
diferentiate in the association with health outcomes28, we highlight the
need for future studies evaluating whether objectively measured physical activity and other measures of physical activity are prospectively associated with self-rated health among young people.
Changing speciic eating habits (i.e., the weekly frequency of con-sumption of sweets and fruits/fruit juice) was signiicantly associated with changes in self-rated health. Cross-sectional data also highlighted the
im-portance of a healthier diet on health perceptions among the young10,16, but
prospective data are unexplored. One study evaluated whether diet quality was prospectively associated (at one year follow-up) with mental health (assessed with the Pediatric Quality of Life Inventory) among Australian
students20. his study showed that improvements in diet quality were
in-versely associated with depressive symptoms. Intervention studies are also needed to test the efectiveness for the prevention of psychological problems (such as the negative self-rated health) through dietary modiication.
Additionally, the high consumption of sweets and the low
consump-tion of fruit are alarming among the Brazilian youth populaconsump-tion29. hus,
changing these eating habits seems to be crucial for promoting positive self-rated health. Special attention may be given to creating environments that promote healthy eating and to the creation of strategies that involve parents and the school community in the adoption or maintenance of good nutrition during adolescence.
Decreasing the monthly frequency of alcohol consumption was highly statistically associated with positive changes in self-rated health (see Table
on the efects of alcohol consumption on youth health30 indicated that
alcohol consumption might be associated with feelings of depression, anxiety, and suicide attempts among youth. However, many studies show fragility analysis of temporal or causal relationships between the variables, resulting in conclusions that are oten ambiguous (i.e., alcohol
consump-tion stemming from psychological problems vs. the reverse)30. Although
a possible bidirectional efect is plausible, this study provided important information that, independent of self-rated health and alcohol consump-tion at baseline, the reducconsump-tion of alcohol consumpconsump-tion was associated with positive changes in the self-rated health. his evidence supports the idea that public interventions aimed at reducing alcohol consumption are key to promoting mental health and perceived health among young people.
Changes in TV viewing time, sleep duration and tobacco consumption were not associated with changes in self-rated health (see Table 3). Although
some cross-sectional studies have not corroborated our indings11,13,17,
pro-spective evidence is lacking. However, it seems acceptable to hypothesize that monitoring short (only 9 months) and subjective measures of behavior may explain, in part, this lack of association between variables. he low preva-lence of students who reported tobacco consumption and the diiculties of reducing the consumption of this substance may also explain the lack of association between self-rated health and this variable (see Table 3). Future investigations with a prospective design and longer follow-up duration are encouraged. Additionally, studies with objective measures, especially for sleep duration and other sedentary behaviors, may help to determine whether these lifestyle factors are determinants of self-rated health in youth.
he prospective design is one of the strengths of our study because it allowed us to analyze changes in lifestyle and their associations with self-rated health. Furthermore, the inclusion of diferent lifestyle factors allowed us to indicate how changes in perceived health in youth are predicted by a set of behavioral factors that together represent the lifestyle, as opposed to a single factor. Another strength of the study was the inclusion of a sample of students residing in cities in two Brazilian regions with distinct socio-cultural proiles (Northeast and Southeast). his design aspect increases the degree of extrapolation of data. Finally, the assessment of lifestyle and self-rated health is for a young population from a middle-income country, and much of the literature on this subject has been derived from
high-income countries9,19.
for consistent and prospective evidence about lifestyle characteristics in youth and their impact on mental health in early and future ages.
CONCLUSIONS
Changes in lifestyle factors, such as increasing the weekly frequency of active commuting to school and the rate of fruits/fruit juice consumption, as well as reducing sweet and alcohol consumption, were important deter-minants of self-rated health among students. his association remained signiicant even ater adjustment for potential confounding factors, includ-ing self-rated health and lifestyle factors at baseline. hese results suggest that multiple lifestyle factors, not a single speciic factor, are determinants of changes in perceived health among young people. Creating environ-ments that encourage the shiting to active, healthy eating habits and the reduction of alcohol consumption are keys to ensuring positive perceptions of health in youth. hese interventions, with an associated modiication of lifestyle factors, deserve special attention for their ability to promote mental health in young people.
Acknowledgments
his study was supported by the follow institutions: the Pan American Health Organization (PAHO), the US Centers for Disease Control and Prevention (CDC), CNPq (Ministry of Science and Technology, Brazil), the Federal University of Santa Catarina, and the State University of Per-nambuco. he authors thank the students and teachers from the 20 schools that participated in the project and the State Secretaries of Education in Santa Catarina and Pernambuco.
REFERENCES
1. World Health Organization. Constitution of the world health organization. Proceedings of International Health Conference. 1964; Available from:http:// whqlibdoc.who.int/hist/oicial_records/2e.pdf [2013 out 20].
2. Currie C, Zanotti C, Morgan A, Currie D, Looze Md, Roberts C, Samdal O, Smith OR, Barnekow V. Social determinants of health and well-being among young people. World Health Organization Regional Oice for Europe. 2012; Available from: http:// www.euro.who.int/__data/assets/pdf_ile/0003/163857/Social-determinants-of-health-and-well-being-among-young-people.pdf [2013 out 10].
3. Ottova V, Hjern A, Rasche C-H, Ravens-Sieberer U. Child mental health meas-urement: Relections and future directions. 2012; Available from: <http://www. intechopen.com/download/get/type/pdfs/id/37287> [2013 jul 28].
4. Mattila VM, Parkkari J, Koivusilta L, Nummi T, Kannus P, Rimpelä A. Adolescents’ health and health behaviour as predictors of injury death. A prospective cohort follow-up of 652,530 person-years. BMC public health 2008;8:90.
5. Idler EL, Benyamini Y. Self-rated health and mortality: A review of twenty-seven community studies. J Health Soc Behav 1997; 38(1):21-37.
7. Cui W, Zack MM. Peer reviewed: Trends in health-related quality of life among adolescents in the united states, 2001–2010. Prev Chronic Dis 2013; 10:E111. 8. Istituto Brasileiro de Geograia e Estatística (IBGE). Sistema IBGE de recuperação
automática (SIDRA). Pesquisa Nacional por Amostra de Domicílios, 2003-2008. 2013; Available from: < http://www.sidra.ibge.gov.br/> [2013 jul 02].
9. Vancea LA, Barbosa JMV, Menezes AS, Santos CM, Barros MVG. Associação entre atividade física e percepção de saúde em adolescentes: Revisão sistemática. Rev Bras Ativ Fís Saúde 2012;16(3):246-54.
10. Afridi AAK, Motwani K, Khawaja S, Khoja AA, Fatmi Z, Azam I, et al. Self-per-ceived health among school going adolescents in pakistan: Inluence of individual, parental and life style factors? Glob J Health Sci 2013; 5(4):71-8.
11. Chen X, Sekine M, Hamanishi S, Wang H, Gaina A, Yamagami T, et al. Lifestyles and health-related quality of life in japanese school children: A cross-sectional study. Prev med 2005;40(6):668-78.
12. Elinder LS, Sundblom E, Rosendahl KI. Low physical activity is a predictor of thin-ness and low self-rated health: Gender diferences in a swedish cohort. J Adolesc Health 2011;48(5):481-6.
13. Erginoz E, Alikasifoglu M, Ercan O, Uysal O, Ercan G, Kaymak DA, et al. Perceived health status in a turkish adolescent sample: Risk and protective factors. Eur J Pediatr 2004;163(8):485-94.
14. Galán I, Boix R, Medrano M, Ramos P, Rivera F, Pastor-Barriuso R, et al. Physi-cal activity and self-reported health status among adolescents: A cross-sectional population-based study. BMJ open 2013;3(5).
15. Rangul V, Bauman A, Holmen TL, Midthjell K. Is physical activity maintenance from adolescence to young adulthood associated with reduced cvd risk factors, improved mental health and satisfaction with life: he hunt study, norway. Int J Behav Nutr Phys Act 2012; 9:144.
16. Shi X, Tubb L, Fingers ST, Chen S, Cafrey JL. Associations of physical activity and dietary behaviors with children’s health and academic problems. J Sch Health 2013;83(1):1-7.
17. Sousa TF, Silva KS, Garcia LMT, Del Duca GF, Oliveira ESA, Nahas MV. Autoaval-iação de saúde e fatores associados em adolescentes do estado de Santa Catarina, Brasil. Rev Paul Pediatr 2010;28(4):333-9.
18. Cousins JC, Whalen DJ, Dahl RE, Forbes EE, Olino TM, Ryan ND, et al. he bi-directional association between daytime afect and nighttime sleep in youth with anxiety and depression. J Pediatr Psychol 2011;36(9):969-79.
19. Hoare E, Skouteris H, Fuller-Tyszkiewicz M, Millar L, Allender S. Associations between obesogenic risk factors and depression among adolescents: A systematic review. Obes Rev 2014;15(1):40-51.
20. Jacka FN, Kremer PJ, Berk M, de Silva-Sanigorski AM, Moodie M, Leslie ER, et al. A prospective study of diet quality and mental health in adolescents. PLoS One 2011;6(9):e24805.
21. Stavrakakis N, de Jonge P, Ormel J, Oldehinkel AJ. Bidirectional prospective as-sociations between physical activity and depressive symptoms. he trails study. J Adolesc Health 2012;50(5):503-8.
22. Nahas MV, de Barros MV, de Assis MAA, Hallal PC, Florindo AA, Konrad L. Methods and participant characteristics of a randomized intervention to promote physical activity and healthy eating among brazilian high school students: he saude na boa project. J Phys Act Health 2009;6(2):153-62.
23. Silva KS, Barros MVG, Barbosa Filho VC, Garcia LMT, Wanderley Júnior RS, Beck, CC, et al. Implementation of the “Saúde na Boa” intervention: process evaluation and characteristics of participants and dropouts. Rev Bras Cineantropom Desem-penho Hum 2014; 16(Supl.1)1-12.
Corresponding author
Valter Cordeiro Barbosa Filho Universidade Federal de Santa Catarina.
Centro de Desportos, Departamento de Educação Física.
Campus Universitário – Trindade. 88040-900 - Florianópolis, SC, Brasil. E-mail: [email protected]
25. Cole TJ, Bellizzi MC, Flegal KM, Dietz WH. Establishing a standard deinition for child overweight and obesity worldwide: International survey. BMJ 2000; 320(7244):1240-3.
26. Chillón P, Evenson KR, Vaughn A, Ward DS. A systematic review of interventions for promoting active transportation to school. Int J Behav Nutr Phys Act 2011;8:10. 27. Saunders LE, Green JM, Petticrew MP, Steinbach R, Roberts H. What are the
health beneits of active travel? A systematic review of trials and cohort studies. PLoS One 2013;8(8):e69912.
28. Reilly JJ, Penpraze V, Hislop J, Davies G, Grant S, Paton JY. Objective measure-ment of physical activity and sedentary behaviour: Review with new data. Arch Dis Child 2008;93(7):614-9.
29. Barbosa-Filho VC, Campos W. Lopes, AS. Epidemiology of physical inactivity, sedentary behaviors, and unhealthy food habits among Brazilian adolescents: A systematic review. Cienc Saúde Colet 2014;19(1):171-91.