CATARINA DE ALMEIDA MARQUES
MOLECULAR EFFECTS OF CONTINUOUS POSITIVE AIRWAY PRESSURE
THERAPY IN PATIENTS WITH OBSTRUCTIVE SLEEP APNEA:
A PROTEOMICS APPROACH
UNIVERSIDADE DO ALGARVE
Faculdade de Ciências e Tecnologia
CATARINA DE ALMEIDA MARQUES
MOLECULAR EFFECTS OF CONTINUOUS POSITIVE AIRWAY PRESSURE
THERAPY IN PATIENTS WITH OBSTRUCTIVE SLEEP APNEA:
A PROTEOMICS APPROACH
Mestrado em Biotecnologia
Trabalho efetuado sob orientação de:
Deborah Penque, PhD (*) Deborah M Power, PhD
(*)
Laboratório de Proteómica, Departamento de Genética Humana, INSARJ
UNIVERSIDADE DO ALGARVE
Faculdade de Ciências e Tecnologia
MOLECULAR EFFECTS OF CONTINUOUS POSITIVE AIRWAY PRESSURE
THERAPY IN PATIENTS WITH OBSTRUCTIVE SLEEP APNEA:
A PROTEOMICS APPROACH
Declaração de autoria de trabalho
Declaro ser a autora deste trabalho, que é original e inédito. Autores e trabalhos consultados estão devidamente citados no texto e constam da listagem de referências incluída.
Indicação de «Copyright»
A Universidade do Algarve reserva para si o direito, em conformidade com o disposto no Código do Direito de Autor e dos Direitos Conexos, de arquivar, reproduzir e publicar a obra, independentemente do meio utilizado, bem como de a divulgar através de repositórios científicos e de admitir a sua cópia e distribuição para fins meramente educacionais ou de investigação e não comerciais, conquanto seja dado o devido crédito ao autor e editor respetivos.
i
Agradecimentos
Deixo um agradecimento em especial à minha orientadora Doutora Deborah Penque por me ter aceite no seu grupo e por ter autorizado a minha participação na investigação em curso no Laboratório de Proteómica, INSARJ, um projeto muito ambicioso, e muito importante para a investigação clínica. Desejo-lhe o maior sucesso.
Quero de igual modo agradecer à minha orientadora Doutora Deborah M. Power por todo o apoio proporcionado ao longo deste dois anos. Obrigada.
Quero também agradecer aos meus pais. À minha mãe pelo amor, carinho e apoio, e ao meu pai pela comida e paciência infinitas. Agradeço também ao Luís, pelo amor incondicional e por todo o suporte emocional que foi absolutamente indispensável.
Devo também um agradecimento cheio de emoção à minhas colegas Melina e Ana Luísa, sem vocês não teria aguentado nem metade. Quero, do mesmo modo, agradecer à minha colega e amiga Cristina, pelo o enorme apoio que me deu ao longo do ano, pela amizade e pelos bons momentos. À Fátima desejo tudo de bom, e agradeço todo o non-sense, boa disposição e alegria que me fizeram sentir em casa. Obrigada pelo apoio incondicional.
Gostaria também de deixar um agradecimento à Enfª Alexandra Santos, ao Doutor João Pedro Nunes e à Sofia Neves, que me ajudaram na fase final do projeto.
ii
Abstract
Obstructive sleep apnea (OSA) is a common public health concern in many countries, including Portugal, causing deleterious effects on metabolic and cardiovascular health. There are still, however, gaps in scientific and clinical knowledge in this field.
Continuous positive airway pressure (CPAP) is considered the first line treatment in OSA, reducing co-morbidities and associated societal consequences such as accidents and cognitive impairment. However, residual sleepiness may persist in some patients and most chronic consequences of OSA may not be fully reversed by CPAP treatment. Therefore, studies are needed to estimate the reversible effects of CPAP (differences pre- to post-CPAP treatment) and irreversible effects of OSA, in other words, estimate the difference between patients with non-treated OSA and patients after effective treatment, when compared to controls.
The objective of this study was to evaluate, using a proteomic approach, the molecular effect of the therapeutic benefit and/or side effects of continuous positive airway pressure treatment in red blood cells of OSA patients with comorbidities, namely diabetes. Notwithstanding the focus on RBCs, plasma samples were also further analyzed to make the results more robust.
The results of the study have shown that PRDX2 is highly modulated in OSA patients with or without diabetes, and is associated with OSA’s severity and metabolic status. We reported higher hyperoxidation of RBC PRDX2 oligomeric forms in diabetic OSA patients, and also higher hyperoxidation of plasma PRDX2 and PRX 1/4 in this same group.
CPAP benefits, including glycemic control, may correlate with RBC PRDX2 oligomeric redox-state associated with chaperone activity, and with decrease of plasma PRDXs stress-induced inflammation pathways.
PRDX2 is a promising biomarker candidate for OSA severity and metabolic status.
iii
Resumo
O Síndrome da Apneia Obstrutiva do Sono (SAOS) é um problema de saúde pública emergente, comum em muitos países, incluindo Portugal. Esta doença é caracterizada por um colapso das vias aéreas superiores durante o sono, que provoca a diminuição ou interrupção do fluxo de ar, normalmente seguido de um despertar do sono. Como consequência, os pacientes sofrem de fragmentação do sono e sonolência diurna excessiva, tendo inúmeras repercussões no dia-a-dia. Além destas, a SAOS pode originar complicações graves, de natureza cardiovascular e metabólica. Entre outras complicações pode-se salientar hipertensão arterial, hipertensão pulmonar, insuficiência respiratória, arritmias e acidentes vasculares cerebrais. Os principais factores de risco para esta doença são a idade, obesidade, género, consumo de álcool e tabagismo.
Além de um distúrbio grave do sono, a SAOS é também uma doença de stress oxidativo. O stresse oxidativo surge quando ocorre uma diminuição da capacidade antioxidante, e um excesso de produção de espécies reactivas de oxigénio e/ou de nitrogénio. Apesar de os radicais livres possuírem um papel importante na regulação de vias de sinalização fundamentais para inúmeras funções celulares, quando há excesso de produção destas formas reactivas, estas podem causar danos em lípidos, proteínas e ácidos nucleicos, afectando diversos mecanismos celulares e fisiológicos. Assim, os repetidos eventos apneicos caracterizados pela hipóxia intermitente induzida pela SAOS estão na base de danos moleculares que, ao longo dos anos, podem revelar-se irreversíveis.
Existem várias medidas terapêuticas para a SAOS, contudo o tratamento de eleição é o CPAP (do inglês Continuous Positive Airway Pressure). Este método consiste na aplicação de uma pressão aérea positiva contínua por um ventilador, que é transmitida ao paciente através de uma máscara nasal, mantendo a via aérea permeável e permitindo um fluxo aéreo contínuo.
A utilização do CPAP possibilita uma melhoria clínica imediata, quando usado regularmente, melhorando assim a qualidade de vida dos pacientes. No entanto, as consequências crónicas derivadas da SAOS podem não ser totalmente revertidas pelo tratamento com CPAP. Assim, é importante compreender os mecanismos moleculares
iv que estão na base da SAOS, para poder melhor compreender os benefícios do CPAP, que podem contribuir para o desenvolvimento de novas terapias para esta doença.
Os glóbulos vermelhos, sendo as células responsáveis pelo transporte de oxigénio às diferentes regiões e órgãos do corpo, são considerados uma fonte de inflamação sistémica que pode conduzir a doenças metabólicas, tais como obesidade, resistência à insulina e hipertensão, patologias reconhecidas como inerentes à SAOS.
Estudos recentenmente desenvolvidos do Laboratório de Proteómica do INSARJ tiveram como objectivo analisar o proteoma de glóbulos vermelhos em doentes com SAOS, bem como os efeitos moleculares do CPAP nos glóbulos vermelhos destes doentes, com o intuito de encontrar potenciais biomarcadores para diagnóstico e/ou monitorização da doença. Foi reportado pelos autores que diversas proteínas se encontravam diferencialmente expressas nos doentes com SAOS e após o tratamento CPAP, sendo a Peroxirredoxina II (PRDX2) uma das consideradas mais relevantes para o estudo.
A PRDX2 é a terceira proteína mais abundante nos glóbulos vermelhos, sendo por isso fundamental para a sua sobrevivência. As PRDXs possuem funções importantes na célula. Além da sua função peroxidática, que ajuda a combater stress oxidativo através da degradação do peróxido de hidrogénio, actuam em vias de transdução de sinal, e possuem também actividade chaperone, dependendo da sua estrutura redox-oligomérica, sendo por isso importantes na protecção dos glóbulos vermelhos contra stresse oxidativo.
Estudos desenvolvidos no Laboratório de Proteómica do INSARJ anteriormente mencionados, mostraram que as formas monomérica e dimérica desta enzima antioxidante PRDX2 se encontravam significativamente hiperoxidadas nos glóbulos vermelhos de doentes com SAOS, principalmente durante a manhã, sugerindo a presença de stresse oxidativo severo que por sua vez leva a uma homeostasia antioxidante alterada, nos glóbulos vermelhos destes pacientes. Seis meses de tratamento com CPAP diminuíram esta hiperoxidação e originaram formas multiméricas hiperoxidadas, associadas à função chaperone da PRDX2, e descritas como estruturas protetoras que ajudam a aumentar a resistência ao stresse celular. Os níveis de PRDX2 oxidada correlacionaram-se com parâmetros polisomnográficos e metabólicos, nesses pacientes. Portanto, o estado redox / oligomérico da PRDX2 nos
v glóbulos vermelhos tem sido proposto por esses autores como promissor candidato a biomarcador para gravidade da SAOS e monitorização do tratamento.
Assim, o objetivo deste trabalho consiste na validação da PRDX2 como potencial biomarcador, tendo como alvo de estudo, além da SAOS, a comorbidade diabetes, e os efeitos moleculares do tratamento CPAP nos glóbulos vermelhos destes pacientes. Para este efeito decidimos usar um cohort maior do que o utilizado nos estudos anteriores, composto por um grupo controlo (n = 18 em que dois são diabéticos), um grupo de pacientes SAOS não tratados (n = 18 em que três são diabéticos), e o mesmo grupo de doentes SAOS após seis meses de tratamento CPAP.
Os resultados deste estudo corroboram com os anteriores. Verificou-se que, no geral, a hiperoxidação da PRDX2 nos glóbulos vermelhos é mais elevada em pacientes SAOS, e diminui após seis meses de tratamento CPAP. Contudo, isto só acontece em pacientes SAOS não diabéticos. Após seis meses de tratamento CPAP, os pacientes SAOS com diabetes não revelam uma diminuição da hiperoxidação da PRDX2. Além disto, verificou-se o aparecimento de formas multiméricas hiperoxidadas após o tratamento CPAP, principalmente em pacientes não diabéticos. Estudos de correlação revelaram que os níveis de formas monoméricas e diméricas da PRDX2 correlacionam positivamente com prarâmetros do sono, nomeadamente RDI, ODI, T90, enquanto as formas multiméricas hiperoxidadas correlacionam positivamente com parâmetros metabólicos como a glicémia e hemoglobina glicada, sugerindo que na presença de hipóxia induzida pela SAOS não tratada, estes pacientes podem ter menor capacidade de produzir estruturas multiméricas potetoras na resposta a um aumento de níveis de glucose no sangue, capacidade que pode ser recuperada com o tratamento CPAP.
Analisando estes resultados, considerámos pertinente fazer uma experiência semelhante em amostras de plasma, utilzando o mesmo cohort, para robustecer o estudo da PRDX2 nestes doentes. O estudo revelou formas oligoméricas diferente das encontradas nos glóbulos vermelhos. Contudo, o estado oligomérico da enzima corrobora com os resultados anteriores: há um amento da quantidade de PRDX 2 em pacientes com SAOS, com ou sem diabetes, e uma diminuição após seis meses de tratamento CPAP, sendo que esta diminuição é significativa em pacientes não diabéticos. Além disto verificámos que os níveis das formas hiperoxidadas correlacionam positivamente com parâmetros relativos ao metabolismo glicolítico
vi como glicémia, hemoglobina glicada e HOMA-IR. Após o tratamento CPAP estas correlações deixaram de se verificar, excluindo o grupo de pacientes SAOS com diabetes, que as manteve.
Assim, podemos dizer que o estado redox/oligomérico da PRDX2 pode ser considerado um potencial biomarcador para a severidade da SAOS e controlo do tratamento CPAP. Contudo, será necessário recorrer a outro tipo de abordagens que permitam estudar a fundo a PRDX2, nomeadamente as modificações pós traducionais desta enzima, e a sua relação com a SAOS e parâmetros metabólicos dos pacientes.
Palavras-chave: Hipóxia induzida pela SAOS, PRDX2, modulações redox, metabolismo
vii
Graphical Abstract
* Note - The boxed scheme represents the work carried out in this thesis project
Highlights
PRDX 2 is highly modulated in OSA patients with or without diabetes, and is associated with OSA’s severity and metabolic status
PRDX2 and PRX 1/4 hyperoxidation is higher in OSA patients, especially in patients with diabetes, both in RBCs and plasma.
CPAP benefits, including glycemic control, may correlate with RBC’s PRDX2 oligomeric state associated with chaperone activity, and with a decrease of plasma PRDXs stress-induced inflammation pathways.
PRDX2 is a promising biomarker candidate for OSA severity and metabolic status
viii
Table of Contents
Agradecimentos ... i
Abstract ... ii
Resumo ... iii
Graphical Abstract ... vii
Highlights ... vii
Abbreviations ... xi
List of Figures ... xiv
List of Tables ... xx
1 Introduction... 1
1.1 Obstructive Sleep Apnea... 1
1.2 Etiology and Pathogenesis ... 2
1.3 Epidemiology ... 3
1.3.1 Risk Factors ... 3
1.3.1.1 Age and Gender ... 4
1.3.1.2 Obesity ... 4
1.3.1.3 Genetic and Anatomical factors ... 5
1.3.1.4 Smoking and drinking habits ... 5
1.4 Symptoms ... 7 1.5 Consequences ... 7 1.5.1 Arterial hypertension ... 8 1.5.2 Heart function... 8 1.5.3 Cerebrovascular diseases ... 8 1.5.4 Pulmonary hypertension ... 8 1.6 Diagnosis ... 9
ix
1.7 Treatment ... 10
1.8 Oxidative Stress and OSA ... 11
1.9 Comorbidities in study: Diabetes Mellitus ... 11
1.10 Classification of Diabetes Mellitus ... 12
1.10.1 OSA and Type2-Diabetes ... 13
1.11 Biomarkers Discovery ... 15 1.11.1 Discovery phase ... 16 1.12 Biomarker Validation ... 17 1.12.1 Biomarkers in OSA ... 17 1.12.1.1 Peroxiredoxin II ... 17 2 Objective ... 23
3 Material and Methods ... 24
3.1 Samples and Patients ... 24
3.1.1 Sample selection ... 24
3.1.2 Sample preparation ... 24
3.1.3 Total protein quantification ... 25
3.2 Western Blotting ... 26
3.2.1 1DE SDS-PAGE ... 26
3.2.2 Sample preparation for 1DE ... 27
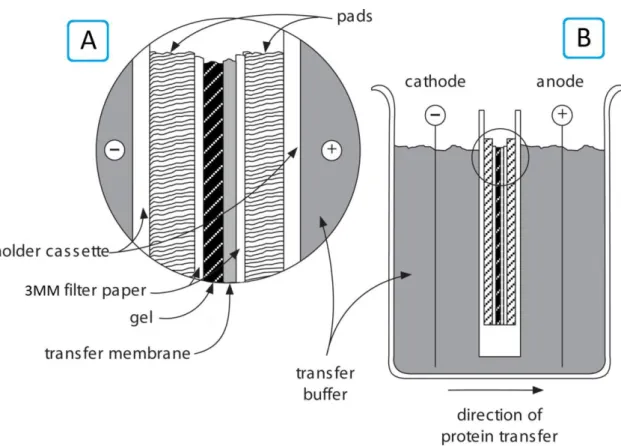
3.2.3 Membrane Transfer ... 27
3.2.4 Verification of protein transfer from SDS-PAGE gels to PVDF membranes 28 3.2.5 Membrane Blocking... 29
3.2.6 Membrane incubation with primary antibody ... 29
3.2.7 Membrane incubation with secondary antibody ... 29
x
3.2.9 Determination of Protein Relative Abundance ... 30
3.3 Statistical Analysis ... 31
4 Results ... 32
4.1 Peroxiredoxin II in RBCs ... 32
4.2 Peroxiredoxin II in Plasma ... 42
... 49
4.3 RBCs results for PRDX2 and PRDX SO2/3 Correlation with PSG and Clinical Parameters ... 50
4.4 Plasma results for PRDX2 and PRDX SO2/3 Correlation with PSG and Clinical Parameters ... 52 5 Discussion ... 54 6 Conclusion ... 59 7 Bibliography ... 60 8 Annexes ... 65 Annex I ... 65 Annex II ... 66 Annex III ... 68 Annex IV ... 70 Annex V ... 77
xi
Abbreviations
1DE One-Dimensional Electrophoresis
2D-DIGE Two-Dimensional Differential Gel Electrophoresis
2DE Two-Dimensional Electrophoresis
AHI Apnea-Hypopnea Index
AHT Arterial Hypertension
ATP Adenosine Triphosphate
BMI Body Mass Index
BP Blood Pressure
BSA Bovine Serum Albumin
CBC Complete Blood Count
COPD Chronic Obstructive Pulmonary Disease
CPAP Continuous Positive Airway Pressure
ECG Electrocardiogram
EEG Electroencephalogram
EMG Electromyography
EOG Electrooculogram
EPW Epworth Sleepiness Scale
FFA Free Fatty Acid
GLUT4 Glucose Transporter Type 4
H2O2 Hydrogen Peroxide
Hb Hemoglobin
Hb A1C Glycated Hemoglobin
HOMA-IR Insulin Resistance Index
INSARJ Instituto Nacional de Saúde Doutor Ricardo Jorge
xii
LC Liquid Chromatography
M Molar Concentration
MCH Mean Corpuscular Hemoglobin
MCHC Mean Corpuscular Hemoglobin Concentration
MCV Mean Corpuscular Volume
mL Milliliter
mM Millimolar
MS Mass Spectrometry
NA Not-applicable
NADPH Nicotinamide Adenine Dinucleotide Phosphate
NEM N-Ethylmaleimide
NS Non-statistical meaning
ODI Oxygen Desaturation Index
OSA Obstructive Sleep Apnea
P95 95th Percentile Pressure
PHT Pulmonary Hypertension
PRDX2 Peroxiredoxin II
PRDXs Peroxiredoxins
PRDXSO2/3 Hyperoxidized Peroxiredoxin II
PSG Polysomnography
PTMs Post-translational modifications
PVDF Polyvinylidene Fluoride
RBC Red Blood Cell
RDI Respiratory Disturbance Index
RDW Red Cell Distribution Width
xiii
ROS Reactive Oxygen Species
SDS-PAGE Sodium Dodecyl Sulfate – Polyacrylamide Gel Electrophoresis
Srx Sulfiredoxin
T1DM Type 1 Diabetes Mellitus
T2DM Type 2 Diabetes Mellitus
T90 Time during which arterial O2 saturation was inferior to 90%
Trx Thioredoxin
WB Western Blot
WBC White Blood Cell
WHO World Human Organization
μG Microgram
xiv
List of Figures
Figure 1.1: Interactions between age, OSA and type 2 diabetes 33 ... 14
Figure 1.2: Association and causal links for OSA and metabolic abnormalities, leading
to type 2 diabetes 33. ... 14
Figure 1.3: The peroxidatic cysteine (SpH) reacts with hydrogen peroxide to form a
sulfenic acid. The oxidized cyseine SpOH can then condense with the resolving cysteine (SrH) on the opposing PRDX to form a intermolecular disulfide bond 44. ... 18
Figure 1.4: Adapted 44 Redox interconversions of typical 2-Cys PRDX, and their recycling cycles. ... 19
Figure 1.5: Reduced PRDX can exist as decamers or dodecamers that dynamically
exchange subunits with a cellular pool of oxidized and reduced dimers 43. ... 20
Figure 1.6: Adapted 39. Measurement of PRDX2 redox/oligomeric states in RBC with NEM analyzed by SDS-PAGE under non-reducing condition followed by Western blotting with Ab-PRDX2 or Ab-PRDXSO2/3 ... 21
Figure 3.1: RBCs (A) and Plasma (B) sample preparation for WB. Preparation starts with
sample dilution using NEM 100 mM and ethanol 96%, with addition of protease inhibitors. RBC and Plasma samples are further diluted with ultrapure water for total protein quantification. Diluted samples are then adjusted for specific total protein concentration for WB – 1:200 dilution is used in RBC sample adjustment for 70μG (A) and 1:10 dilution is used in Plasma sample adjustment for 40 (B). ... 25
Figure 3.2: Adapted 45. Electroblotting using a tank transfer unit. After the cassette is assembled (A) it is then placed in a tank containing transfer buffer (B). The membrane is positioned on the anode side of the gel and charged proteins are transferred from the gel onto the membrane. ... 28
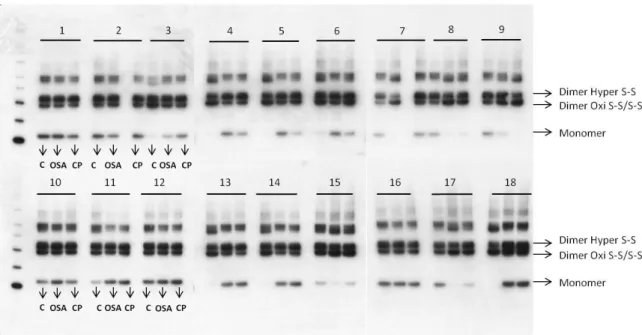
Figure 4.1: RBCs results of PRDX2 Western blot detection using the ECL system and
imaging by X-ray processor. Samples were separated on SDS-PAGE gels before transfer to PVDF membranes. Detection of proteins was via the Ab-PRDX2 (dilution 1:20000 – methods, see page 29). The samples were grouped into 18 different groups for ease of analysis. The order of samples in each group is always the same and is indicated in samples 1, 2, 3, 10, 11 and 12 – Control (C), non-treated OSA (OSA) and post CPAP
xv treatment (CP) samples, n = 54. Monomeric – 20 kDa – and dimeric – 40 kDa – PRDX2 forms can be observed.. ... 32
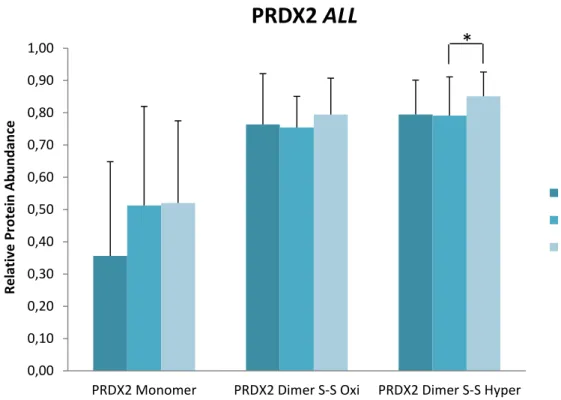
Figure 4.2: RBCs relative protein abundance of PRDX2 monomeric, oxidized and
hyperoxidized dimeric forms in samples, in Snorers (n=18) and OSA (n=18) groups, and after CPAP (n=18) treatment. Significant differences between groups are denoted by “*” p < 0.05. ... 33
Figure 4.3: RBCs relative protein abundance of PRDX2 monomeric form in samples, in
Snorers (n = 18; 16 samples from non-diabetic snorers and 2 samples from diabetic snorers) and OSA group (n = 18; 15 samples from non-diabetic OSA patients and 3 samples from diabetic OSA patients), and after CPAP treatment (n = 18; 15 samples from non-diabetic OSA patients and 3 samples from diabetic OSA patients). No significant differences were found. ... 34
Figure 4.4: RBCs relative protein abundance of PRDX2 oxidized dimeric form in
samples, in Snorers (n = 18; 16 samples from non-diabetic snorers and 2 samples from diabetic snorers) and OSA group (n = 18; 15 samples from non-diabetic OSA patients and 3 samples from diabetic OSA patients), and after CPAP treatment (n = 18; 15 samples from non-diabetic OSA patients and 3 samples from diabetic OSA patients). Significant differences between groups are denoted by “*” p < 0.05. ... 34
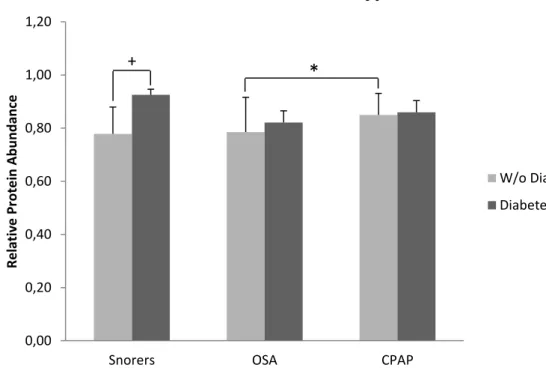
Figure 4.5: RBCs relative protein abundance of PRDX2 hyperoxidized dimeric form in
samples, in Snorers (n = 18; 16 samples from non-diabetic snorers and 2 samples from diabetic snorers) and OSA group (n = 18; 15 samples from non-diabetic OSA patients and 3 samples from diabetic OSA patients), and after CPAP treatment (n = 18; 15 samples from non-diabetic OSA patients and 3 samples from diabetic OSA patients). Significant differences between groups are denoted by “*” p < 0.05, and inner group differences are denoted by “+” p < 0.05. ... 35
Figure 4.6: RBCs relative protein abundance of PRDX2 monomeric, oxidized and
hyperoxidized dimeric forms for diabetic (Diabetes+) and non-diabetic (Diabetes-) patients, in Snorers (n = 18; 16 samples from non-diabetic snorers and 2 samples from diabetic snorers) and OSA (n = 18; 15 samples from non-diabetic OSA patients and 3 samples from diabetic OSA patients) groups, and after CPAP treatment (n = 18; 15 samples from non-diabetic OSA patients and 3 samples from diabetic OSA patients).
xvi Significant differences between groups are denoted by “*” p < 0.05, and inner group differences are denoted by “+” p < 0.05. ... 36
Figure 4.7: RBCs results of PRDX SO2/3 Western blot detection using the ECL system and
imaging by X-ray processor. Samples were separated on SDS-PAGE gels before transfer to PVDF membranes. Detection of proteins was via using the Ab-PRDX SO2/3 (dilution
1:3000 – methods, see page 29). The samples were grouped into 18 different groups for ease of analysis. The order of samples in each group is always the same and is indicated in samples 1, 2, 3, 10, 11 and 12 – Control (C), non-treated OSA (OSA) and post CPAP treatment (CP) samples, n = 54. Monomeric – 20 kDa – dimeric – 40 kDa – and multimeric – 220 kDa – forms can be observed. ... 37
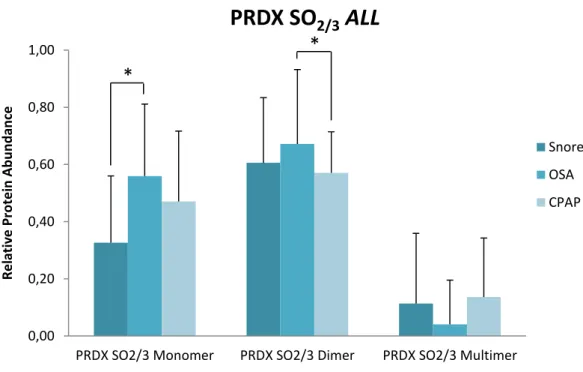
Figure 4.8: RBCs relative protein abundance of PRDX SO2/3 monomeric, dimeric and
multimeric hyperoxidized forms, in samples; in Snorers (n=18) and OSA (n=18) groups, and after CPAP treatment (n=18). Significant differences between groups are denoted by “*” p < 0.05. ... 38
Figure 4.9: RBCs relative protein abundance of PRDX SO2/3 hyperoxidized monomeric
form in samples, in Snorers (n = 18; 16 samples from non-diabetic snorers and 2 samples from diabetic snorers) and OSA group (n = 18; 15 samples from non-diabetic OSA patients and 3 samples from diabetic OSA patients). Significant differences between groups are denoted by “*” p < 0.05. ... 38
Figure 4.10: RBCs relative protein abundance of PRDX SO2/3 hyperoxidized dimeric
form in samples, in Snorers (n = 18; 16 samples from non-diabetic snorers and 2 samples from diabetic snorers) and OSA group (n = 18; 15 samples from non-diabetic OSA patients and 3 samples from diabetic OSA patients). Significant differences between groups are denoted by “*” p < 0.05. ... 39
Figure 4.11: RBCs relative protein abundance of PRDX SO2/3 hyperoxidized multimeric
form in samples, in Snorers (n = 18; 16 samples from non-diabetic snorers and 2 samples from diabetic snorers) and OSA group (n = 18; 15 samples from non-diabetic OSA patients and 3 samples from diabetic OSA patients). Significant differences between groups are denoted by “*” p < 0.05. ... 40
Figure 4.12: RBCs relative protein abundance of PRDX SO2/3 monomeric, dimeric and
multimeric hyperoxidized forms for diabetic (Diabetes+) and non-diabetic (Diabetes-) patients, in Snorers (n = 18; 16 samples from non-diabetic snorers and 2 samples from
xvii diabetic snorers) and OSA (n = 18; 15 samples from non-diabetic OSA patients and 3 samples from diabetic OSA patients) groups, and after CPAP treatment (n = 18; 15 samples from non-diabetic OSA patients and 3 samples from diabetic OSA patients). Significant differences between groups are denoted by “*” p < 0.05. ... 41
Figure 4.13: Plasma results of PRDX2 Western blot detection using the ECL system and
imaging by X-ray processor. Samples were separated on SDS-PAGE gels before transfer to PVDF membranes. Detection of proteins was via using the Ab-PRDX2 (dilution 1:8000 – methods, see page 29). The samples were grouped into 18 different groups for ease of analysis. The order of samples in each group is always the same and is indicated in samples 1, 2, 3, 10, 11 and 12 – Control (C), non-treated OSA (OSA) and post CPAP treatment (CP) samples, n=54. Two monomeric PRDX2 forms can be observed. ... 42
Figure 4.14: Plasma relative protein abundance of PRDX2 20kDa and 25kDa
monomeric forms in samples, in Snorers (n = 18) and OSA (n = 18) groups, and after CPAP (n = 18) treatment. Significant differences between groups are denoted by “*” p<0.05. ... 43
Figure 4.15: Plasma relative protein abundance of PRDX2 25 kDa monomeric form in
samples, in Snorers (n = 18; 16 samples from non-diabetic snorers and 2 samples from diabetic snorers) and OSA group (n = 18; 15 samples from non-diabetic OSA patients and 3 from diabetic OSA patients, and after CPAP treatment (n = 18; 15 samples from non-diabetic OSA patients and 3 samples from diabetic OSA patients). Significant differences between groups are denoted by “*” p < 0.05, and inner group differences are denoted by “+” p < 0.05. ... 44
Figure 4.16: Plasma relative protein abundance of PRDX2 20 kDa monomeric form in
samples, in Snorers (n = 18; 16 samples from non-diabetic snorers and 2 samples from diabetic snorers) and OSA group (n = 18; 15 samples from non-diabetic OSA patients and 3 from diabetic OSA patients, and after CPAP treatment (n = 18; 15 samples from non-diabetic OSA patients and 3 samples from diabetic OSA patients). Significant differences between groups are denoted by “*” p < 0.05. ... 44
Figure 4.17: Plasma relative protein abundance of PRDX2 20kDa and 25 kDa
monomeric forms for diabetic (Diabetes+) and non-diabetic (Diabetes-) patients, in Snorers (n = 18; 16 samples from non-diabetic snorers and 2 samples from diabetic
xviii snorers) and OSA (n = 18; 15 samples from non-diabetic OSA patients and 3 samples from diabetic OSA patients) groups, and after CPAP treatment (n = 18; 15 samples from non-diabetic OSA patients and 3 samples from diabetic OSA patients). Significant differences between groups are denoted by “*” p < 0.05, and inner group differences are denoted by “+” p < 0.05. ... 45
Figure 4.18: Plasma results of PRDX SO2/3 Western blot detection using the ECL system
and imaging by X-ray processor. Samples were separated on SDS-PAGE gels before transfer to PVDF membranes. Detection of proteins was via using the Ab-PRDX SO2/3
(dilution 1:2000 – methods, see page 29). The samples were grouped into 18 different groups for ease of analysis. The order of samples in each group is always the same and is indicated in samples 1, 2, 3, 10, 11 and 12 – Control (C), non-treated OSA (OSA) and post CPAP treatment (CP) samples, n=54. One monomeric and one higher-order PRDX SO2/3 forms can be observed. ... 46
Figure 4.19: Plasma relative protein abundance of PRDX SO2/3 25 kDa and 50 kDa
hyperoxidized forms in samples, in Snorers (n = 18) and OSA (n = 18) groups, and after CPAP (n = 18) treatment. Significant differences between groups are denoted by “*” p<0.05. ... 47
Figure 4.20: Plasma relative protein abundance of PRDX SO2/3 25 kDa hyperoxidized
monomeric form in samples, in Snorers (n = 18; 16 samples from non-diabetic snorers and 2 samples from diabetic snorers) and OSA group (n = 18; 15 samples from non-diabetic OSA patients and 3 from non-diabetic OSA patients, and after CPAP treatment (n=18; 15 samples from non-diabetic OSA patients and 3 samples from diabetic OSA patients). Significant differences between groups are denoted by “*” p < 0.05. ... 47
Figure 4.21: Plasma relative protein abundance of PRDX SO2/3 50 kDa hyperoxidized
form in samples, in Snorers (n = 18; 16 samples from non-diabetic snorers and 2 samples from diabetic snorers) and OSA group (n = 18; 15 samples from non-diabetic OSA patients and 3 from diabetic OSA patients, and after CPAP treatment (n = 18; 15 samples from non-diabetic OSA patients and 3 samples from diabetic OSA patients). Significant differences between groups are denoted by “*” p < 0.05. ... 48
Figure 4.22: Plasma relative protein abundance of PRDX SO2/3 25kDa and 50 kDa
hyperoxidized forms for diabetic (Diabetes+) and non-diabetic (Diabetes-) patients, in Snorers (n = 18; 16 samples from non-diabetic snorers and 2 samples from diabetic
xix snorers) and OSA (n = 18; 15 samples from non-diabetic OSA patients and 3 samples from diabetic OSA patients) groups, and after CPAP treatment (n = 18; 15 samples from non-diabetic OSA patients and 3 samples from diabetic OSA patients). Significant differences between groups are denoted by “*” p < 0.05. ... 49
Figure Annex II. 1: Calibration line used to calculate the volume of RBC sample needed
to adjust to 70 μG ... 66
Figure Annex II. 2: Calibration line used to calculate the volume of Plasma sample
needed to adjust to 40 μG ... 67
Figure Annex V. 1: Example of a membrane colored with Ponceau solution after
transference. Hemoglobin band was used to normalize areas obtained from final WB results of RBC PRDX2 and PRDX SO2/3 quantification using ImageJ software. ... 77
Figure Annex V. 2: Example of a membrane colored with Ponceau solution after
transference. Albumin band was used to normalize areas obtained from final WB results of Plasma PRDX2 and PRDX SO2/3 quantification using ImageJ software. ... 77
xx
List of Tables
Table 1.1: Apnea/Hypopnea Index19 ... 2
Table 1.2: Nocturnal and daytime symptoms for Obstructive Sleep Apnea 7 ... 7
Table 1.3: Features commonly associated with OSA, useful for diagnosis 16 ... 9
Table 3.1: Dilution of primary and secondary antibodies used in this study. ... 30 Table 4.1: Correlations between RBC PRDX2 and PSG/Clinical parameters concerning
non-treated patients ... 50
Table 4.2: Correlations between RBC PRDX2 and PSG/Clinical parameters after CPAP
treatment ... 51
Table 4.3: Correlations between plasma PRDX2 and PSG/Clinical parameters
concerning non-treated patients ... 52
Table 4.4: Correlations between plasma PRDX2 and PSG/Clinical parameters
concerning non-treated patients ... 52
Table Annex II. 1: Absorbance values for standards. ... 66 Table Annex II. 2: Volume needed to adjust each RBC sample to 70 μG of total protein
... 66
Table Annex II. 3: Absorbance values for standards. ... 67 Table Annex II. 4: Volumes needed to adjust each Plasma sample to 40 μG of total
protein ... 67
Table Annex III. 1: Demographic, Polysomnographic and Analytical Characterization 68 Table Annex IV. 1: RBC PRDX2 correlations with PSG/Clinical parameters for snorer
group ... 70
Table Annex IV. 2: RBC PRDX2 correlation with PSG/Clinical parameters for snorer
group without diabetes ... 70
Table Annex IV. 3: RBC PRDX2 correlations with PSG/Clinical parameters for OSA group
... 71
Table Annex IV. 4: RBC PRDX2 correlations with PSG/Clinical parameters for
non-treated OSA group without diabetes ... 71
Table Annex IV. 5: RBC PRDX2 correlations with PSG/Clinical parameters for diabetic
xxi
Table Annex IV. 6: RBC PRDX2 correlations with PSG/Clinical parameters for
non-diabetic OSA patients after CPAP treatment... 72
Table Annex IV. 7: RBC PRDX2 correlations with PSG/Clinical parameters for diabetic
OSA patients after CPAP treatment ... 73
Table Annex IV. 8: Plasma PRDX2 correlations with PSG/Clinical parameters for snorer
group ... 74
Table Annex IV. 9: Plasma PRDX2 correlations with PSG/Clinical parameters for
non-treat OSA group ... 74
Table Annex IV. 10: Plasma PRDX2 correlations with PSG/Clinical parameters for
non-treated OSA group without diabetes ... 75
Table Annex IV. 11: Plasma PRDX2 correlations with PSG/Clinical parameters for
non-treated diabetic OSA group ... 75
Table Annex IV. 12: Plasma PRDX2 correlations with PSG/Clinical parameters for
non-diabetic OSA patients after CPAP treatment... 76
Table Annex IV. 13: Plasma PRDX2 correlations with PSG/Clinical parameters for
diabetic OSA patients after CPAP treatment... 76
1
1 Introduction
Obstructive sleep apnea (OSA) is a common public health disease, inducing nocuous effects on metabolic and cardiovascular health, being thus intimately related to major consequences as arterial hypertension (AHT), stroke and diabetes. The continuous positive airway pressure (CPAP) is considered to be the most successful therapy for OSA, reducing associated co-morbidities and societal consequences. However, chronic consequences of OSA may not be fully reversed by CPAP treatment. Therefore, studies are needed in order to better understand metabolic changes associated to OSA, and to analyze CPAP’s efficiency on these patients. The present thesis is focused on identifying means by which OSA can be identified and monitored. A proteomic approach was used to assess the molecular effect of the therapeutic benefit and/or side effects of CPAP treatment in red blood cells and plasma of OSA patients with comorbidities, namely diabetes. The thesis work targets a potential candidate biomarker – Peroxiredoxin II – reported as a promising marker for OSA severity and/or treatment monitoring. In the introduction a general overview of the disease is given followed by a brief consideration about biomarkers and then a more detailed description of proteomics and Peroxiredoxin II as a protein biomarker for OSA.
1.1 Obstructive Sleep Apnea
Obstructive sleep apnea (OSA) is a sleep disorder characterized by recurrent episodes of upper airway collapse during sleep. There is an incomplete obstruction of the pharynx during sleep, which causes cessation (apnea) or significant decrease (hypopnea) in airflow, in the presence of breathing effort 1. OSA can be defined as a decrease in the oro-nasal airflow of at least 50% and at least 10 seconds, generally associated with reduced levels of arterial O2 and increased blood levels of CO22. These
episodes of airway obstruction are usually followed by arousals. As a consequence, of OSA, patients have sleep fragmentation and excessive daytime sleepiness 3.
Hypopnea is defined as a 50 to 80% reduction in airflow, and originates from similar mechanisms to those that produce apnea. It may result in a reduction in
2 respiratory efforts due to a partial obstruction of the upper airway, and can also lead to increased blood levels of CO2 and reduced levels of arterial O2.
Snoring is also a form of partial airway obstruction, which results from a flow restriction and an increase in respiratory efforts, and just like apnea and hypopnea, leads to hypoventilation and/or sleep arousal 4.
The apnea/hypopnea index (AHI) describes the total number of apnea/hypopnea episodes per hour of sleep, which is usually <5 in normal individuals. The severity of OSA is indicated by AHI scores of 5–15 for mild, 15–30 for moderate and >30 for severe, and patients are characterized accordingly 5 as shown in table 1.1.
Table 1.1: Apnea/Hypopnea Index6
Mild 5 to 15 events per hour
Moderate 15 to 30 events per hour
Severe More than 30 events per hour
1.2 Etiology and Pathogenesis
Sleep and its interaction with the respiratory control system destabilize the capacity of the upper airway to drive air into the lungs 4. The loss of muscle tone promotes upper airway collapse during sleep, causing intermittent hypoxia, hypercapnia, sympathetic nervous system activation, and arousal from sleep 7.
Among the causes of apneic events, we may highlight a reduced excitatory stimulation, an active suppression of breathing due to inhibitory reflexes (coming either from the cardiovascular system, lungs and chest wall, or other somatic and visceral afferents), and loss of reflexes which normally ensure the maintenance of ventilation and do not rely on chemical control. Airway patency can also be compromised by a small or posterior placed mandible, redundant soft palate, tonsillar hypertrophy, and pharyngeal fat deposition. The recurrent apnea results from the
3 instability of the respiration feedback control, which causes the venting to occur in cycles, rather than remaining at a constant level 4,7.
The respiratory efforts against the obstruction cause large increases in cerebral blood flow and in blood pressure, since it increases the cardiac output 4.
It has been shown that sleep-disordered breathing is associated with daytime hypertension, so other pathogenic mechanisms must be active. For example, obesity causes pharyngeal fat deposition, which is a major factor. Increased SNS (Sympathetic Nervous System) activity, insulin resistance, systemic inflammation, altered oxidative stress and endothelial dysfunction are also factors that promote daytime hypertension, and are, therefore, intimately related to OSA’s pathogenic mechanisms7.
1.3 Epidemiology
Despite spending about a third of our lives asleep, it is only recently that the impact of the physiological state on breathing began to be better known. In fact, only in the 70s did the term " sleep apnea syndrome " emerge 8.
Obstructive sleep apnea is widely recognized as a major public health concern with numerous societal consequences, such as increased cardiovascular morbidity, heightened risk for metabolic dysfunction, and behavioral and cognitive deficits leading to impaired work performance and productivity 5,9. The overall incidence is approximately 2% to 4%, with a predominance of males from 2:1 to 4:1. The prevalence of OSA varies widely, ranging from 14.7% to 36.5%, depending on gender and nationality. OSA also creates a huge economic burden when compared to other chronic diseases 9.
1.3.1 Risk Factors
The most common risk factors for OSA are: obesity, age over 50 and a neck circumference of more than 41 cm for females and more than 43 cm in males 10. Gender, ethnicity, craniofacial abnormalities, genetic factors, as well as alcohol and smoking, are also important risk factors to be considered in OSA patients 11.
4
1.3.1.1 Age and Gender
Several epidemiologic studies show that more than 50% of adults over the age of 65 have some form of chronic sleep-related complaint. This is, in part, due to the variability in sleep parameters, being related with the high prevalence of OSA in advanced ages 11. An early study reported that 70% of men and 56% of women aged between 65 and 99, had obstructive sleep apnea defined as an AHI ≥ 10 events per hour 12.
Despite OSA being more common in men than women, it is still not clear why 13.
In men, obstructive sleep apnea (AHI>10 events/h) is present in 3.2% of 20 to 44 year olds, 11.3% in 45 to 64 year olds, and 18.1% of those in the 61 to 100 years old age group. On the other hand, in women, the prevalence of OSA (AHI > 15 events/h) is 0.6% in ages of 20 to 44 years, 2.0% in 45 to 64 years, and 7.0% in groups of 61 to 100 years old 14,15. Since men and women are anatomically different, this prevalence could be attributed to anatomical and functional properties of the upper airways, which might cause different responses in the ventilatory effort and/or arousals from sleep. For instance, imaging studies have revealed that men have increased fat deposition around pharyngeal airway when compared with women 13.
Also, hormonal differences play a role in the predisposition to abnormal breathing during sleep, and may help to explain the high prevalence of OSA in men, and women’s susceptibility in the post- menopausal phase, to also develop this disease11,13.
1.3.1.2 Obesity
Body weight has been identified as the major risk factor for obstructive sleep apnea by many epidemiologic studies around the world. More than 60% of patients referred for a diagnostic sleep evaluation exhibit, excessive body weight 11,16. It is known that an increase in body weight may lead to the development of moderate to severe OSA, accelerating the progression of the disease 11.For instance, fat deposition around the abdomen often leads to a reduction of the residual capacity. A reduced lung volume causes tethering effects on the upper airways, since it is associated with diminished oxygen stores, which may contribute to ventilator control instability. Finally, obesity has been associated with functional deterioration of the upper airway
5 muscles, also caused by fat deposition around the neck, which induces a reduction in functional residual capacity with a resultant decrease of the caudal traction on the upper airway 16.
Body weight is a critical factor, since the pathophysiology of OSA is directly linked with obesity, with an estimated 58% of moderate to severe cases being caused by a BMI greater than or equal to 25 kg/m2. In order to minimize the current epidemic of obesity and, consequently, OSA, it is fundamental to find effective strategies to achieve long-term and sustainable weight loss along with life quality improvement 11.
1.3.1.3 Genetic and Anatomical factors
Studies using linkage analysis have provided a potential association between specific areas of the genome and OSA pathogenesis, also showing a common hereditary basis to the development of OSA, regardless of whether the patient is obese or not 16. Still, no causative gene for OSA has been identified until now, but work is underway. Symptoms regarding apnea and the number of apneas per hour of sleep are present at a frequency twice as higher in families with affected members than in control families combined by age, gender and socio-economic level 17.
However, differences in craniofacial morphology may explain some of the changes in the risk of obstructive sleep apnea, in different ethnic groups 11. Craniofacial dimorphism is associated with a subsequent positioning of the tongue base, which restricts the upper airways 18.
1.3.1.4 Smoking and drinking habits
Smoking and drinking habits have been suggested as possible risk factors for OSA11. Current smoking habits are associated with a higher prevalence of snoring and sleep-disordered breathing, and may also worsen the degree of these breathing disorders, when compared with those who have never smoked 13. Even exposure to second-hand smoke has been independently linked with habitual snoring 11.This can be explained by cigarette-induced airway inflammation and damage changing the structural and neural properties of the upper airway, increasing thus the risk of collapsibility during sleep 11,13. On the other hand, alcohol relaxes upper airway dilator muscles, which can prolong apnea duration and worsen the hypoxemia severity.
6 Alcohol consumption may also suppress arousals and increase the frequency of occlusive episodes. However, the underlying mechanisms are still not well understood
13
7
1.4 Symptoms
Symptoms for OSA include snoring, excessive daytime fatigue, apneas while sleeping, morning headaches, concentration problems, forgetfulness, depression, and sexual dysfunction, among others associated with metabolic disturbances. OSA remains mostly undiagnosed, since patients only come to the attention of a clinician when they complain of daytime sleepiness, or when their bed partners witness apnea episodes 19.
Table 1.2: Nocturnal and daytime symptoms for Obstructive Sleep Apnea 8
1.5 Consequences
The recurrent episodes of apnea-hypopnea and arousals during sleep may cause a series of metabolic changes, leading to cardiovascular and neuronal problems, which will condition a significant increase in morbidity and possibly mortality 8.
Nocturnal symptoms Daytime symptoms
Nonrestorative sleep
Frequent loud snoring
Witnessed apneas, which often interrupt the snoring
Gasping and choking sensations that arouse the patient from sleep
Nocturia
Insomnia
Restless sleep, with experience of frequent arousals and tossing or turning during the night
Morning headache
Dry or sore throat
Daytime fatigue/tiredness
Cognitive deficits; memory and intellectual impairment (short-term memory, concentration)
Decreased vigilance
Personality and mood changes, including depression and anxiety
Sexual dysfunction, including impotence and decreased libido
8
1.5.1 Arterial hypertension
OSA’s association with AHT is frequent. An estimated 30-50% of patients with hypertension have OSA, while 20- 70% of patients with OSA have hypertension. It is known that obesity and age are risk factors for hypertension, and as these factors are very often present in patients with OSA, AHT was initially attributed to obesity and age. However, recent studies have shown that age, obesity and OSA are independent and additive risk factors of hypertension.
1.5.2 Heart function
In OSA, cardiac output decreases during sleep. This is due to negative intrathoracic pressure during the episodes of apnea, which can be significantly improved with CPAP treatment. OSA alone does not seem to cause heart failure. However, some studies showed that OSA may be an important risk factor for the development and aggravation of ischemic heart disease. Also, HTA, hypoxia and increased sympathetic activity during sleep seem to accelerate atherosclerosis. On the other hand, in the presence of an ischemic heart disease, hypoxia caused by apneas may lead to ischemia and cause angina, myocardial infarction or severe arrhythmias. CPAP treatment was shown to improve ischemic cardiopathy 8. Essentially, ischemia, caused by hypoxia, might stimulate proteins which, in the presence of O2 (in
reperfusion), may overproduce free radicals, which directly cause tissue damage20.
1.5.3 Cerebrovascular diseases
Patients with OSA have also increased morbidity and mortality of stroke. These patients cerebral blood flow decreases during sleep, whereas intracranial pressure increases in a cyclic manner, reaching its peak at the end of each apnea event.
1.5.4 Pulmonary hypertension
Pulmonary hypertension occurs in about 15% to 25% of patients with OSA. For PHT diagnosis, it is necessary to have a chronic respiratory failure due to a respiratory disease, most often Chronic Obstructive Pulmonary Disease (COPD) or major obesity 8.
9
1.6 Diagnosis
Several associated features should suggest the diagnosis of obstructive apnea-hypopnea sleep syndrome.
Table 1.3: Features commonly associated with OSA, useful for diagnosis 17
Features commonly associated with apnea-hypopnea obstructive syndrome sleep
Obesity Mandibular/jaw hypoplasia Systemic hypertension Pulmonary hypertension Tonsil hypertrophy Sleep fragmentation
Sleep associated arrhythmias
Night angina
Gastroesophageal reflux
Compromised quality of life
Routine laboratory tests, such as pulmonary function tests, thyroid function, blood gas analysis, echocardiography or chest X-ray, are generally not helpful in making the diagnosis. Polysomnography is distinguished from sleep studies since it includes sleep staging, which is meant to include an Electroencephalogram (EEG), Electrooculogram (EOG), and a submental Electromyogram (EMG). Additional parameters of sleep include ECG, airflow, ventilation and respiratory effort, gas exchange by oximetry, extremity muscle activity, motor activity-movement, extended EEG monitoring, penile tumescence, gastroesophageal monitoring, snoring, body positions, etc. 21 Given the various symptoms and signs, clinical aspects alone do not allow the prediction with certainty of which patients will or not have OSAs. Thus, the clinical aspect allows only the selection of which patients are indicated for a polysomnographic recording, and only these recordings can truly diagnose OSA.
10
1.7 Treatment
Nasal continuous positive airway pressure (CPAP) therapy is undoubtedly the treatment of choice for symptomatic OSA patients and/or patients with associated heart or cerebrovascular diseases. However, despite its efficacy, treatment compliance is limited due to the side effects associated with the use of nasal CPAP and to the lack of perception of its benefit by affected individuals 22.
CPAP is effective both for the treatment of long-term obstructive sleep apnea and for the prevention of snoring. The effects depend on the positive level of pressure applied on the respiratory system, as the ideal pressure levels differ among patients.
Even if CPAP is suspended, its effects might last for days, so short interruptions of therapy for example, due to acute clinical diseases or even to have surgery, are well tolerated.However, some failures may occasionally occur: sometimes due to very low pressure, others due to an increase in the pressure required to prevent apnea. Factors such as alcohol consumption, hypothyroidism, and obesity can aggravate the stability of the airways.
Generally, patients accept CPAP therapy very well. However, most studies indicate that some patients (approximately 30%) do not accept it as well 4. Side effects of the therapy may include a feeling of breathlessness, nasal dryness or rhinitis, ear pain and conjunctivitis. It is important to mention that CPAP’s beneficial effects are controversial. Most studies show CPAP contributes to restore an OSA patient’s health, by helping them reduce breathing efforts during the night, and this reduces daytime sleepiness and also improves the quality of life. On the other hand, OSA’s patients with other major comorbidities and metabolic problems may have trouble using CPAP treatment. This is a controversial matter still under discussion 23,24,25. Absolute contraindications to nasal CPAP therapy are complete nasal obstruction and fracture of the communicating skull base.
Other options for OSA treatment can be considered, such as intraoral devices, or even surgical interventions, depending on the causes underlying the disease 17.
11
1.8 Oxidative Stress and OSA
In living cells, oxidation-reduction (redox) reactions are present in fundamental processes of redox regulation, named ‘redox signaling’ and ‘redox control’. Events like intermittent hypoxia often lead to a disturbance in this homeostatic balance, causing oxidative stress, and the consequent formation of reactive oxygen and nitrogen species (ROS/RNS) 26. As mentioned before, OSA is characterized by a repeated obstruction of the upper airways, during nighttime sleep 27, causing episodes of intermittent hypoxia, which over time may lead to tissue injury in areas such as the cardiac muscle, lung and brain tissues, among others, causing direct damage 20.
Although several mechanisms are involved, such damage is mainly attributed to the production of reactive oxygen species (ROS) during re-oxygenation. These are highly reactive molecules, which interact with lipids, proteins, and nucleic acids, and as such, are responsible for the development of several pathologies 27,28.
Even though they cause oxidative damage, these molecules play a major role in cell signaling mechanisms, acting as “redox switches”. For instance, ROS activate an inflammatory cascade, resulting in the increase of proinflammatory cytokines and the expression of adhesion molecules. Therefore, the exacerbated production of these reactive species may result in endothelial dysfunction and, thereby, cause the predisposition to several morbidities in patients with untreated OSA 29.
For this reason, oxidative stress is now considered a major contributor to the cardiovascular consequences observed in this group of patients 30.
Red blood cells (RBCs) are particularly exposed to oxidative stress, mainly due to hemoglobin autoxidation and subsequent constant flux of superoxide (O2-). Therefore,
intraerythrocytic peroxidase activity is critically relevant, as it plays and important protective role against oxidative stress-induced damage 31.
1.9 Comorbidities in study: Diabetes Mellitus
Diabetes mellitus is an endocrine disease involving hormones, namely insulin, produced by the islets of Langerhans in the pancreas. This is a disease of great importance since at present it is a frequently seen disease, almost endemic, affecting
12 all countries worldwide, all ethnic groups and all social classes. The International Diabetes Federation (IDF) estimates that currently about 246 million people have diabetes worldwide, 46% of whom are aged between 40 and 50 years. By 2025, it is estimated that this number will increase up to 380 million. The most prevalent is type 2 and it currently affects 5.9% of the world adult population, with almost 80% coming from developing countries. The IDF estimates the prevalence of diabetes in Portugal to be about 6-8%.
Diabetes is considered an evolutionary disease affecting quality of life and life expectancy. Chronic complications caused by diabetes affect all organs and systems. It is considered the leading cause of blindness and renal failure in developed countries, and also the most important cause of lower limb amputations and heart and brain macrovascular disease. Neuropathy is another frequent complication which, together with the other outcomes, is highly disabling. The main cause of death in people with diabetes is cardiovascular complications (including stroke). About 3.8 million people die each year from diabetes, which is equivalent to the number of people dying from AIDS 32.
1.10 Classification of Diabetes Mellitus
The classification of Diabetes Mellitus adopted in Portugal is based on the standards published by the World Health Organization (WHO) in 1999, defining the classification of diabetes mellitus and other categories of glucose intolerance.
Type 1 diabetes mellitus (T1DM) is a specific autoimmune disease of the pancreas. It can appear at any age, but is most common in the first decades of life, with a peak of incidence at 13-15 years. This form of diabetes occurs in about 5-10% of all people who suffer from diabetes. It is believed that there is a genetic predisposition and a precipitating factor for this type of diabetes to develop. This association results in the activation of various immune mechanisms leading to progressive autoimmune damage of the beta cells of the pancreatic islets, starting with a progressive decrease, until exhaustion, of insulin production 32.
Type 2 diabetes mellitus (T2DM) is a heterogeneous disease that results from genetic, environmental and metabolic changes, which contribute to a key defect:
13 insulin resistance and compensatory, but insufficient, secretion of insulin by pancreatic beta cells 32.
Concerning the cellular mechanisms of insulin resistance in type 2 diabetes, there is defective glycogen synthesis, as a consequence of multiple factors, such as the level of glucose transport (GLUT4), hexokinase II and glycogen synthetase activity. Also free fatty acids (FFA) play a key role in the induction of insulin resistance, in obesity and type 2 diabetes. Obesity and physical inactivity, which follow type 2 diabetes in over 80% of cases, are factors which worsen insulin resistance and are thus involved in the growing epidemics of type 2 diabetes.
Signs and symptoms of type 2 diabetes result either from the lack of insulin or from the lack of its action, and include polyuria, polydipsia, polyphagia and weight loss. These classic signs may not be very obvious, and the disease might only be diagnosed late, through the manifestation of chronic complications.
Type 2 diabetes can be prevented or delayed in people at risk (obese, elderly or with diabetic first-degree relatives). Prevention is based on an appropriate and continued exercise program, and a careful diet. Early diagnosis and timely effective treatment are crucial. Nowadays there are a set of oral drugs (oral antidiabetics) that can be used alone or in combination, in order to improve their efficiency. Insulin should also be used whenever oral drugs are unable to correct the disease. Since diabetes is often associated with hypertension and dyslipidemia, these changes must be treated in order to reduce cardiovascular risk 32.
1.10.1
OSA and Type2-Diabetes
OSA is common in people with type 2 diabetes. Given the high prevalence of OSA and type 2 diabetes in older adults, the presence of one of these conditions prompt the evaluation of the other, since up to 50% of patients with OSA have type 2 diabetes, and approximately 50% of patients with type 2 diabetes have moderate to severe OSA. It is known that as age increases, the predisposition for developing type 2 diabetes also increases, as there is a decrease in insulin sensitivity and insulin secretion by the pancreatic beta-cells. This is mainly attributed to fat accumulation and also a reduction in mitochondrial function in muscle 33.
14 Figure 1.1: Interactions between age, OSA and type 2 diabetes 33
Age seems to be the main common factor behind both OSA and type 2 diabetes development (Figure 1.1). An increase in age is associated with impairments in sleep quality, and thus increase susceptibility to OSA. Also, it is more likely for older people to develop insulin resistance, glucose intolerance and type 2 diabetes, since intermittent hypoxia and sleep fragmentation play a fundamental role in its development 33. The mechanisms through which intermittent hypoxia and sleep fragmentation may affect glucose metabolism are illustrated in figure 1.2.
Figure 1.2: Association and causal links for OSA and metabolic abnormalities, leading to type 2 diabetes 33.
15 OSA may accelerate the age-related progression of glucose intolerance, which eventually leads to type 2 diabetes. Also, OSA may cause an increase in oxidative stress, as well as in the sympathetic nervous system activation, which can lead to a decrease in insulin sensitivity and secretion.
OSA’s severity has, concomitantly, been associated with higher fasting glucose and glucose levels, reinforcing the idea that patients with OSA seem to have a higher prevalence of type 2 diabetes and metabolic syndrome. Surprisingly, some studies on CPAP treatment for OSA fail to demonstrate consistent improvements neither in metabolic function, nor in glycemic control. But it is important to notice that these studies may have methodological flaws such as small sample size, limited duration of treatment or even poor adherence to CPAP therapy, and are therefore conclusions concerning the metabolic effects of CPAP in OSA patients may require further investigation 33.
1.11 Biomarkers Discovery
The definition of a biomarker is a characteristic that is objectively measured and evaluated as an indicator of normal biological processes, pathogenic processes, or pharmacological response to therapeutic intervention (The Biomarker Definition Working Group, 2001).
The term “biomarker” was first mentioned in 1973 by the journal Space Life Science, but its definition has suffered many alterations until 1980, when biomarkers were employed as a parameter to assess a given biological or clinical process. Still, an incorrect understanding of this definition often leads to ambiguity and its common misuse 34.
Biomarkers are used daily in a clinical setting to assess disease diagnosis, prognosis and risk, as well as for monitoring therapeutic efficiency. For example, the diagnosis of diabetes is given through an evaluation of serum glucose levels, one of the most widely known examples of a clinical biomarker in use, nowadays. In a clinical perspective, biomarker refers to a broad subcategory of medical signs, which are characteristics of biological processes that can be measured accurately and reproducibly 35.
16 Biomarkers can be placed in different categories, depending on their utility: diagnostic, early detection (screening), monitoring, prognostic, safety, and efficacy biomarkers 36. In regards to the stages of biomarker discovery and establishment, this is distinguished by three different ranges: exploratory biomarkers, probable valid biomarkers and known valid biomarkers 37. The process of biomarker development, i.e., discovery, validation, and regulatory approval, is a long, arduous and complex process.
A wide range of technologies can be utilized for detection of biomarkers, including genomic, epigenomic, proteomic and metabolomic approaches 38. In the present thesis validation of a protein biomarker, Peroxiredoxin II, is described and so a more extensive consideration of this type of biomarker is now provided. In disease biomarker discovery, proteomics have been popular in blood, either in plasma, serum or blood cells. Despite proteomics technologies being in constant development, the most popular procedures are two-dimensional gel electrophoresis (2-D gel) and liquid chromatography (LC) for protein separation, both followed by tandem mass spectrometry (MS/MS) for protein identification 19.
Proteomics refers to the set of technologies applied to explore the proteome, allowing evaluation of hundreds to thousands of proteins at specific timings and under specific conditions. A proteomics approach has innumerous advantages such as gathering information regarding changes in protein abundance, post-translational protein modifications (PTMs), as well as protein–protein cell and tissue interactions, which can be crucial to understanding the true molecular phenotype of a disease, and helping uncover disease biomarkers and disease targets for new drug development 19.
1.11.1
Discovery phase
The first stage of this study was an early biomarker discovery phase, in which RBC samples from OSA patients were analyzed by a 2D-DIGE based proteomic technique, followed by mass spectrometry, for protein identification and protein annotation and classification using bioinformatics tools 39. Results from this early study led to several proteins to be identified and noted as differentially expressed, one of which, PRDX2, will go through a rigorous validation phase.
17
1.12 Biomarker Validation
Peroxiredoxin II has been reported to be a good candidate biomarker for OSA severity and treatment monitoring 39. However, further validation is required. Herein we will proceed for PRDX2 validation as candidate biomarker, regarding its association with OSA associated with comorbidities, namely diabetes, and also study CPAP’s molecular implications on these patients, to test its true efficiency.
1.12.1
Biomarkers in OSA
Previous studies reported several differentially expressed proteins in OSA patients, before and after CPAP treatment, one of which was PRDX2, and it was considered to be the most relevant for further validation as candidate biomarker for OSA severity and/or treatment monitoring 39.
(PRDXs) are a large family of thiol-containing peroxidases. Their primary function relies on their peroxidase activity, which contributes to the control of endogenously produced peroxides, in eukaryotes 40. Besides their role in antioxidant activity, PRDXs are shown to be involved in other cellular functions, such as proliferation, differentiation 41, intracellular signaling 42, and chaperone activity 40, and have also been shown to play an important role in the circadian cycle 43. Mammalian cells express six PRDX isoforms, which can be found at several cellular compartments 41 – PRDX1, 2 and 6 can be found in the cytosol, PRDX3 in the mitochondrial matrix, PRDX4 in the endoplasmic reticulum, and PRDX5 can be found in mitochondria, peroxisomes and in the cytosol 44. In human erythrocytes, Peroxiredoxin II (PRDX2) is known to be the third most abundant protein 40.
1.12.1.1 Peroxiredoxin II
2-Cys Peroxiredoxins (PRDXs) are typically present as non-covalent homodimers with a disulfide formation bound between the peroxidatic cysteine of one monomer with the resolving cysteine of another monomer 44.
Reduced PRDXs can be oxidized by a molecule of hydrogen peroxide that bind to their peroxidatic cysteine (SpH) sites, allowing the resolving cysteines (SrH) to form a disulfide bond (S-S) with them (Figures 1.3).