Island survivors: population genetic structure and
demography of the critically endangered giant
lizard of La Gomera, Gallotia bravoana
Gonzalez et al.
Gonzalez et al. BMC Genetics 2014, 15:121 http://www.biomedcentral.com/1471-2156/15/121
R E S E A R C H A R T I C L E
Open Access
Island survivors: population genetic structure and
demography of the critically endangered giant
lizard of La Gomera, Gallotia bravoana
Elena G Gonzalez
1,2*, Ivania Cerón-Souza
3,4, José A Mateo
5and Rafael Zardoya
1Abstract
Background: The giant lizard of La Gomera (Gallotia bravoana), is an endemic lacertid of this Canary Island that lives confined to a very restricted area of occupancy in a steep cliff, and is catalogued as Critically Endangered by IUCN. We present the first population genetic analysis of the wild population as well as of captive-born individuals (for which paternity data are available) from a recovery center. Current genetic variability, and inferred past demographic changes were determined in order to discern the relative contribution of natural versus human-mediated effects on the observed decline in population size.
Results: Genetic analyses indicate that the only known natural population of the species shows low genetic diversity and acts as a single evolutionary unit. Demographic analyses inferred a prolonged decline of the species for at least 230 generations. Depending on the assumed generation time, the onset of the decline was dated between 1200–13000 years ago. Pedigree analyses of captive individuals suggest that reproductive behavior of the giant lizard of La Gomera may include polyandry, multiple paternity and female long-term sperm retention.
Conclusions: The current low genetic diversity of G. bravoana is the result of a long-term gradual decline. Because generation time is unknown in this lizard and estimates had large credibility intervals, it is not possible to determine the relative contribution of humans in the collapse of the population. Shorter generation times would favor a stronger influence of human pressure whereas longer generation times would favor a climate-induced origin of the decline. In any case, our analyses show that the wild population has survived for a long period of time with low levels of genetic diversity and a small effective population size. Reproductive behavior may have acted as an important inbreeding avoidance mechanism allowing the species to elude extinction. Overall, our results suggest that the species retains its adaptive potential and could restore its ancient genetic diversity under favorable conditions. Therefore, management of the giant lizard of La Gomera should concentrate efforts on enhancing population growth rates through captive breeding of the species as well as on restoring the carrying capacity of its natural habitat.
Keywords: Microsatellite characterization, Genetic diversity, Multiple paternity, Historical demography, Canary Islands Background
Oceanic archipelagos are considered natural laboratories for the study of evolution [1,2]. Islands normally host a large number of endemic species that originated from the immigration of a few individuals from the continent and subsequent local evolution, adaptation, and diversification
[3-5]. Yet, the extraordinary biodiversity of islands is rela-tively fragile. Because island endemics have evolved in an environment protected by isolation, they are particularly susceptible to ecological threats (e.g., predation by or com-petition with invasive species, habitat loss, and human pressure) [6,7]. Additionally, loss of genetic diversity and inbreeding depression as a result of isolation and genetic drift, may contribute to the extinction of small populations on islands [6,8,9]. However, several studies [8-12] have shown that, after severe bottlenecks, some species have been able to persist for long periods of time with depleted heterozygosity levels. Ecological factors, such as the
* Correspondence:eguacimara@gmail.com
1New address: Departamento de Biodiversidad y Biología Evolutiva, Museo
Nacional de Ciencias Naturales, MNCN-CSIC, José Gutiérrez Abascal, 2, Madrid 28006, Spain
2CCMAR, Campus de Gambelas - Universidade do Algarve, Faro 8005-139, Portugal
Full list of author information is available at the end of the article
© 2014 Gonzalez et al.; licensee BioMed Central Ltd. This is an Open Access article distributed under the terms of the Creative Commons Attribution License (http://creativecommons.org/licenses/by/2.0), which permits unrestricted use, distribution, and reproduction in any medium, provided the original work is properly credited. The Creative Commons Public Domain Dedication waiver (http://creativecommons.org/publicdomain/zero/1.0/) applies to the data made available in this article, unless otherwise stated.
Gonzalez et al. BMC Genetics 2014, 15:121 http://www.biomedcentral.com/1471-2156/15/121
quality of the habitat, environmental stability, the purging effect of selection, and specific life history traits (e.g., mat-ing systems and generation lengths) could counteract the impact of declines on population genetic variation [12,13]. Thus, determining the long-term survival of an island en-demic species requires disentangling the relative effects of genetic and ecological (natural or human-mediated) drivers of extinction, and their relative contribution at different temporal and spatial scales, as well as characterizing poten-tial intrinsic species traits that could enhance or slow down extinction processes [6,8,9,14,15].
The genus Gallotia (Arnold 1973) (subfamily Gallotiinae) includes seven living lacertid species endemic to the Canary Islands that diversified upon colonization from the contin-ent back in the early Miocene, ca. 20 million years ago (MYA) [16-18]. The sister group of Gallotia is the genus Psammodromus [19] that is found in France, the Iberian Peninsula and Maghreb. A recent phylogeny based on mitochondrial (mt) DNA sequence data [17] showed that the giant lizard from Gran Canaria, Gallotia stehlini is the sister group of the remaining Gallotia species. The next branching in the tree is between the small-bodied Gallotia atlantica, which inhabits eastern Canary Islands (Fuerteventura and Lanzarote), and a clade that includes all species living in western Canary Islands. This latter clade is divided into two monophyletic groups, one of small-bodied lizards, Gallotia galloti and Gallotia caesaris, and another of giant lizards, Gallotia simonyi, Gallotia intermedia and Gallotia bravoana. Each of these three species of giant lizards is endemic to a single island, El Hierro, Tenerife, and La Gomera, respectively. Because of their restricted distri-bution, these three giant lizards are highly threatened and for many years they were thought to be Extinct (Figure 1A, [16-18,20]). More recently, a phylogeny based on combined mt and nuclear sequence data re-covered a very similar phylogeny that only differs in that G. galloti and G. caesaris do not form a monophy-letic group because the latter species is recovered as sister group of G. simonyi, G. intermedia and G. bra-voana, although with low statistical support [19].
Among the giant lizards, G. bravoana, has one of the smallest distributional ranges (Figure 1B) [21]. This spe-cies was rediscovered in 1999 (after being considered ex-tinct since the late 19th century) when a few living specimens were found on a very inaccessible cliff called La Mérica, near the town of Gran Rey on La Gomera Island [22]. Field surveys in 2009 revealed that the whole population included ca. 160 individuals that inhabited iso-lated patches of <20 Km2in total, restricted to La Mérica cliff [23]. Information on life-history traits of the species is still scarce, however it has been reported that individuals could live up to 60 years old, reach 40 cm of snout vent length, and produce between two to six eggs per clutch
[24]. Despite active conservation efforts during the last decade, the species is still considered threatened and listed as Critically Endangered by the IUCN (http://www. iucnredlist.org/details/61502/0), and yet very little is known about the genetics and demography of its only known population.
After its rediscovery, a conservation programme (within the framework of two EU LIFE projects) was established on the island, focused mainly on captive breeding and on census monitoring of the natural population. For the cap-tive breeding programme, nine founders (five females and four males) were captured in the wild between 1999 and 2000, and used to found the captive population. The foun-ders reproduced successfully for the first time in 2001 at the Recovery Centre of La Gomera Giant Lizard, resulting in about 40 captive-born offspring by 2005, and 121 captive-born individuals by 2010 [23].
Evidence from fossil records and known mummified re-mains of more than fourteen places distributed around the island (Figure 1B) suggests that the species inhabited most of the island of La Gomera from the coast throughout the xerophilic region (except in the laurisilva subtropical forest area at high altitudes) prior to the arrival of humans (ca. 2,500 years ago) [24,25]. At that time, it is believed that liz-ards were very common on the island and served as a food resource for both human and domestic animals [24]. Nat-uralist chronicles indicate that individuals were scarce by the 15th century, suggesting that the species was already rare on La Gomera Island at the time first Europeans ar-rived [24]. Thus, it has been postulated that the presence of humans coupled with the human-mediated introduction of predators caused a decline in numbers of G. bravoana and it’s currently restricted geographical distribution. How-ever, the possibility that decline could be the result of en-vironmental stochastic processes such as ancient climate changes or geological (volcanic) events producing long-term fragmentation and isolation cannot be discarded [26-29]. Genetic data could allow discriminating between either alternative hypotheses by estimating whether popu-lation decline predated or not the arrival of humans to the island. Moreover, the combination of ancient natural pro-cesses and more recent anthropogenic activities may have had a synergetic effect that could best explain the current threatened status of the species.
Given the critical conservation status of the species, the study of its genetic variation was necessary to establish the best management strategy. In particular, it was important to determine whether observed reduction in population size was accompanied by depletion in levels of genetic diversity as well as to detect genetic signatures of past demographic changes (e.g., bottlenecks) and date them. Moreover, genetic data could help clarifying how historical processes (e.g., sustained population isolation and genetic drift) and more recent events (e.g., human pressure), coupled with
Gonzalez et al. BMC Genetics 2014, 15:121 Page 2 of 16
the effect of life-history traits (e.g., mating behavior), con-tributed to the evolutionary history of the species.
Here, we analyze microsatellite data of G. bravoana for a total of 99 individuals (covering more than half of the total wild population and all 2001–2005 captive-born individ-uals) to estimate the overall amount of genetic variability of the species, and the allele frequency distribution between wild and captive individuals. Different coalescence-based methods were applied to examine major population demo-graphic changes and to estimate their timing. In addition, we combined information on pedigree and genetic data of captive animals from the breeding program to perform pa-ternity analyses and gain insights on the mating system of the species. Altogether, results presented here pro-vide the genetic background needed for understanding the recent evolutionary history of G. bravoana and for implementing successful management and conservation plans for the species.
Results
Microsatellite variation
Eight (GBR9, 11, 16, 20, 24, 26, 29 and 30) out of the eleven loci developed in this study were polymorphic in G. bravoana(Table 1A), and seven of these (except GBR26) were also polymorphic in related species (Additional file 1:
Table S1). Interestingly, locus GBR5 was polymorphic in re-lated species but not in G. bravoana (Additional file 1: Table S1). Furthermore, microsatellites GBR11 and 16 were monomorphic in wild samples. Allele frequency homogeneity tests indicated that the probability of de-tecting population structure with the eight polymorphic microsatellites was relatively high (the overall power estimate from all runs was 0.714 and 0.628 for the chi-square and Fisher exact tests, respectively), and statisti-cally significant (data not shown). When FSTwas set to zero (simulating no divergence among samples), the proportion of false significances (α error of type I) was in all cases lower than the intended value of 5%. Only one (GBR9 versus 24) out of the possible 28 linkage comparisons was significant (p <0.05, results not shown), and therefore all loci were consequently regarded as independent from each other. The majority of loci showed an overall departure from HWE due to significant heterozygote deficiency when all 99 samples were analyzed together (Table 1A). The number of al-leles for polymorphic loci varied from two to seven
(mean NA = 3.6) when all samples were analyzed
to-gether (Table 1A). Distribution of alleles found for each locus in the wild and captive populations was very similar (Additional file 1: Figure S1).
Figure 1 Map of the Canary Islands showing the distribution of theGallotia lizards. A) Distribution of the small-bodied (SB) and the giant (G) lizards. The species classified as“Critically Endangered” by the IUCN (2012) are also indicated with asterisks. B) Topographic map of La Gomera Island showing the locality for the G. bravoana natural population (La Mérica cliff, near the town of Gran Rey), and the fossil record sites for G. bravoana [24] (indicated with yellow dots).
Gonzalez et al. BMC Genetics 2014, 15:121 Page 3 of 16
Table 1 Summary data of microsatellites La Gomera Giant lizard (Gallotia bravoana) for all loci (A) for wild individuals (B) and for captive samples (C)
A) Loci Locus Repeat motif Tª (ºC) Primers sequence 5′-3′ Allele range N NA NAR HO HE FIS1 GenBank No.
GBR5 (CA)10 60 F: ATATTCATCCTCCCCGCACA 177 90 1 - - - - JX661253 F: GCATTGCGGTGAAAAAGG GBR9 (GT)17 60 F: TGGAGGCTTCTCTTGAGGCAAGA 138-160 98 4 3.9 0.143 0.153 0.066* JX661254 F: CCCCCTGCCTTATGAGTTTCG GBR11 (GTCT)6(ATCT)12 60 F: CTTAACCGTCTGGTTTGCATTA 196-215 96 2 2.0 0.000 0.021 1.000* JX661255 F: ACTGCACCCCATAGTTGTCTTT GBR15 (CA)27 60 F: ACTGGGGCTCAGTCTTTGTTT 140 91 1 - - - - JX661256 F: GCGTGTCTTGTGTATATGGAATC GBR16 (CA)14 60 F: GCAGATTTAATGGAACCTGGAG 224-238 91 2 2.0 0.011 0.033 0.664* JX661257 F: CAACAAAATGTGGAGTTTTAGCC GBR20 (GT)16(GTAA)7 60 F: CCACAACAAAACAAATGCAA 190-217 97 5 4.9 0.051 0.081 0.362* JX661258 F: GTCAGATCGACCCTCTCAGC GBR24 (CA)28 60 F: ACTTGCAGACTATTTTGGGTT 129-167 96 4 3.9 0.531 0.512 -0.039* JX661259 F: ACTCGCATCCTTCTGTTACAA GBR26 (CT)15(CA)13 60 F: TGGCCACACGAGATTATTCA 103-164 90 7 7.0 0.100 0.139 0.282* JX661260 F: ATATCGGGCCHTTTCACA GBR28 CA)26 60 F: ACAACACGCCTCAGTTCACA 195 89 1 - - - - JX661261 F: GCTGCCTTGAGTGAGTCTCC GBR29 (GT)110 60 F: GGCGTGCTTGTGTATAGGAA 132-174 97 3 2.9 0.010 0.031 0.666* JX661262 F: CCCAGCAGGGTTGCTTAG GBR30 (CA)13 60 F: CGCACACTTATCCTGTCGTG 198-206 98 2 2.0 0.010 0.030 0.664* JX661263 F: GACAGTGAGTCATGTGTGCATTT
Mean (all indiv.)2 84.9 3.6 3.6 0.107 0.125 0.142*
B) Wild individuals GBR9 56 3 2.9 0.180 0.179 -0.90 GBR20 56 2 2 0.053 0.052 -0.019 GBR24 54 2 2 0.494 0.490 -0.127 GBR26 53 4 4 0.074 0.073 -0.017 GBR29 59 2 1.9 0.036 0.036 1.000* GBR30 56 2 1.9 0.018 0.018 0.000
Mean (all wild indv.) 55,7 2.5 3.1 0.143 0.141 -0.052
Gonzalez et al. BMC Genetics 2014, 15 :121 Page 4 o f 1 6 http://ww w.biomedce ntral.com/1 471-2156/15/121
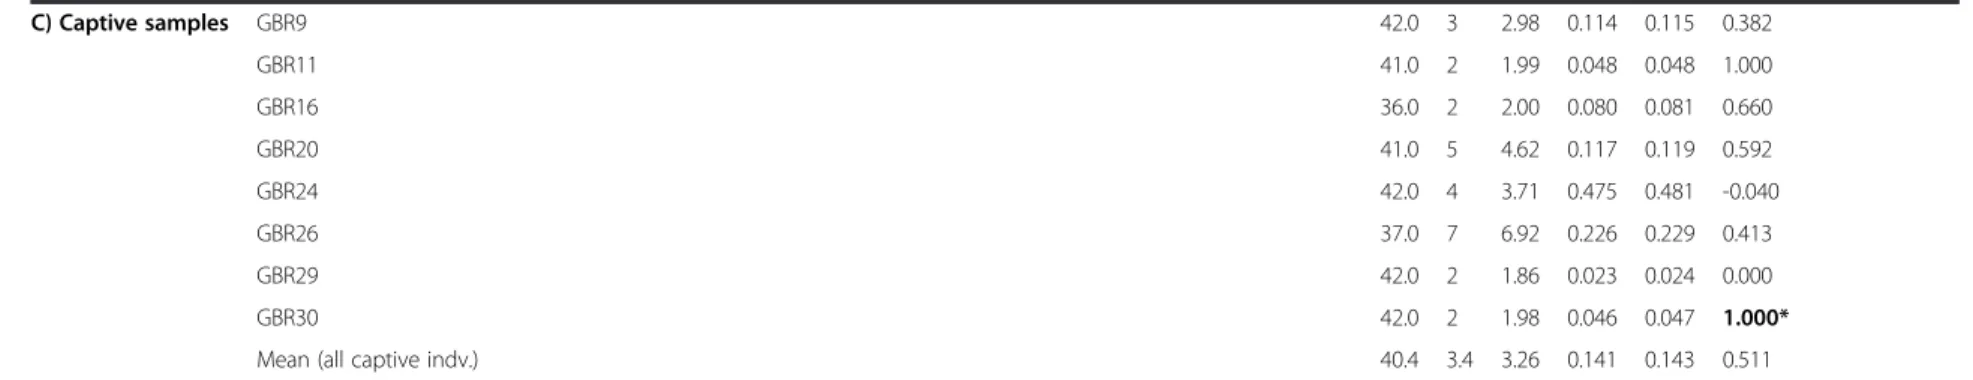
Table 1 Summary data of microsatellites La Gomera Giant lizard (Gallotia bravoana) for all loci (A) for wild individuals (B) and for captive samples (C) (Continued) C) Captive samples GBR9 42.0 3 2.98 0.114 0.115 0.382 GBR11 41.0 2 1.99 0.048 0.048 1.000 GBR16 36.0 2 2.00 0.080 0.081 0.660 GBR20 41.0 5 4.62 0.117 0.119 0.592 GBR24 42.0 4 3.71 0.475 0.481 -0.040 GBR26 37.0 7 6.92 0.226 0.229 0.413 GBR29 42.0 2 1.86 0.023 0.024 0.000 GBR30 42.0 2 1.98 0.046 0.047 1.000*
Mean (all captive indv.) 40.4 3.4 3.26 0.141 0.143 0.511
N= number of individuals assayed. NA= number of alleles per locus. NAR=allelic richness standardized to the smallest sample size using the rarefaction method of FSTAT 2.9.3 [73]. expected (HE) and observed (HO)
heterozygosities. FIS= Wright’s statistics. 1
Bold FISvalues are significant probability estimates after q-value correction (*p<0.05). 2
The mean values were calculated only with the polymorphic loci data.
Gonzalez et al. BMC Genetics 2014, 15 :121 Page 5 o f 1 6 http://ww w.biomedce ntral.com/1 471-2156/15/121
Genetic diversity and population structure of the wild population
The amount of genetic variability of the wild population was very low (mean observed heterozygosity, HO= 0.143; Table 1B). Yet, the mean value of the coefficient of inbreed-ing was not significantly different from zero (FIS=−0.05; Table 1B). Pairwise relatedness between individuals of the wild population was inferred using allele frequencies at microsatellite loci and the QuellerGT relatedness estimator (which performed best given the population composition and allele frequency distribution according to simulation analyses; Additional file 1: Figure S2). Relatedness among members (N = 57) of the wild population was not signifi-cantly different from zero (r =−0.039 ± 0.024). The number of wild populations (and the assignment of individuals to each population) was estimated using Bayesian inferences. Our results indicate that in all cases the highest posterior probability value was found at K = 1 and that for values of K > 1, every individual’s posterior assignment probability was equally split among all the specified clusters (Figure 2); hence no population structure was detected among the wild lizard samples.
Demographic history of the wild population
The Wilcoxon test failed to detect recent bottlenecks under any kind of mutation model (IAM, TPM and SMM) of microsatellite evolution (P = 0.156, P = 0.156
and P = 0.109, respectively). Moreover, the allele fre-quency distribution obtained from the mode-shift indi-cator test followed a normal L-shape, indicating a larger proportion of low frequency allele classes in G. bra-voana, and thus also supporting the absence of a recent genetic bottleneck.
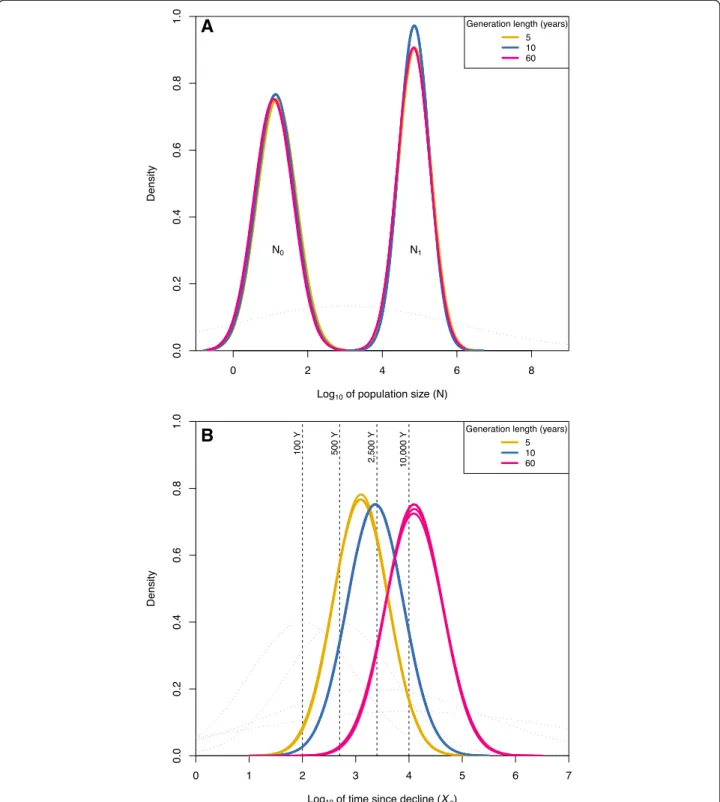
Results from the coalescent-based method applied to infer past demographic changes supported a long-term decline in G. bravoana (Figure 3; Table 2). The estimates of the different demographic parameters were similar ir-respective of the four periods of time analyzed (Table 2). We observed that the current mean effective population size (N0) was always smaller than the ancestral effective mean population size (N1) (Figure 3A, Table 2), regard-less the three values of generation time (g) analyzed. The mean values of N1and N0were 70,794 and 13, respect-ively. This corresponds to a reduction in effective popu-lation size (N0/N1) of around 5,400 times and that only 0.02% of the original effective population survives at present. The decline was estimated to have occurred around 221–246 generations before present, and the time estimation of the onset of the decline varies de-pending on the generation time prior but not on the four time periods analyzed. For a g = 5 years, the decline was inferred to have started around 1,230 years ago (with a confidence credibility interval of 110 - 12,023); for a g = 10 years the start of the decline was estimated
Figure 2 Number ofGallotia bravoana populations with the highest posterior probability expressed as the mean likelihood (log P (X∣K)).
Gonzalez et al. BMC Genetics 2014, 15:121 Page 6 of 16
A
B
Figure 3 Past demographic changes inG. bravoana wild populations inferred using a Bayesian coalescent approach. Marginal posterior density of A) present (N0) and past (N1) effective population size represented on a log10 scale. The colors of posterior densities represent three
different assumed generation times in years for the prior set analyzed, which is represented by a gray dotted line. B) Posterior distribution represented on a log10 scale of the time (in years) since the G. bravoana population decline (Xa), calculated using MSVAR v1.3, for the four prior sets analyzed. The colors of posterior densities represent the three different assumed generation times in years for the four prior sets analyzed, which are represented by gray dotted lines. The black vertical dashed line represents the four time periods tested (from left to right): 100; 500; 2,500 and 10,000 years (Y).
Gonzalez et al. BMC Genetics 2014, 15:121 Page 7 of 16
to be around 2,344 years ago (195 - 23,442); and for g = 60 years the decline would have started around 13303 years ago (1,000 - 128,825) (Figure 3B, Table 2).
Multiple paternity in the captive population
The levels of genetic diversity of the captive population were low and similar to those found in the wild popula-tion (Table 1C). Overall relatedness among individuals (N = 20) of the captive population was low (r = 0.037 ± 0.056). Within the eleven clutches that hatched in cap-tivity between 2001–2005, eight yielded a unique (mon-ogamous) possible paternal genotype (Table 3). Fisher’s exact tests were non-significant, confirming that a single male sired the clutches (Table 3). The remaining three clutches resulted from the combination of more than one (polyandrous) male (Table 3). Multiple paternity cases never involved more than two males. Interestingly, in genetically monogamous pairings, a relatively high number of parental mismatches were detected i.e., in five cases the assigned male did not correspond with the putative father. In two out of these five cases, the obtained genotype coincided with that of the male of the previous year’s crossing, in another two cases the genotype was of one of the founder males not involved in the breeding experiment, and in another case the proposed genotype did not match any of the males used for breeding (Table 3).
Discussion
We analyzed for the first time the genetic structure and demographic history of a highly threatened Canary Island giant lizard [22], G. bravoana, which shows an extremely reduced population number (ca. 160 individuals in the wild) and a severely reduced geographical distribution (<20 Km2) in La Gomera [24]. Some of the methodo-logical limitations related to the natural small population size were overcome by maximizing sampling effort in order to cover more than half of the wild population diver-sity of the species, and by using powerful statistical tools based on coalescence.
Overall, the eight polymorphic species-specific micro-satellite loci used in this study showed no significant linkage disequilibrium, but otherwise very low levels of genetic diversity. The observed overall departure from HWE could be explained in terms of admixture of gen-etically distinct cohorts (Whalund effect) given that the pattern of HWE departures changed completely when only the samples from the wild were analysed (only the FISof GBR29 was significant, Table 1B). Levels of hetero-zygosity in the wild and captive populations were similar indicating that the captive population could be consid-ered a sound representation of the genetic variability found in the wild. Heterozygosity values herein reported are lower than those previously estimated for G. bra-voanabased on different microsatellite loci (mean HO= 0.42, [30]) and those reported for other species within
Table 2 Full Log10 posterior estimates (and high posterior densities, HPD) of natural parameters obtained with MsVar for three different putative generation times and for four historical events that may have affectedG. bravoana demography (see text)
100 years 500 years 2500 years 10000 years 95% HPD 95% HPD 95% HPD 95% HPD Mean Lower Upper Mean Lower Upper Mean Lower Upper Mean Lower Upper G = 5 years
Ancient effective population size (N1) 4.86 3.97 5.74 4.86 3.97 5.74 4.87 3.98 5.75 4.86 3.98 5.75
Current effective population size (N0) 1.17 0.08 2.17 1.16 0.05 2.16 1.17 0.07 2.16 1.16 0.06 2.17
Time since effective population size change (Xa) 3.10 2.04 4.07 3.09 2.05 4.08 3.10 2.05 4.08 3.09 2.03 4.07
Mutation rate (μ) -3.17 -3.65 -2.69 -3.17 -3.65 -2.69 -3.17 -3.65 -2.69 -3.17 -3.65 -2.69 G = 10years
Ancient effective population size (N1) 4.85 3.97 5.74 4.86 3.99 5.76 4.86 3.98 5.74 4.86 3.97 5.75
Current effective population size (N0) 1.14 0.01 2.16 1.14 0.02 2.16 1.13 0.02 2.14 1.14 9E 04 2.16
Time since effective population size change (Xa) 3.37 2.29 4.37 3.37 2.29 4.37 3.36 2.29 4.36 3.37 2.28 4.38
Mutation rate (μ) -3.17 -3.65 -2.69 -3.17 -3.65 -2.69 -3.17 -3.65 -2.68 -3.17 -3.65 -2.69 G = 60years
Ancient effective population size (N1) 4.84 3.96 5.72 4.84 3.98 5.73 4.84 3.96 5.72 4.84 3.96 5.73
Current effective population size (N0) 1.09 -0.04 2.13 1.08 -0.06 2.13 1.09 -0.08 2.13 1.09 -0.06 2.13
Time since effective population size change (Xa) 4.10 3.00 5.11 4.09 2.99 5.10 4.10 2.99 5.12 4.09 2.99 5.11 Mutation rate (μ) -3.16 -3.64 -2.68 -3.16 -3.64 -2.68 -3.16 -3.64 -2.68 -3.16 -3.63 -2.67
Gonzalez et al. BMC Genetics 2014, 15:121 Page 8 of 16
the genus (G. atlantica, mean HO = 0.86; [31], and G. galloti, mean HO = 0.79; [32]) that are considered as Least Concern. Moreover, the values are also lower to those reported for island squamate species described as Vulner-able (e.g., the Komodo Dragon, [33]) and Endangered (e.g., the Balearic Island Lilford’s Wall Lizard, [34]). They are also lower to the values reported for Critically Endangered spe-cies such as e.g., the Reunion Cuckoo shrike [9]). Therefore, although direct comparison of heterozygosity levels be-tween different microsatellite loci is difficult [35], the de-tected low values for G. bravoana seem to reinforce its genetically depleted status.
Despite long-term isolation of the population and low genetic variability values, the overall estimates of related-ness indicated low inbreeding within G. bravoana. The r values appear to be comparable to those reported for so-cial lizards [36,37]. However, given the large values of variance obtained, interpretation of the results should be taken cautiously, and a larger number of individuals need to be included in further analyses.
We failed to detect any population structure based on the Bayesian clustering analysis, which suggests that in-dividuals intermix freely in the single population of La Mérica cliff. In fact, we observed that the wild popula-tion was in HWE suggesting random mating and gene flow between individuals. Altogether, results indicate that G. bravoana is capable of actively dispersing across the different altitudinal patches despite the orographic difficulties of the steep terrain of La Mérica cliff.
The effect of human pressure on island biodiversity has been well documented and is considered one of the main causes of population declines and extinctions of many en-demic island species [8,38,39], and in particular of several giant squamates such as the giant skink (Chioninia coctei) from Cape Verde archipelago [40], the Round Island
burrowing boa (Bolyeria multocarinata) [41], the giant Jamaican galliwasp (Celestus occiduus) [42], and the Martinique giant Ameiva (Ameiva major) [42]. However, human pressure and associated deterministic factors are likely not the exclusive cause of the decline of island en-demic populations, and there is a long-standing debate on the relative contribution of stochastic events of environ-mental and genetic nature in extinction [9,14]. While cli-matic changes likely caused population decline in fruit bats (Cynopterus brachyotis) of the Indomalayan region about 30,000 to 58,000 years ago [43] and in the Copaia tree (Jacaranda copaia) in the Panama region about 16,000 to 19,000 years ago [44], the effect of human pres-sure is likely behind the collapse of mouse lemurs of the genus Microcebus from Madagascar 500 years ago [35], and of orang-utans from North Eastern Borneo 200 years ago [38].
In the case of the giant lizard of La Gomera, the results of classic equilibrium-based methods to test for bottle-necks discard a recent human-mediated population col-lapse in the last 700–1,400 years (corresponding with the time frame limits of the Bottleneck test of 2Ne– 4Ne gen-erations [45]). The results of the coalescent analysis showed a long-term decline and estimated a strong reduc-tion to a current effective populareduc-tion size of 13, what is congruent with the present day effective size of the popu-lation (as estimated through census monitoring cam-paigns). Although the different coalescent analyses agreed on the number of generations since the decline of the population (around 230), dating the onset of the decline was more difficult and strongly dependent on what gener-ation time was used as a prior. The longest genergener-ation time prior favored the hypothesis of a continuous decline of G. bravoana populations since at least 13,000 years ago, which could be related to environmental disturbances
Table 3 Summary of breeding pairs and mating system for theG. bravoana individuals used for the paternity analyses
Year of birth Female parent1 Male parent Nº of indiv. hatched Offprings analyzed Mating system FIS2
2002 GBR2 GBR24 7 GBR64, GBR65, GBR66 ? 0.558 2003 GBR GBR22 2 GBR67, GBR68 P -1.000 2003 GBR1 GBR24 3 GBR74, GBR75 M 0.35 2003 GBR8 GBR22 4 GBR69, GBR70, GBR71, GBR72 P -0.143 2003 GBR16 GBR25 1 GBR73 M — 2004 GBR11 GBR25 3 GBR78,GBR79 M 0.400 2004 GBR8 GBR22 7 GBR77 P -0.200 2005 GBR2 GBR25 1 GBR80 M — 2005 GBR50 GBR18 8 GBR93, GBR94, GBR95, GBR98 M -0.124 2005 GBR11 GBR32 7 GBR87, GBR90, GBR92 M -0.500 2005 GBR8 GBR26 5 GBR81, GBR82, GBR83, GBR84, GBR85 M -0.600
M: monogamous, P: polygynous, ?: unknown. FIS= Wright’s statistics. 1
The code name correspond to the studbook ID # in Additional file1: Table S2.
2
None of the FISvalue were significant.
Gonzalez et al. BMC Genetics 2014, 15:121 Page 9 of 16
such as past climatic changes or volcanic eruptions. How-ever, shorter generation time priors supported instead that the onset of the decline would be related to the human arrival to the islands about 2,500 years ago. In fact, the 95% high posterior densities associated to the estimates were relatively large and thus, it is not possible to fully discriminate among competing scenarios, as well as to discard a synergetic effect of human activities and lon-term environmental or genetic factors in the decline of the giant lizard populations on the island.
The Canary Islands giant lizards are characterized by their larger body size, longer life span, and lower repro-ductive rates compared to small-bodied lizards. These are all life-history traits that contribute to genetic drift in small populations and eventually may lead to extinction. For instance, the longer generation times of the giant liz-ards would contribute to the overlapping of generations, and following the Moran model [46] for genetic drift, this would accelerate the genetic drift process in small popula-tions. It would also contribute to a reduction in the fix-ation of mutfix-ations that could lead to higher fitness and adaptation and as well as a reduction in genetic diversity, the effective population size and allele frequencies. Dele-terious mutations under inbreeding could become fixed to a load untenable for the population and lead to extinction such as in the case of the giant skink of Cape Verde [40]. However, genetic drift is stochastic in nature, and the process does not necessarily need to end in extinction, as is the case of the giant lizard of La Gomera. The combined input of both genetic and ecological factors on population viability may explain long-term persistence of G. bravoana despite low genetic diversity.
Although it is widely accepted that substantial genetic variation is necessary for the long-term survival of spe-cies [11,12,47], evidence is accumulating for the capacity of many species (e.g., the Raso lark [10], the Reunion cuckoo shrike [9], the Madagascar fish-eagle, [48], or the Amsterdam albatross [49]; within squamates, the Gran Cayman blue iguana, Cyclura lewisi [50], could represent a similar case to G. bravoana,) to pass through historical bottlenecks and persist with small population sizes and low genetic diversity. Moreover, it has been shown that minimal management and conservation actions for these threatened species were enough to enhance population growth rates [12], and bring them back from the extinc-tion vortex. In this regard, it is important to note that low genetic variation as inferred form neutral loci such as microsatellites does not predict the variability and evolutionary potential of loci under selection (and thus ecologically important) [11,12]. Selection can act retain-ing genetic variation important for adaptation and pur-ging genetic load after a bottleneck [12,51].
From the genotype comparison analysis on the captive population, we observed a frequency of multiple paternities
(three out of the eleven clutches examined had multiple sires, 27%) of similar level to those reported in other social lizard communities, such as Egernia whitii (11.6%, [52]), Egernia stokesii(25%, [53]) or Egernia saxatilis (20%, [54]). Moreover, parental mismatches were detected among hatches derived from monogamous pairs. Since a single fe-male and fe-male pair was put together during a short period of mating confinement, parental mismatches could be ex-plained by the existence of previous or posterior crossings of the female with other males within the breeding season. Also, the parental mismatches could be the result of inclu-sion of females previously inseminated in the field in the breeding program. Overall, our results strongly support that G. braovana females may be able to retain sperm. Al-though rare in birds and mammals, long-term sperm stor-age (i.e., for months or even years) in natural populations are more common in reptiles and amphibians (e.g. Crotalus adamanteus, [55], Alligator missippiensis, [56], Desmog-nathus ocoee, [57], but see [58] and references therein). Therefore, of the possible explanations for the observed pa-ternity pattern, multiple matings by the female with differ-ent males, combined with the ability for long-term sperm retention is the most likely.
It is plausible that multiple mating between G. gallotia individuals may be used as an indirect strategy to avoid in-breeding [37,59,60], which could potentially benefit popu-lation viability. The overall low inbreeding values obtained are in accordance with this expectation, although the asso-ciated values of variance were high, and further analyses with larger samples are needed to confirm this hypothesis. Other mechanisms to avoid inbreeding have been de-scribed in lizards (e.g., kin recognition and sex-bias disper-sal, [36,37,49,61,62]); however, determining the influence of each of these mating strategies on G. bravoana requires data not yet collected for this species. It is not clear whether or not the pattern of multiple paternities ob-served in the captive population may be representative of mating in the wild population since mating in captivity did not happen in a random way. However, the confinement of the wild population to a single cliff, the reduced num-ber of breeding individuals, and the existence of a single evolutionary unit seem to provide the conditions that could favor the multiple paternity behavior also in the wild (see [63] for an example of multiple paternity reported in natural populations of lacertid lizard species).
Conclusions
The demographic history analyses performed in this study indicate that the original G. bravoana population was made up of thousands of individuals that suffered a long-term gradual demographic decline that was esti-mated to have started between 1,200–13,000 years ago (depending on the assumed generation time and with large confidence intervals). Fossil records suggest that its
Gonzalez et al. BMC Genetics 2014, 15:121 Page 10 of 16
decline was accompanied by a continuous reduction in geographical distribution, resulting in its present-day re-stricted distribution on La Mérica cliff. Ever since, the only known population has survived isolated, with a low effective number and low levels of genetic diversity. Wild individuals of G. bravoana act as a single evolu-tionary unit, as supported by the Bayesian clustering results, and gene flow is unrestricted throughout La Mérica cliff. Relatedness analyses indicate low levels of inbreeding (although these results should be taken cau-tiously as they present large values of variance and thus a larger number of individuals and loci need to be in-cluded in further analyses). Kinship analyses of the cap-tive population support G. bravoana monogamous and polygynous pairings, presumably conducted through multiple mating and long-term sperm retention mecha-nisms, which might have contributed to avoid inbreed-ing and towards species persistence. This suggests that the deleterious genetic load associated to the gradual de-cline suffered by the species may have been purged in the population, which therefore retains the (adaptive) potential to recover if population growth rates are en-hanced through the breeding program.
Methods
Sample collection and DNA extraction
To collect samples from wild individuals, several cap-ture/recapture campaigns were performed throughout La Mérica cliff (subdivided into several ledges or prom-ontories of climb-sampling due to its isolation and in-accessibility). From 2001 to 2005, we sampled a total of 57 specimens (Additional file 1: Table S2). Given that the 2005 census estimated 100 individuals in La Mérica [64], we assume to have captured more than half of the population. Blood samples were taken from adults that were captured and subsequently released into the wild, whereas tissue samples (skin or muscle) were taken from dead individuals (Additional file 1: Table S2). All samples were collected with the appropriate permissions issued by the Government of Canarias under the service agree-ment no. 03103 corresponding to the European Life Project n° LIFE 02 NAT-E-008614.
From 2001 to 2005, a total of 42 juveniles born in cap-tivity were analyzed. Crosses of five females and four males captured in the wild produced 27 juveniles during the five years (Additional file 1: Table S2). In addition, in 2005, two males (GBR18 and 32), born in captivity in 2001, were included in the breeding program and con-tributed with 15 individuals (Additional file 1: Table S2). Crossing experiments were as follows. All females and males were kept together, until specific couples were separated for designed crosses. After crosses, individuals were returned to common facilities. Crosses were de-signed so that all males and females would breed over
the years, but no genetic information was taken into ac-count. Clutches were incubated in different containers, and 0.5 ml blood sample was obtained from juveniles after hatchling. Sex was determined via visual examin-ation of the sexual characters in adults and subadults (such as the relative size of the head and the presence/ absence of a hemipenis). Sex of juveniles was determined once they attain sexual maturity.
All samples were stored in ethanol at−20°C and total DNA was extracted using the QIAGEN DNeasy tissue kit (Qiagen) following manufacturer’s conditions.
Microsatellite characterization
Specific microsatellite markers were isolated and devel-oped for G. bravoana (Table 1). An enriched partial gen-omic library was generated from DNA of an individual captured in the wild (studbook ID #GBR1) as previously described [65,66] using a method that relies on the con-struction of a genomic library of blunt ended DNA frag-ments enriched for GT repeat sequences ligated to SNX linkers [67-69]. A total of 80 positive clones were se-quenced, and 18 that contained simple GT dinucleotide repeats were selected for primer design using PRIMER3 software [70]. From those, 11 microsatellites (GenBank ac-cession numbers JX661253-JX661263) were successfully amplified after PCR optimization, and were subsequently used to genotype the 99 samples. PCR amplifications con-sisted of one cycle of denaturing at 95°C for 2 min; 30 cy-cles of denaturing at 94°C for 30 s, annealing for 30 s at 52°C - 60°C, and extension at 72°C for 90 s; followed by one cycle of 15 min extension at 72°C. Reactions con-tained approximately 10 ng of sample DNA, 0.5 U of Taq
DNA polymerase (Eppendorf), 0.4 μM of each primer,
0.2 mM of each dNTP, 2–3 mM MgCl2, 1×Taq Buffer Ad-vanced (Eppendorf, 20 mM Tris–HCl, pH 8, 100 mM KCl, 0.1 EDTA, 1 mM DTT), and DEPC-water to a final volume of 15μl. Forward primers were labeled with fluor-escent dyes, and amplified PCR products were run on an ABI Prism 3730 DNA Analyzer (using the GeneScan™-500 LIZ® Size Standard, Applied Biosystems). Allele scoring was performed using GeneMapper v3.7 (Applied Biosys-tems). Approximately 35% of the samples were re-run to assess repeatability in scoring. Moreover, polymorphic primers were cross-amplified in seven species of the sub-family Gallotiinae (G. intermedia, G. simonyi, G. caesaris, G. atlantica, G. stehlini, G. galloti and Psammodromus algirus) to test the amplification range and polymorph-ism of the specific primers in closely related species (Additional file 1: Table S1).
Genetic diversity analyses
The observed (HO) and expected (HE) heterozygosities [71], number of alleles (NA) and the number of alleles standardized for the smallest sample size were calculated
Gonzalez et al. BMC Genetics 2014, 15:121 Page 11 of 16
using GENEPOP v 4.0 [72] and FSTAT [73] programs. Heterozygote deficiency according to departures from Hardy-Weinberg equilibrium (HWE), Wright’s FIS statis-tic estimations, and linkage disequilibrium were deter-mined using Markov chain Monte Carlo (MCMC) runs for 1,000 batches, each of 2,000 iterations, with the first 500 iterations discarded before sampling [74]. Correction for multiple testing (type I error) was performed using the false discovery rate (FDR) approach [75] using the R package QVALUE [76]. Wild and captive samples were analyzed both independently and combined into a single data set.
The program POWSIM [77] was used to estimate the statistical power to detect significant genetic differenti-ation with the newly developed microsatellite markers. All individuals were used for testing allele frequency homogeneity at each of the polymorphic loci separately, or combined with Fisher’s exact and traditional chi-squared tests. Burn-in consisted of 1,000 steps followed by 100 batches of 1,000 steps.
Population structure analyses
To determine possible population differentiation in the wild lizard population, a Bayesian clustering approach (as implemented in STRUCTURE [78]) was used. The number of populations (K) with the best-estimated prob-ability (lnProb (D)) value was calculated assuming an admixed model and a uniform prior probability of K [78]. We performed a series of independent runs for K from one to five putative populations. MCMC consisted of 5 × 10⁶burn-in iterations followed by 5 × 10⁵ sam-pled iterations.
Relatedness analyses
Pairwise coefficients of relatedness (r) among adult liz-ards from the wild population and among captive-born individuals of 2005 were estimated using COANCESTRY [79]. We chose four commonly-used moment related-ness estimators (see [80] for a comparison of their per-formance): the regression based estimator (QuellerGT, [81]), the regression based method-of-moments estima-tor (LynchRd, [82]), Wang’s estimaestima-tor (Wang, [83]), and the Triadic Likelihood estimator (TrioML, [80]). To de-termine which of these estimators perform best with our data, we generated three simulated genotype data sets based on observed allele frequencies of the wild G. bra-voana population and three types of True Relatedness relationships (unrelated siblings, UR, were r = 0.0; half-siblings, HS, were r =0.25; and full siblings, FS, were r = 0.5). The relative performance of the four esti-mators was calculated based on the proportion of vari-ance estimated by the True Relatedness and the observed (simulated) relatedness composition (follow-ing the approach of other authors: [84-86]). Monte
Carlo simulations were performed using the“True Re-latedness to be Simulated” option in the software to specify the above three types of relationships based on 4,000 multilocus genotypes [79]. For each estimator, the 95% confidence intervals were generated with bootstrapping (1,000 replicates across loci). The mean observed relatedness (and its estimated variance), and the theoretically expected relatedness values were com-pared using a two-tailed t-test. The normality of distribu-tion was previously checked using the Kolmogorov-Smirnov test [87]. The coefficient r was calculated for all wild individuals (N = 57 individuals) with the estimator that performed best based on the simulation (using a bootstrapping of 10,000 replicates). Due to the overall small range in progeny size in the captive population, only the genotypes for juveniles that hatched in the most suc-cessful year (2005; four clutches of a total of N = 20 indi-viduals) were used for relatedness estimations with the estimator that performed best.
Demographic history analyses
Tests based on summary statistics as well as Bayesian approaches were applied to infer the population demog-raphy history of the wild population (N = 57). First, pos-sible severe reductions in effective population size were assessed using BOTTLENECK [88,89]. This method as-sumes that recently bottlenecked populations should ex-hibit a significant excess of heterozygosity (HE) compared to the expected one at mutation-drift equilibrium. Ana-lyses were carried out assuming three different mutation models: (i) infinite allele (IAM), (ii) stepwise mutation (SMM), and (iii) two-phase (TPM, with 70% stepwise, 30% variable), and applying the Wilcoxon signed rank test for statistical detection of HE. Estimations were based on 10,000 replicates. Also, the mode-shift test [90] contained in BOTTLENECK was performed. The assumption be-hind the test is that a population under mutation-drift equilibrium is expected to have a larger proportion of al-leles with low frequencies, whereas a population that has undergone a recent bottleneck tends to lose rare alleles in-creasing the frequencies of common alleles.
Recently, coalescent-based methods [91,92] were devel-oped for estimating the likelihood of past demographic changes from present-day samples in a more efficient way than classic equilibrium-based methods based on heterozy-gosity or allele frequency distribution departures [90,93,94]. Therefore, we modeled past demographic changes in G. bravoana wild population using a Bayesian coalescent approach as implemented in MSVAR v1.3 [43,91]. This program is able to provide multilocus posterior distribution estimates of four natural parameters under a model of ex-ponential change in effective population size: the ancestral effective population size (N1), the current effective popula-tion size (N0) after Tanumber of generations of expansion/
Gonzalez et al. BMC Genetics 2014, 15:121 Page 12 of 16
decline processes, the time since the effective population size change in absolute years (Xa= g × Ta, where g is the generation time), and the mutation rate (μ.) [43].
Information obtained from individuals breeding in captivity indicates that G. bravoana females attain sexual maturity within the first four to six years (JAM personal obs). In the wild, adults can live up to 10–18 years [24]. Additionally, skeleton chronology studies of fossil re-cords suggest that 500 years ago adults could live up to 50–60 years [24]. Due to the wide variance in the esti-mate of the generation time and its potential sensitivity in the Bayesian performance, we decided to do explora-tory runs using different values for this parameter (g = 5, 10 and 60 years) in order to place broad confidence in-tervals around our estimates of absolute time since the population change.
We tested four time periods or historical events that could have most affected G. bravoana demography (fol-lowing the approach of [9,35]): i) the time of main climate oscillations that occurred at the end of the Pleistocene gla-ciations, ca. 10,000 years ago; ii) Time of first human set-tlements on the Canary islands, 2,500 years ago [25], and the likely first introduction of domestic species, (e.g., goats and cats) that possibly accompanied them [24]; iii), Time of the first European settlements and further human population growth, 500 years ago [24]; and iv) Time of in-tensive agriculture, use of pesticides, and further impacts due to urbanization and degradation of coastal environ-ment, about 100 years ago [95,96].
For all analyses, we ran five independent MCMC chains. Each chain was run for 6 × 10⁹ iterations and thinned at each 5 × 10⁴ interval. Using the R package BOA [97] we assessed the convergence among five chains by multivariate potential scale reduction factor statistics [98,99]. In addition, using BOA, we estimated the mean, standard deviation, and 95% highest posterior density (HPD) for the natural parameters N0, N1, Xa, and μ using a burn-in of half of the five merged chains. The log-normal priors (means and standard deviations) and hyperpriors (means and variances for means and variances) are described in Additional file 1: Table S3.
Multiple paternity analyses
Given that maternal genotypes were known only for cap-tive lizards, the genotypes of their offspring were used to calculate exclusion probabilities (PE) and maximum likeli-hoods of paternal genotypes of the breeding program, using GERUD [100]. Results could render in either a unique or multiple parental genotypes. For the former, Fisher’s exact tests were performed to test whether loci conformed to the expectations of Mendelian segregation in a monogamous mating [101]. For the latter, priority scores of the different solutions were ranked by likelihood (using the“Known Mother” menu option in the software).
Given the design of the study, it is relatively easy to detect the presence of null alleles in maternal lines within the progeny array. In fact, for each litter exam-ined, the genotype of their corresponding mother was accepted by the software, and used in the analysis (meaning that all progeny shared at least one allele at each locus with their mother). Only two offspring (stud-book ID #GBR64 and GBR65, Additional file 1: Table S1) failed to match at any locus with the maternal genotype (probably due to de novo mutation or genotyping errors), and were excluded from the analysis. Moreover, null al-leles in the paternal line may lead to incorrect assignment in cases of multiple paternities. To minimize this effect, only the offspring that were successfully amplified for all loci were included in the analysis (which led to a range from one to five per clutch). On the other hand, since all loci conformed to the expectations of HWE when the wild population was analyzed (Table 1B), we considered that null alleles did not bias our estimation of paternal contri-bution [101].
Additional file
Additional file 1: Figure S1. Distribution of alleles found for each locus in the wild and captive populations. Figure S2. Performance comparison of different relatedness (r) estimators and null hypothesis of True Relatedness relationships Table S1. Cross-species amplifications of 11 specific Gallotia bravoana microsatellites for all the related species within Gallotiinae. Table S2. Samples included in the study. Table S3. Log-normal priors and hyperpriors used for MsVar analysis performed on Gallotia bravoana samples.
Competing interests
The authors declare that they have no competing interests.
Authors’ contributions
EGG, JAM and RZ conceived the study. JAM collected the data and EGG and ICS performed the statistical analyses. EGG carried out the DNA genotyping and drafted the manuscript. All authors contributed to read and approved the final manuscript.
Acknowledgments
The authors would like to thank all those who provided samples for the cross-species loci amplification part of this study: Philippe Geniez (Centre d’Ecologie Fonctionnelle and Evolutive, Montpellier, France), Patrick Fitze (MNCN-CSIC, Madrid, Spain), and Mariano Hernández (Universidad de la Laguna, Tenerife, Spain). We also thank the Subject Editor and three anonymous reviewers for their insightful comments on a previous version of the manuscript. EGG benefited from a postdoctoral grant from the Spanish Ministry of Education. This research was funded by the European Life Project n° LIFE 02 NAT-E-008614 to JAM and by the projects of the Ministerio de Ciencia e Innovación, REN 2001- 1514/GLO and CGL 2010–18216 to RZ.
Author details 1
New address: Departamento de Biodiversidad y Biología Evolutiva, Museo Nacional de Ciencias Naturales, MNCN-CSIC, José Gutiérrez Abascal, 2, Madrid 28006, Spain.2CCMAR, Campus de Gambelas - Universidade do Algarve, Faro 8005-139, Portugal.3Smithsonian Tropical Research Institute, Apartado 0843-03092,
Panama.4New address: Department of Botany and Plant Pathology, Oregon State University, Corvallis, OR 97331-2902, USA.5BIOGES, Campus de Tafira s/n, University
of Las Palmas de Gran Canaria, Las Palmas de Gran Canaria E-35017, Canary Islands, Spain.
Gonzalez et al. BMC Genetics 2014, 15:121 Page 13 of 16
Received: 29 May 2013 Accepted: 27 October 2014
References
1. Mayr E: Systematics and the Origin of Species. New York: Columbia University Press; 1942.
2. Mac Arthur RH, Wilson EO: The Theory of Island Biogeography. Princeton, N. J: Princeton University Press; 1967.
3. Emerson BC: Evolution on oceanic islands: molecular phylogenetic approaches to understanding pattern and process. Mol Ecol 2002, 11(6):951–966.
4. Gillespie RG, Claridge EM, Roderick GK: Biodiversity dynamics in isolated island communities: interaction between natural and human-mediated processes. Mol Ecol 2008, 17(1):45–57.
5. Emerson BC, Kolm N: Species diversity can drive speciation. Nature 2005, 434(7036):1015–1017.
6. Groombridge J: Genetics and extinction of island endemics: the importance of historical perspectives. Anim Conserv 2007, 10(2):147–148. 7. Biber E: Patterns of endemic extinctions among island bird species.
Ecography 2002, 25(6):661–676.
8. Groombridge JJ, Dawson DA, Burke T, Prys-Jones R, Brooke MD, Shah N: Evaluating the demographic history of the Seychelles kestrel (Falco araea): genetic evidence for recovery from a population bottleneck following minimal conservation management. Biol Conserv 2009, 142(10):2250–2257.
9. Salmona J, Salamolard M, Fouillot D, Ghestemme T, Larose J, Centon JF, Sousa V, Dawson DA, Thebaud C, Chikhi L: Signature of a pre-human population decline in the critically endangered reunion island endemic forest bird coracina newtoni. PLoS One 2012, 7(8):e43524.
10. Md B, Welbergen J, Mainwaring M, van der Velde M, Harts AMF, Komdeur J, Amos W: Widespread translocation from autosomes to Sex
chromosomes preserves genetic variability in an endangered lark. J Mol Evol 2010, 70(3):242–246.
11. Hansson B, Richardson DS: Genetic variation in two endangered Acrocephalus species compared to a widespread congener: estimates based on functional and random loci. Anim Conserv 2005, 8(1):83–90. 12. Reed DH: Albatrosses, eagles and newts, Oh My!: exceptions to the
prevailing paradigm concerning genetic diversity and population viability? Anim Conserv2010, 13(5):448–457.
13. Bishop JM, Leslie AJ, Bourquin SL, O’Ryan C: Reduced effective population size in an overexploited population of the Nile crocodile (Crocodylus niloticus). Biol Conserv 2009, 142(10):2335–2341.
14. Jamieson IG: Has the debate over genetics and extinction of island endemics truly been resolved? Anim Conserv 2007, 10(2):139–144. 15. Jamieson IG: Role of genetic factors in extinction of island endemics:
complementary or competing explanations? Anim Conserv 2007, 10(2):151–153.
16. Arnold EN, Arribas O, Carranza S: Systematics of the palaearctic and oriental lizard tribe lacertini (squamata : lacertidae : lacertinae), with descriptions of eight new genera. Zootaxa 2007, 1430:1–86.
17. Cox SC, Carranza S, Brown RP: Divergence times and colonization of the Canary Islands by Gallotia lizards. Mol Phylogenet Evol 2010, 56(2):747–757. 18. Maca-Meyer N, Carranza S, Rando JC, Arnold EN, Cabrera VM: Status and
relationships of the extinct giant Canary Island lizard Gallotia goliath (Reptilia : Lacertidae), assessed using ancient mtDNA from its mummified remains. Biol J Linn Soc 2003, 80(4):659–670.
19. Pyron RA, Burbrink FT, Wiens JJ: A phylogeny and revised classification of Squamata, including 4161 species of lizards and snakes. BMC Evol Biol 2013, 13:93.
20. Rando JC, Hernandez E, Lopez M, Gonzalez AM: Phylogenetic relationships of the Canary Islands endemic lizard genus Gallotia inferred from mitochondrial DNA sequences: Incorporation of a new subspecies. Mol Phylogenet Evol 1997, 8(1):114–116.
21. Mateo JA, Crochet PA, Afonso OM: The species diversity of the genus Gallotia (Sauria: Lacertidae) during the Holocene on La Gomera (Canary Islands) and the Latin names of Gomeran giant lizards. Zootaxa 2011, 2755:66–68.
22. Nogales M, Rando JC, Valido A, Martin A: Discovery of a living giant lizard, genus Gallotia (Reptilia : Lacertidae), from La Gomera. Canary Islands Herpetologica 2001, 57(2):169–179.
23. Curbero C: Final Report (LIFE 06 NAT/E/000199). In Programa de Recuperación de Gallotia bravoana y de su área de distribución. La Gomera (Canary Islands, Spain): Cabildo Insular de La Gomera; 2010:62. 24. Mateo JA: El Lagarto Gigante de La Gomera. Santa Cruz de Tenerife:
Turquesa Press; 2007:281.
25. López-Jurado LF, Mateo JA: Origin, Colonization, Adaptive Radiation, Intrainsular Evolution and Species Substition Proceses in the Fossil and Living Lizards of the Canary Islands. In Sciencia Herpetologica. Edited by Llorente GAM, Santos y MAX, Carretero. Barcelona: AHE; 1995:81–91. 26. Groom SVC, Stevens MI, Schwarz MP: Parallel responses of bees to Pleistocene climate change in three isolated archipelagos of the southwestern Pacific. Proc R Soc B: Biol Sci 2014, 281(1785):20133293. 27. Melbourne BA, Hastings A: Extinction risk depends strongly on factors
contributing to stochasticity. Nature 2008, 454(7200):100–103.
28. Vandergast AG, Gillespie RG, Roderick GK: Influence of volcanic activity on the population genetic structure of Hawaiian Tetragnatha spiders: fragmentation, rapid population growth and the potential for accelerated evolution. Mol Ecol 2004, 13(7):1729–1743.
29. Yuan N, Sun Y, Comes H-P, Fu C-X, Qiu Y-X: Understanding population structure and historical demography in a conservation context: population genetics of the endangered kirengeshoma palmata (hydrangeaceae). Am J Bot 2014, 101(3):521–529.
30. Suarez NM, Betancor E, Pestano J: Isolation and characterization of microsatellite loci in the endangered lizard Gallotia bravoana and cross-species amplification in other Canarian Gallotia. Conservation Genet Resour 2010, 2(1 Supplement):265–268.
31. Bloor P, De Laguna IHB, Kemp SJ: Highly polymorphic tetranucleotide microsatellite loci for the eastern Canary Island lizard, Gallotia atlantica. Mol Ecol Notes 2006, 6(3):737–739.
32. Richard M, Thorpe RS: Highly polymorphic microsatellites in the lacertid Gallotia galloti from the western Canary Islands. Mol Ecol 2000, 9:1919–1920. 33. Ciofi C, Bruford MW: Genetic structure and gene flow among Komodo
dragon populations inferredby microsatellite loci analysis. Mol Ecol 1999, 8:S17–S30.
34. Bloor P, Rodríguez V, Terrasa B, Brown RP, Pérez-Mellado V, Castro JA, Picornell A, Ramon MM: Polymorphic microsatellite loci for the Balearic Island Lizard Podarcis lilfordi (Squamata: Lacertidae). Conserv Genet Resour 2011, 3(2):323–325.
35. Olivieri GL, Sousa V, Chikhi L, Radespiel U: From genetic diversity and structure to conservation: Genetic signature of recent population declines in three mouse lemur species (Microcebus spp.). Biol Conserv 2008, 141(5):1257–1271.
36. Gardner MG, Bull CM, Cooper SJB, Duffield GA: Genetic evidence for a family structure in stable social aggregations of the Australian lizard Egernia stokesii. Mol Ecol 2001, 10(1):175–183.
37. Stow AJ, Sunnucks P: Inbreeding avoidance in Cunningham’s skinks (Egernia cunninghami) in natural and fragmented habitat. Mol Ecol 2004, 13(2):443–447.
38. Goossens B, Chikhi L, Ancrenaz M, Lackman-Ancrenaz I, Andau P, Bruford MW: Genetic signature of anthropogenic population collapse in orang-utans. PLoS Biol 2006, 4(2):e25.
39. Milton K, Lozier J, Lacey E: Genetic structure of an isolated population of mantled howler monkeys (Alouatta palliata) on Barro Colorado Island. Panama Conserv Genet 2009, 10(2):347–358.
40. Miralles A, Vasconcelos R, Perera A, Harris DJ, Carranza S: An integrative taxonomic revision of the Cape Verdean skinks (Squamata, Scincidae). Zoologica Scr 2011, 40(1):16–44.
41. Bauer AM, Günther R: On a newly identified specimen of the extinct bolyeriid snake Bolyeria multocarinata (Boie, 1827). Herpetozoa 2004, 17(3/4):179–181.
42. Schwartz A, Henderson RW: Amphibians and Reptiles of the West Indies. Gainesville: University of Florida Press; 1991.
43. Storz JF, Beaumont MA: Testing for genetic evidence of population expansion and contraction: an empirical analysis of microsatellite DNA variation using a hierarchical Bayesian model. Evolution 2002, 56(1):154–166. 44. Andrew Jones F, Cerón-Souza I, Hardesty BD, Dick CW: Genetic evidence of
Quaternary demographic changes in four rain forest tree species sampled across the Isthmus of Panama. J Biogeogr 2013, 40(4):720–731. 45. Luikart G, Sherwin WB, Steele BM, Allendorf FW: Usefulness of molecular markers for detecting population bottlenecks via monitoring genetic change. Mol Ecol 1998, 7(8):963–974.
Gonzalez et al. BMC Genetics 2014, 15:121 Page 14 of 16
46. Moran PAP: The Statistical Processes of Evolutionary Theory. Oxford: Clarendon Press; 1962.
47. Frankham R, Ballou JD, Briscoe DA: Introduction to Conservation Genetics. Cambridge: Cambridge Univ Press; 2002.
48. Johnson JA, Tingay RE, Culver M, Hailer F, Clarke ML, Mindell DP: Long-term survival despite low genetic diversity in the critically endangered Madagascar fish-eagle. Mol Ecol 2009, 18(1):54–63.
49. Milot E, Weimerskirch H, Duchesne P, Bernatchez L: Surviving with low genetic diversity: the case of albatrosses. Proc R Soc Lond 2007, 274(1611):779–787.
50. Malone CL, Wheeler T, Taylor JF, Davis SK: Phylogeography of the Caribbean rock iguana (Cyclura): implications for conservation and insights on the biogeographic history of the West Indies. Mol Phylogenet Evol 2000, 17(2):269–279.
51. Demontis D, Pertoldi C, Loeschcke V, Mikkelsen K, Axelsson T, Kristensen TN: Efficiency of selection, as measured by single nucleotide polymorphism variation, is dependent on inbreeding rate in Drosophila melanogaster. Mol Ecol 2009, 18(22):4551–4563.
52. Chapple DG, Keogh JS: Complex mating system and dispersal patterns in a social lizard. Egernia whitii Mol Ecol 2005, 14(4):1215–1227.
53. Gardner MG, Bull CM, Cooper SJB: High levels of genetic monogamy in the group-living Australian lizard Egernia stokesii. Mol Ecol 2002, 11(9):1787–1794. 54. O’connor DE, Shine R: Parental care protects against infanticide in the
lizard Egernia saxatilis (Scincidae). Anim Behav 2004, 68:1361–1369. 55. Booth W, Schuett GW: Molecular genetic evidence for alternative
reproductive strategies in North American pitvipers (Serpentes: Viperidae): long-term sperm storage and facultative parthenogenesis. Biol J Linn Soc 2011, 104(4):934–942.
56. Lance SL, Tuberville TD, Dueck L, Holz-Schietinger C, Trosclair PL, Elsey RM, Glenn TC: Multiyear multiple paternity and mate fidelity in the American alligator. Alligator mississippiensis Mol Ecol 2009, 18(21):4508–4520. 57. Adams EM, Jones AG, Arnold SJ: Multiple paternity in a natural population of
a salamander with long-term sperm storage. Mol Ecol 2005, 14(6):1803–1810. 58. Uller T, Olsson M: Multiple paternity in reptiles: patterns and processes.
Mol Ecol 2008, 17(11):2566–2580.
59. Gullberg A, Olsson M, Tegelström H: Male mating success, reproductive success and multiple paternity in a natural population of sand lizards: behavioural and molecular genetics data. Mol Ecol 1997, 6(2):105–112. 60. Olsson M, Madsen T, Shine R, Gullberg A, Tegelström H: Rewards of
promiscuity. Nature 1994, 327(6503).
61. Stow AJ, Sunnucks P, Briscoe DA, Gardner MG: The impact of habitat fragmentation on dispersal of Cunningham’s skink (Egernia cunninghami): evidence from allelic and genotypic analyses of microsatellites. Mol Ecol 2001, 10(4):867–878.
62. Stow AJ, Sunnucks P: High mate and site fidelity in Cunningham’s skinks (Egernia cunninghami) in natural and fragmented habitat. Mol Ecol 2004, 13(2):419–430.
63. Salvador A, Díaz JA, Veiga JP, Bloor P, Brown RP: Correlates of reproductive success in male lizards of the alpine species Iberolacerta cyreni. Behav Ecol 2008, 19(1):169–176.
64. Afonso OM, Mateo JA: Los lagartos Gigantes Canarios: conservación creativa de poblaciones mínimas. In Al borde de la extinción Intengrando ciencia, política y sociedad en la recuperación de las especies amenazadas. Edited by Delibes IJM. Valencia: Conselleria de Medi Ambient, Generalitat Valenciana; 2005.
65. Gonzalez EG, Zardoya R: Isolation and characterization of polymorphic microsatellites for the sardine Sardina pilchardus (Clupeiformes: Clupeidae). Mol Ecol Notes 2007, 7(3):519–521.
66. Gonzalez EG, Zardoya R: Microsatellite DNA capture from enriched libraries. Methods Mol Biol 2013, 1006:67–87.
67. Gardner MG, Cooper SJB, Bull CM, Grant WN: Isolation of microsatellite lofic from a social lizard, Egernia stojesii, using a modified enrichment procedure. J Hered 1999, 90(2):301–304.
68. Glenn TC, Schable NA: Isolating microsatellite DNA loci. Methods Enzymol 2005, 395:202–222.
69. Hamilton MB, Pincus EL, Fleischer RC: Universal linker and ligation procedures for construction of genomic DNA libraries enriched for microsatellites. Biotechniques 1999, 27:500–515.
70. Rozen S, Skaletsky HJ: Primer3 on the WWW for general users and for biologist programmers. Bioinformatics Methods and Protocols: Methods in Molecular Biology 2000, 132:365–386.
71. Nei M: Estimation of average heterozygosity and genetic distance from a small number of individuals. Genetics 1978, 89(3):583–590.
72. Raymond M, Rousset F: GENEPOP 33: population genetic software for exact test and ecumenism. J Hered 1995, 86:248–249.
73. Goudet J: FSTAT (Version 1.2): A Computer Program to Calculate F-Statistics. J Hered 1995, 86(6):485–486.
74. Guo SW, Thompson EA: Performing the exact test of Hardy-Weinberg proportion for multiple alleles. Biometrics 1992, 48(2):361–372. 75. Benjamini Y, Hochberg Y: Controlling the false discovery rate - a practical
and powerful approach to multiple testing. J R Stat Soc Ser B-Methodological 1995, 57(1):289–300.
76. Storey JD: A direct approach to false discovery rates. J R Stat Soc Ser B-Methodological 2002, 64:479–498.
77. Ryman N, Palm S: POWSIM: a computer program for assessing statistical power when testing for genetic differentiation. Mol Ecol Notes 2006, 6(3):600–602.
78. Pritchard JK, Stephensen M, Donelly P: Inference of population structure using multilocus genotype data. Genetics 2000, 155:945–954. 79. Wang JL: COANCESTRY: a program for simulating, estimating and
analysing relatedness and inbreeding coefficients. Mol Ecol Resour 2011, 11(1):141–145.
80. Wang J: Triadic IBD coefficients and applications to estimating pairwise relatedness. Genet Res 2007, 89(3):135–153.
81. Queller DC, Goodnight KF: Estimating relatedness using genetic-markers. Evolution 1989, 43(2):258–275.
82. Lynch M, Ritland K: Estimation of pairwise relatedness with molecular markers. Genetics 1999, 152(4):1753–1766.
83. Wang JL: An estimator for pairwise relatedness using molecular markers. Genetics 2002, 160(3):1203–1215.
84. Csillery K, Johnson T, Beraldi D, Clutton-Brock T, Coltman D, Hansson B, Spong G, Pemberton JM: Performance of marker-based relatedness estimators in natural populations of outbred vertebrates. Genetics 2006, 173(4):2091–2101.
85. Pino-Querido A, Hermida M, Vilarino M, Bouza C, Martinez P: Statistical properties and performance of pairwise relatedness estimators using turbot (Scophthalmus maximus L.) family data. Aquaculture Res 2010, 41(4):528–534.
86. Van de Casteele T, Galbusera P, Matthysen E: A comparison of microsatellite-based pairwise relatedness estimators. Mol Ecol 2001, 10(6):1539–1549.
87. Kolmogorov A: Sulla determinazione empirica di una legge di distributione. G dell’ Ist Ital degli Attuari 1933, 4:83–91.
88. Dirienzo A, Peterson AC, Garza JC, Valdes AM, Slatkin M, Freimer NB: Mutational processes of simple-sequence sepeat loci in human-populations. Proc Natl Acad Sci U S A 1994, 91(8):3166–3170. 89. Piry S, Luikart G, Cornuet JM: BOTTLENECK: a computer program for
detecting recent reductions in the effective population size using allele frequency data. J Hered 1999, 90(4):502–503.
90. Luikart G, Allendorf FW, Cornuet JM, Sherwin WB: Distortion of allele frequency distributions provides a test for recent population bottlenecks. J Hered 1998, 89(3):238–247.
91. Beaumont MA: Detecting population expansion and decline using microsatellites. Genetics 1999, 153(4):2013–2029.
92. Kuhner MK, Yamato J, Felsenstein J: Maximum likelihood estimation of population growth rates based on the coalescent. Genetics 1998, 149(1):429–434.
93. Cornuet JM, Luikart G: Description and power analysis of two tests for detecting recent population bottlenecks from allele frequency data. Genetics 1996, 144(4):2001–2014.
94. Garza JC, Wlliamson EG: Detection of reduction in population size using data from microsatellite loci. Mol Ecol 2001, 10(2):305–318.
95. Martín-Martín V: Los Paisajes Agrarios. In Gran Atlas Temático de Canarias. Edited by Pérez GMR. SC de Tenerife: Editorial Interinsular Canaria; 2000:207–218.
96. Pérez-González R: La Población. In Gran Atlas Temático de Canarias. Edited by Pérez-González GMR. SC de Tenerife: Editorial Interinsular Canaria; 2000:163–206.
97. Smith BJ: boa: an R package for MCMC output convergence assessment and posterior inference. J Stat Softw 2007, 21(11):1–37.
98. Gelman A, Rubin DB: Inference from iterative simulation using multiple sequences. Stat Sci 1992, 7(4):457–472.
Gonzalez et al. BMC Genetics 2014, 15:121 Page 15 of 16
99. Brooks SP, Gelman A: General methods for monitoring convergence of iterative simulations. J Comput Gr Stat 1998, 7(4):434–455.
100. Jones AG: GERUD 2.0: a computer program for the reconstruction of parental genotypes from half-sib progeny arrays with known or unknown parents. Mol Ecol Notes 2005, 5(3):708–711.
101. Portnoy DS, Piercy AN, Musick JA, Burgess GH, Graves JE: Genetic polyandry and sexual conflict in the sandbar shark, carcharhinus plumbeus, in the western north Atlantic and gulf of Mexico. Mol Ecol 2007, 16(1):187–197. doi:10.1186/s12863-014-0121-8
Cite this article as: Gonzalez et al.: Island survivors: population genetic structure and demography of the critically endangered giant lizard of La Gomera, Gallotia bravoana. BMC Genetics 2014 15:121.
Submit your next manuscript to BioMed Central and take full advantage of:
• Convenient online submission
• Thorough peer review
• No space constraints or color figure charges
• Immediate publication on acceptance
• Inclusion in PubMed, CAS, Scopus and Google Scholar
• Research which is freely available for redistribution
Submit your manuscript at www.biomedcentral.com/submit
Gonzalez et al. BMC Genetics 2014, 15:121 Page 16 of 16