Carlos Henrique Mendes Malhado(1), Paulo Luiz Souza Carneiro(1), Ana Claudia Mendes Malhado(2), Raimundo Martins Filho(3), Riccardo Bozzi(4) e Richard James Ladle(5)
(1)Universidade Estadual do Sudoeste da Bahia, Departamento de Ciências Biológicas, Avenida José Moreira Sobrinho, s/no, Jequiezinho, CEP 45200‑000 Jequié, BA, Brazil. E‑mail: [email protected], [email protected] (2)Universidade Federal de Viçosa, Departamento de Engenharia Agrícola e Meio Ambiente, Avenida Peter Henry Rolfs, s/no, Centro, CEP 36570‑000 Viçosa, MG, Brazil. E‑mail: [email protected] (3)Universidade Federal do Ceará, Campus do Cariri, Avenida Tenente Raimundo Rocha, s/no, Cidade Universitária, CEP 63000‑000 Juazeiro do Norte, CE, Brazil. E‑mail: [email protected](4)Università degli Studi di Firenze,
Department of Agricultural Biotechnology, Via delle Cascine, 5, CEP 50144 Firenze, Italy. E‑mail: [email protected] (5)Oxford University School of Geography and the Environment, South Parks Road, Oxford, OX1 3QY, United Kingdom. E‑mail: [email protected]
Abstract – The objective of this work was to evaluate the population structure and the genetic and phenotypic progress of Nelore cattle in Northern Brazil. Pedigree information concerning animals born between 1942 and 2006 were analyzed. Population structure was performed using the Endog program. Out of the 140,628 animals studied, 67.7, 14.52 and 3.18% had complete pedigree record of the first, second and third parental generation, respectively. Inbreeding and average relatedness coefficients were low: 0.2 and 0.13%, respectively. However, these parameters may have been underestimated, since information on pedigree was incomplete. The effective number of founders was 370 and the genetic contribution of 10, 50 and 448 most influent ancestors explained 13.2, 28 and 50% of the genetic variability in the population, respectively. The genetic variability for growth traits and population structure demonstrates high probability of increasing productivity through selective breeding. Moreover, management strategies to reduce the currently observed age at first calving and generation intervals are important for Nelore cattle genetic improvement.
Index terms: Bos taurus indicus, effective population size, genetic parameters, genetic trends, inbreeding, pedigree analysis.
Melhoramento genético e estrutura populacional
da Raça Nelore na Região Norte do Brasil
Resumo – O objetivo deste trabalho foi avaliar a estrutura populacional e o progresso genético e fenotípico da raça Nelore na Região Norte do Brasil. Informações sobre o pedigree foram analisadas em animais nascidos entre 1942 e 2006. A estrutura populacional foi estimada utilizando-se o programa Endog. Dos 140.628 animais avaliados, 67,7% dos pais, 14,52% dos avós e 3,18% dos bisavós eram conhecidos. O coeficiente de parentesco médio e a endogamia foram, em geral, baixos: 0,13 e 0,20%, respectivamente. Contudo, esses parâmetros podem ter sido subestimados, já que as informações de pedigree eram incompletas. O número efetivo de fundadores foi de 370 e a variabilidade genética na população explicada pelos 10, 50 e 448 mais influentes ancestrais foi de 13,2, 28 e 50%, respectivamente. A existência de variabilidade genética indica possibilidade de aumento na produtividade por meio da seleção. Adicionalmente, estratégias de manejo para diminuir a idade ao primeiro parto e o intervalo de gerações são importantes para o melhoramento da raça.
Termos para indexação: Bos taurus indicus,tamanho efetivo da população, parâmetros genéticos, tendência genética, endogamia, análise de pedigree.
Introduction
Improved productivity through genetic improvement could be seen as a win-win situation that allows continued economic growth of the cattle industry in the northern region of Brazil without the
associated expansion of the agricultural frontier via
deforestation.
Research and management of domestic animal
populations have recently benefited from the
application of molecular genetics techniques (Paiva et al., 2005; Albuquerque et al., 2006). These methods
have provided significant insights into the genetic structure of economically profitable species. Despite
and to evaluate inbreeding, effective population size, generation interval, genetic diversity and several other important population parameters (Vercesi Filho et al., 2002, Malhado et al., 2008a, 2008b, 2010; Martinez et al., 2008; Faria et al., 2009).
Studies using historical pedigree records have the
potential to identify the factors that have influenced
the genetic history of a population (Valera et al., 2005). Moreover, some population parameters are strongly dependent on management and mating systems, and
have significant impacts on genetic variability. In
addition to productivity, cattle breeders are concerned with monitoring the genetic health of their livestock. Knowledge of genetic changes in a population is crucial, not only as a guide for genetic interventions, but also to evaluate the results of the particular selection program adopted. Moreover, knowledge of population structure combined with information on genetic change in the population can guide future management actions, allowing the development of strategies that promote the genetic improvement and adaptation of a breed in a particular region (Malhado et al., 2008a).
Knowledge about pedigree is important in studies of population structure, especially where precise estimates of life history parameters are required. Lack of information, incomplete pedigree, and the recent introduction of animals into the population can cause the underestimation or overestimation of inbreeding and other important parameters (Goyache et al., 2003), leading to spurious interpretations.
The objective of this work was to evaluate the population structure and genetic and phenotypic progress of Nelore cattle in Northern Brazil.
Materials and Methods
Growth and pedigree data of Nelore cattle were obtained from the Associação Brasileira de
Criadores de Zebu (ABCZ). Pedigree information
of 140,628 animals was available for animals born between 1942 and 2006. Weight values of 49,075, 35,252, 32,578 animals, adjusted to 205 (W205), 365
(W365), 550 (W550) days of age respectively, and age
at first calving (AFC) of 6,780 animals were analyzed
concerning animals born between 1978 and 2006, and raised on pasture in Northern Brazil.
The derivative free maximum likelihood
methodology (using the animal model) and the multiple
traits derivative‑free restrict maximum likelihood
method (Boldman et al., 1995) were used to calculate variances and estimates of the genetic values. For W205
and W365, a model was applied which included the
additive genetic random effects (direct and maternal), maternal permanent environment, the co-variable age of dam at parity (linear and quadratic effects) and
the fixed effects of contemporary groups, admitting
the co-variance among direct and maternal genetic effects. For W550 and AFC, the same fixed effects and
co-variables were considered, with only the direct additive genetic effects as random.
Contemporary groups were composed of animals of the same sex, season of birth, year of birth, and
farm. Groups containing less than four animals were
excluded from the analysis. Estimates of genetic and
phenotypic trends were obtained by weighing average linear regression of dependent variables (genetic values and observed values) against the year of birth, using SAS (SAS Institute, 2003).
Pedigree analysis and parameters estimates based on probability of gene origin were performed using the Endog program (Gutiérrez & Goyache, 2005).
The inbreeding coefficient (F) was estimated
following Meuwissen & Luo (1992). The increase
in inbreeding (∆F) was calculated for each generation by means of the classical formula: ΔF = (F1 - Ft-1)/(1 - Ft-1), where Ft and Ft-1 are the
average inbreeding at the th generation. Utilizing ∆F,
Endog estimates the effective population size (Ne)
as Ne = 1/(2ΔF) for each generation having Ft>Ft-1 to
roughly characterize the effect of remote and close inbreeding.
The average relatedness coefficient (AR) of each individual is defined as the probability that an
allele randomly chosen from the whole population in the pedigree belongs to a given animal. Average relatednesscan then be interpreted as the representation of the animal in the whole pedigree, regardless of the knowledge of its own pedigree.
The pedigree completeness was estimated following
MacCluer et al. (1983) and included the description
of the completeness of each ancestor in the pedigree, to the 4th parental generation. For each individual, the
following parameters were calculated: the number of fully traced generations; the maximum number
of generations traced; and the equivalent complete
be defined as the number of generations separating
the offspring of the furthest generation in which the 2nd generation ancestors of the individual are known.
Ancestors with no known parents are considered as founders (generation 0). The second parameter is the number of generations separating the individual from its furthest ancestor. The equivalent complete generations are estimated as the sum over all known ancestors of the terms estimated as the sum of (1/2)n, where n is
the number of generations separating the individual to each known ancestor (Maignel et al., 1996).
The effective number of founders (fe) represents the number of animals that, under random mating, would produce the same genetic variability as observed in the
studied population. This is computed as fe = 1/Σ g2 k,
where, g2
k is the probability of gene origin of the k
ancestor.
The effective number of ancestors (ae) represents the minimum number of animals (founders or not) that
are necessary to explain the total genetic diversity of
the studied population (Gutiérrez & Goyache, 2005). It is calculated in a similar way to the effective number
of founders: ae = 1/Σ q2
j where q2j is the marginal
contribution of an ancestor j, which is the genetic
contribution made by an ancestor that is not explained
by a previously chosen ancestor.
Results and Discussion
Means and standard deviations for the adjusted weights at 205, 365 and 550 days of age were 171.84±30.1, 229.16±45.6 and 301.09±71.74 kg, respectively. Malhado et al. (2008a) reported averages of 167.0±34.5, 225.9±49.5 and 295.8±71.5 for W205,
W365 and W550, respectively, for Nelore cattle in Bahia
state, Brazil. The average age at first calving was 1,444.7±535 days (47.3 months). Azevêdo et al. (2006)
reported a slightly lower value (45.14±10.83 months)
for the reproductive performance of Nelore cattle in the North and Northeast regions of Brazil – although this is
still high in global terms. The high age at first calving
is one of the main factors that negatively affect the
optimal exploitation of beef cattle in the tropics. This trait is indicative of sexual precocity and is correlated
with potential lifespan.
The heritability coefficients (direct effects) and maternal heritability coefficients for W205 and W365
were slightly lower to those previously reported in the literature (Table 1). Lôbo et al. (2000), Gianotti et al. (2005) and Lira et al. (2008), respectively, report average heritability (direct effects) of 0.30, 0.23 and 0.28 for W205, 0.37, 0.27 and 0.31 for W365, and 0.35,
0.31 and 0.35 for W550.
The heritability coefficient for age at first calving was very low compared to the figure of 0.33 for AFC,
reported by Lôbo et al. (2000) based on a review of 65 papers. Such a low value indicates low additive genetic
variability, suggesting that artificial selection would bring limited success and, by extension, increases
in productivity are more likely to be gained through
innovations in management. However, it should be emphasized that estimates obtained with field data are
subjected to interference of the breeder. For instance,
breeders frequently exercise control over the initiation
of the reproductive life of the heifers, independently of their weight or age.
The genetic correlation between direct and maternal effects were low. Such low values, albeit with high standard errors, seem to contradict the commonly described high and negative correlations between these effects (Ferraz Filho et al., 2002; Sarmento et al., 2003;
Guterres et al., 2007). This result is probably explained
by the increase in the number of generations available for analysis over the years.
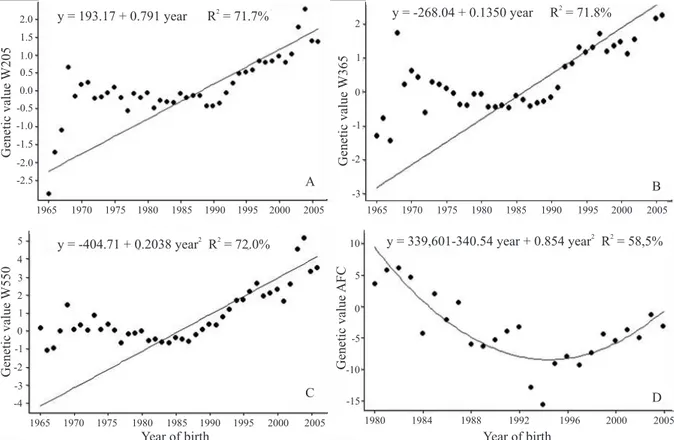
Direct genetic trends (linear regression) were significant
and equal to 0.097; 0.135 and 0.203 kg per year for
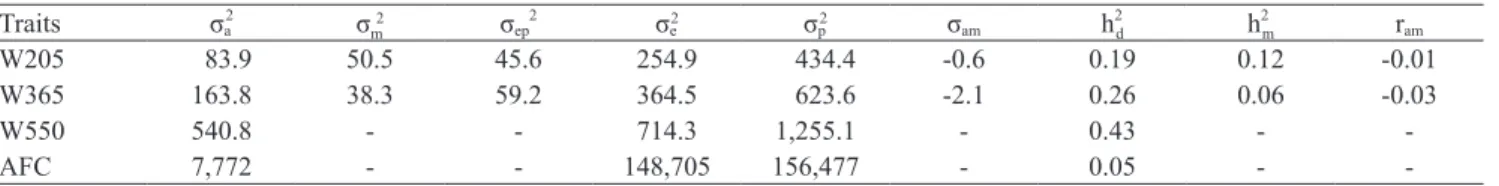
Table 1. Variance components estimates and heritability for weight at 205 (W205), 365 (W365), 550 (W550) days of age, and age
at first calving (AFC) in Nelore breed in Northern Brazil.
Traits σa
2 σ
m2 σep
2 σ
e
2 σ
p2 σam h
2
d h
2
m ram
W205 83.9 50.5 45.6 254.9 434.4 -0.6 0.19 0.12 -0.01
W365 163.8 38.3 59.2 364.5 623.6 -2.1 0.26 0.06 -0.03
W550 540.8 - - 714.3 1,255.1 - 0.43 -
-AFC 7,772 - - 148,705 156,477 - 0.05 -
-σa2 is the direct additive genetic variance component; σm2 is the maternal additive genetic variance component; σep2 is the maternal permanent environment
variance; σe2 is the residual variance; σp2 is the phenotypic variance; hd2 is the direct heritability; hm2 is the maternal heritability; ram is correlation genetic
W205, W365 and W550, respectively (Figure 1 A, B, C),
representing a genetic gain of 3.98; 5.53 and 8.32 kg for 41 years. Estimated gains of 0.049 (W205), 0.038
(W365) and 0.068 (W550) kg per year reported by
Malhado et al. (2008a) for Nelore cattle in Bahia state, Brazil. Maternal trends (linear regression) also were
significant (p<0.01), with a genetic gain of 0.015 and
0.093 kg per year for W205 and W365 respectively.
Genetic trend (linear regression) for age at first calving was not significant (Figure 1D). However, a significant quadratic effect was observed (p<0.001) suggesting that
until the mid-1990´s genetic value decreased and, after this period, average-breeding values began to increase gradually.
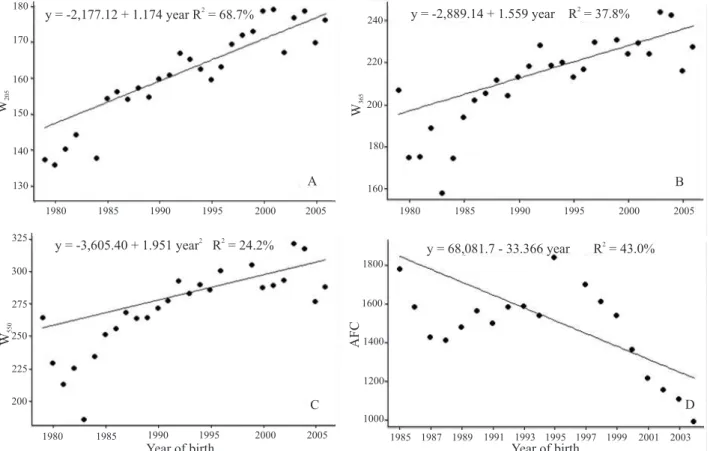
Phenotypic trends (linear regression) for growth traits
were significant (p<0.01) and equal to 1.17; 1.56 and
1.95 kg per year for W205, W365 and W550, respectively
(Figure 2 A–C). These results demonstrate that these
target traits are improving over time and that breeders
have obtained significant annual phenotypic gains
up to one year of age, mainly, due to environmental
improvement. However, the phenotypic gain tends to
reach its limit if no selection on the evaluated traits is forthcoming.
The study highlights the need to invest in genetic improvement for increasing productivity and to minimize the need for further pasture areas. For instance, considering selection intensity of 1.24, (retention of 5% of males and 75% of females), direct heritability (Table 1), phenotypic standard deviations, and average generation interval (8.08 years), it would be possible to obtain annual genetic
progress [ΔG = (si x σp x h2)/gi] equal to 0.87, 1.82
and 4.10 kg per year, which would correspond to 0.50, 0.79 and 1.36%, on average, for W205, W365 and W550,
respectively.
The regression coefficient for the average age at first calving was ‑33.4 days per year and showed a significant
phenotypic trend (Figure 2 D). A high average for this trait was observed between 1995 and 1999.
The estimates of generation interval (and its standard
error) for the four breeding pathways were: 9.5±0.22
Figure 1. Nelore breed characteristics in Northern Brazil: A, genetic trends for the direct effect of 205 days of age
(sire of sire), 8.8±0.04 (sire of dam), 7.1±0.14 (dam of sire), and 7.3±0.04 (dam of dam). The average generation interval was 8.08±0.03 years. The high interval among father–son and father–daughter can be decreased by the use of evaluated young bulls and the fast sire substitution by descendents. Moreover,
the reduction of the age at first calving is important to
decrease the average generation interval and to increase the annual genetic gain.
The average generation interval was equal to that calculated by Faria et al. (2009), slightly lower than those reported by Malhado et al. (2008a; 2009), and
higher than the intervals observed by Carneiro et al.
(2009) and Malhado et al. (2010) for registered zebu cattle in Brazil.
The reference population, in which both parents are known, contained 94,979 individuals, while 45,649 animals had one or both parents unknown. The effective number of founders (fe) was 370, and
the expected increase of inbreeding caused by the
founders’ unbalanced contribution was 0.06%. The
genetic contribution of the 10, 50 and 448 most
influential ancestors (founders or not) explained 13.2,
28.0 and 50% of the genetic variability of the whole population, respectively. Faria et al. (2009) reported that in Nelore cattle, a small number of ancestors made a substantial contribution to the population, while in Gir and Guzerat the numbers were larger. They describe that during the period from 1994 to 1998
as few as 50 Nelore ancestors explained 56% of the variability observed in the population. Carneiro et al.
(2009) estimated that 225 ancestors were necessary to
explain 50% of genetic variability of the population
of Indubrasil cattle from Northeast region. The largest
number of ancestors explaining genetic variability was reflected in the values of genetic variances, which were approximately 34 and 123% higher than those reported by Carneiro et al. (2009) for W205 and W550,
respectively.
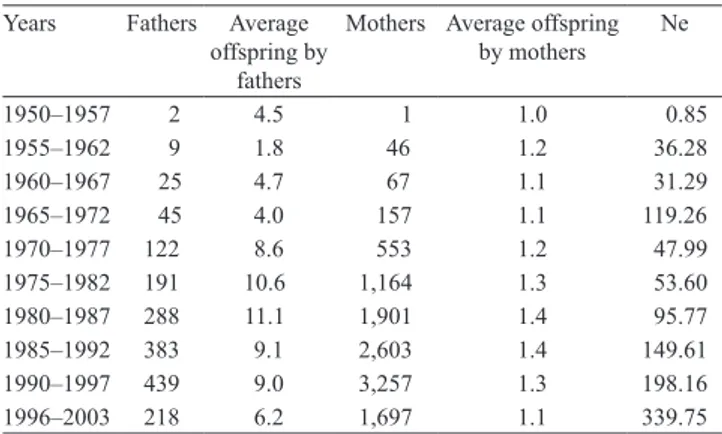
There was an increase in effective population size over time. The major number of births occurred between1990 and 1997 (Table 2). The 70’s and 80’s
Figure 2. Nelore breed characteristics in Northern Brazil: A, phenotypic trends for 205 days of age (W205); B, W365; C,
showed small effective size and greater average number of calves per bull and dam. This was the period of stagnation for the genetic gain of the traits
(Figure 1). This can be partly explained by the intensive
utilization of sires, based on their anatomical and racial traits with unknown genetic values.
The average relatedness coefficient (AR) between
individuals of the population was estimated at 0.13%,
with the highest individual coefficient of 1.16%. The average inbreeding coefficient (F) and the average F
for inbred animals were 0.2 and 6.24%, respectively (Table 3). The largest F value was 25%, obtained in
38 animals. The average inbreeding coefficient and the
percentage of inbred animals in the population increased
across generations. However, average F for inbreeding
decreased across generations due to increased avoidance of mating between close relatives.
The average inbreeding coefficient and the AR for
the whole population and for the founders were very low in the period 1965 to 1980 (Figure 3 A). This result is supported by the number of complete generations (sire and dam known) during this period (Figure 3 B).
Thus, the low level of inbreeding and the low average
relatedness coefficient reported here should be treated with caution because of the difficulty of estimating this
parameter.
From the mid-80s there was an increase in the number of known generations which was followed by an increase in inbreeding and AR. This relationship is most evident after the year 2000, a period during which AR and the
maximum number of generations had high growth. This can be explained by the more complete records for this
period, which increased the possibility that an important ancestor would appear several times in the pedigree.
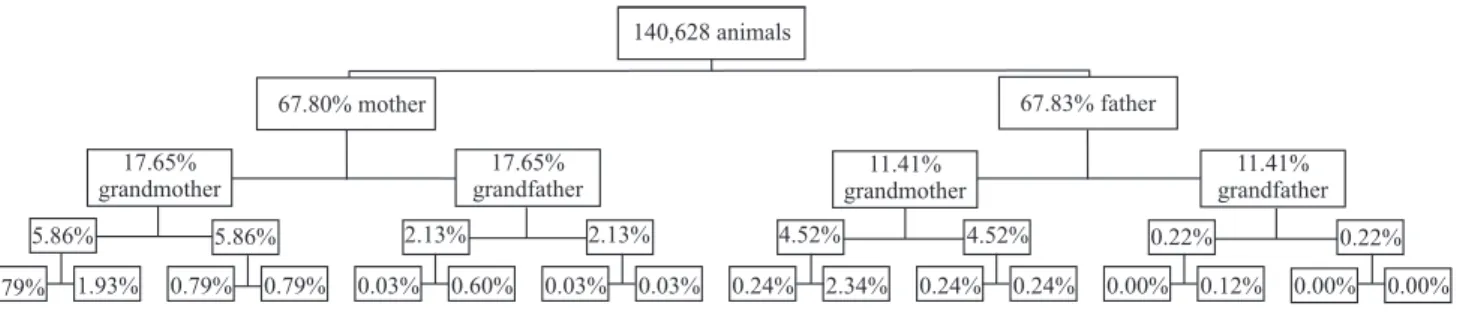
Out of the 140,628 animals studied, 67.7, 14.52,
3.18 and 0.76% had complete pedigree in the first,
second, third and fourth parental generation, respectively (Figure 4). Importantly, there was a great loss of
information from first to second parental generation:
32.3% of the animals had no known sire and dam, and
approximately 86% did not have grandparents in the
pedigree.
The AR and inbreeding were generally low throughout the study period. It is important to evaluate
Table 3. Average inbreeding coefficient (F), percentage of
inbred individuals (Inbred) and average F for inbreeding.
Generation Animals F (%) Inbred (%) Average F
1 59,774 0.00 -
-2 21,201 0.03 0.17 18.57
3 7,761 0.13 1.21 11.07
4 4,971 0.19 3.58 5.36
5 1,536 0.18 6.65 2.67
6 1,563 0.27 16.44 1.64
Table 2. Number of breeding animals (males and females),
average offspring and effective size (Ne) per period of Nelore breed registered in Northern Brazil.
Years Fathers Average offspring by
fathers
Mothers Average offspring by mothers
Ne
1950–1957 2 4.5 1 1.0 0.85
1955–1962 9 1.8 46 1.2 36.28
1960–1967 25 4.7 67 1.1 31.29
1965–1972 45 4.0 157 1.1 119.26
1970–1977 122 8.6 553 1.2 47.99 1975–1982 191 10.6 1,164 1.3 53.60 1980–1987 288 11.1 1,901 1.4 95.77 1985–1992 383 9.1 2,603 1.4 149.61 1990–1997 439 9.0 3,257 1.3 198.16 1996–2003 218 6.2 1,697 1.1 339.75
Figure 3. Nelore breed characteristics in Northern Brazil:
whether this low value is due to the control of mating between related animals or is a by-product of lack of pedigree completeness. The fact that the number of known generations are gradually increasing will allow more accurate estimates of these parameters in the future, as well as other studies of population structure and reliable estimates of genetic correlations between direct and maternal effects.
Conclusion
The genetic variability for growth traits and population structure of Nelore cattle in Northern Brazil indicates that this population has potential for genetic gain by selection, and management strategies that
reduce the high age at first calving and long generation
intervals could provide further gains in productivity.
References
ALBUQUERQUE, M. do S.M.; EGITO, A.A. do; MARQUES, J.R.F.; CIAMPI, A.Y.; MARIANTE, A. da S.; CASTRO, S.T.R.; COSTA, M.R.; PAIvA, S.R.; SIlvA, A.M. da; CONTEl, E.P.B. Variabilidade genética em búfalos estimada por marcadores RAPD.
Pesquisa Agropecuária Brasileira, v.41, p.623-628, 2006.
AZEvÊDO, D.M.M.R.; MARTINS FIlHO, R.; lÔBO, R.N.B.; MAlHADO, C.H.M.; lÔBO, R.B.; MOURA, A. de A.A.N.; PIMENTA FIlHO, E.C. Desempenho reprodutivo de vacas Nelore no Norte e Nordeste do Brasil. Revista Brasileira de Zootecnia, v.35, p.988-996, 2006. Suplemento.
BOlDMAN, K.G.; KRIESE, l.A.; vAN vlECK, l.D.; vAN TASSEl, C.P.v.; KACHMAN, S.D. A manual for use of
MTDFREML: a set of programs to obtain estimates of variances
and covariances [DRAFT]. lincoln: Agricultural Research Service, 1995. 120p.
CARNEIRO, P.l.S.; MAlHADO, C.H.M.; MARTINS FIlHO, R.; CARNEIRO, A.P.S.; SIlvA, F.F. e; TORRES, R. de A. A raça Indubrasil no Nordeste brasileiro: melhoramento e estrutura populacional. Revista Brasileira de Zootecnia, v.38, p.2327-2334, 2009.
FARIA, F.J.C.; vERCESI FIlHO, A.E.; MADAlENA, F.E.; JOSAHKIAN, l.A. Pedigree analysis in the Brazilian Zebu breeds. Journal Animal Breeding Genetics, v.126, p.148-153, 2009.
FERRAZ FIlHO, P.B.; RAMOS, A. de A.; SIlvA, l.O.C. da; SOUZA, J.C. de; AlENCAR, M.M. de; MAlHADO, C.H.M. Tendência genética dos efeitos direto e materno sobre pesos à desmama e pós-desmama de bovinos da raça Tabapuã no Brasil.
Revista Brasileira de Zootecnia, v.31, p.635-640, 2002.
GIANNOTTI, J. Di G.; PACKER, I.U.; MERCADANTE, M.E.Z. Meta‑análise para as estimativas de herdabilidade para características de crescimento em bovinos de corte. Revista
Brasileira de Zootecnia, v.34, p.1173-1180, 2005.
GOYACHE, F.; GUTIÉRREZ, J.P.; FERNÁNDEZ, I.; GÓMEZ, E.; AlvAREZ, I; DÍEZ, J.; ROYO, l.J. Using pedigree information to monitor genetic variability of endangered populations: the Xalda sheep breed of Asturias as an example. Journal of Animal
Breeding and Genetics, v.120, p.95-105, 2003.
GUTERRES, L.F.W.; RORATO, P.R.N.; BOLIGON, A.A.; WEBER, T.; KIPPERT, C.J.; lOPES, J.S.; SOUZA, P.R.S. Efeito da inclusão da covariância genética aditiva direta‑materna no modelo de análise sobre a magnitude das estimativas de parâmetros e valores genéticos preditos para ganho de peso na raça Brangus.
Ciência Rural, v.37, p.809-814, 2007.
GUTIÉRREZ, J.P.; GOYACHE, F. A note on ENDOG: a computer program for analysing pedigree information. Journal of Animal
Breeding and Genetics, v.122, p.172-176, 2005.
lIRA, T. de; ROSA, E.M.; GARNERO, A. del v. Parâmetros genéticos de características produtivas e reprodutivas em zebuínos de corte (revisão). Ciência Animal Brasileira, v.9, p.1-22, 2008.
lÔBO, R.N.B.; MADAlENA, F.E.; vIEIRA, A.R. Average estimates of genetic parameters for beef and dairy cattle in tropical regions. Animal Breeding Abstracts, v.68, p.433-462, 2000. MACClUER, J.; BOYCE, B.; DYKE, L.; LOWELL, R.; PFENNING, D.W.; PARSONS, C.J. Inbreeding and pedigree structure in Standardbred horses. Journal Heredity, n.74, p.394-399, 1983.
MAIGNEl, l.; BOICHARD, D.; vERRIER, E. Genetic variability of French dairy breeds estimated from pedigree information.
Interbull Bull, v.14, p.49-54, 1996.
MAlHADO, C.H.M.; CARNEIRO, P.l.S.; MAlHADO, A.C.M.; MARTINS, J.A.M.; MARTINS FIlHO, R.; BOZZI, R. History of registered Gyr breed in Brazilian Northeast: population structure and genetic improvement of growth traits. Ciência Rural, v.40, p.1385-1391, 2010.
MAlHADO, C.H.M.; CARNEIRO, P.l.S.; MARTINS FIlHO, R.; AZEvÊDO, D.M.M.R. Histórico genético e populacional do rebanho Nelore puro de origem no sertão nordestino. Pesquisa
Agropecuária Brasileira, v.44, p.713-718, 2009.
MAlHADO, C.H.M.; CARNEIRO, P.l.S.; PEREIRA, D.G.; MARTINS FIlHO, R. Progresso genético e estrutura populacional do rebanho Nelore no estado da Bahia. Pesquisa Agropecuária
Brasileira, v.43, p.1163-1169, 2008a.
MAlHADO, C.H.M.; RAMOS, A. de A.; CARNEIRO, P.l.S.; AZEvEDO, D.M.M.R.; MARTINS FIlHO, R.; SOUZA, J.C. de. Melhoramento e estrutura populacional de bubalinos da raça Mediterrâneo no Brasil. Pesquisa Agropecuária Brasileira, v.43, p.215-220, 2008b.
MARTÍNEZ, R.A.; GARCIA, J.l.; GAllEGO, J.l.; PÉREZ, J.; CAñÓN, J. Genetic variability in Colombian Creole cattle populations estimated by pedigree information. Journal of
Animal Science, v.86, p.545-552, 2008.
MEUWISSEN, T.H.E.; lUO, Z. Computing inbreeding coefficients in large populations. Genetic Selection Evolution, v.24, p.305-313, 1992.
PAIvA, S.R.; SIlvÉRIO, v.C.; EGITO, A.A.; MCMANUS, C.M.; FARIA, D.A.; MARIANTE, A. da S.; CASTRO, S.T.R.; ALBUQUERQUE, M. do S.M.; DERGAM, J.A. Genetic variability of the main Brazilian hair sheep breeds. Pesquisa
Agropecuária Brasileira, v.40, p.887-893, 2005.
SARMENTO, J.l.R.; PIMENTA FIlHO, E.C.; RIBEIRO, M.N.; MARTINS FIlHO, R. Efeitos ambientais e genéticos sobre ganho em peso diário de bovinos Nelore no estado da Paraíba. Revista
Brasileira de Zootecnia, v.32, p.325-330, 2003.
SAS INSTITUTE. SAS/STAT user’s guide. version 9.1. Cary:
SAS Institute, 2003.
vAlERA, M.; MOlINA, A.; GUTIÉRREZ, J.P.; GÓMEZ, J.; GOYACHE, F. Pedigree analysis in the Andalusian horse: population structure, genetic variability and influence of the Carthusian strain.
Livestock Production Science, v.95, p.57-66, 2005.
vERCESI FIlHO, A.E.; FARIA, F.J.C.; MADAlENA F.E.; JOSAHKIAN l.A. Estrutura populacional do rebanho Tabapuã registrado no Brasil. Arquivo Brasileiro de Medicina
Veterinária e Zootecnia, v.54, p.609-617, 2002.