MULTIVARIATE ANALYSIS APPLIED TO THE STUDY OF THE
RELATIONSHIP BETWEEN SOIL AND PLANT PROPERTIES
IN A PEACH ORCHARD
(1)Viviane Santos Silva Terra(2), Ricardo Alexandre Valgas(3), Carlos Reisser Júnior(3), Luis Carlos Timm(4), José Francisco Martins Pereira(3), Flávio Luiz Carpena Carvalho(3) &
Henrique Oldoni(5)
SUMMARY
In the State of Rio Grande do Sul, the municipality of Pelotas is responsible for 90 % of peach production due to its suitable climate and soil conditions. However, there is the need for new studies that aim at improved fruit quality and increased yield. The aim of this study was to evaluate the relationship that exists between soil physical properties and properties in the peach plant in the years 2010 and 2011 by the technique of multivariate canonical correlation. The experiment was conducted in a peach orchard located in the municipality of Morro Redondo, RS, Brazil, where an experimental grid of 101 plants was established. In a trench dug beside each one of the 101 plants, soil samples were collected to determine silt, clay, and sand contents, soil density, total porosity, macroporosity, microporosity, and volumetric water content in the 0.00-0.10 and 0.10-0.20 m layers, as well as the depth of the A horizon. In each plant and in each year, the following properties were assessed: trunk diameter, fruit size and number of fruits per plant, average weight of the fruit per plant, fruit pulp firmness, Brix content, and yield from the orchard. Exploratory analysis of the data was undertaken by descriptive statistics, and the relationships between the physical properties of the soil and of the plant were assessed by canonical correlation analysis. The results showed that the clay and microporosity variables were those that exhibited the highest coefficients of canonical cross-loading with the plant properties in the soil layers assessed, and
(1) Part of the Doctoral Thesis of the first author in the Graduate Studies Program in Family Farm Production Systems of the
Eliseu Maciel School of Agronomy of the Universidade Federal de Pelotas - PPGSPAF/FAEM/UFPel. Received for publication on May 21, 2013 and approved on January 30, 2014.
(2) Doctor in Agronomy from PPGSPAF/UFPel. Campus Universitário, s/n. Postal Box 354. CEP 96001-970 Pelotas (RS), Brazil.
E-mail: [email protected]
(3) Researcher, Brazilian Agricultural Research Corporation - Embrapa Clima Temperado. BR 392, Km 78. Postal Box 403. CEP
96010-971 Pelotas (RS), Brazil. E-mail: [email protected], [email protected], [email protected], [email protected]
(4) Associate Professor, Department of Rural Engineering, FAEM/UFPel. CNPq Scholarship holder. E-mail: [email protected] (5) Undergraduate student in Agriculture Engineering, CENG/UFPel. PIBIC-CNPq Scholarship holder. E-mail:
that the variable of mean weight of the fruit per plant was that which had the highest coefficients of canonical loading within the plant group for the two years assessed.
Index terms: Prunus persica, canonical correlation, soil physical properties.
RESUMO:ANÁLISE MULTIVARIADA APLICADA NO ESTUDO DA RELAÇÃO ENTRE OS ATRIBUTOS DO SOLO E DA PLANTA EM POMAR DE PESSEGUEIRO
No Estado do Rio Grande do Sul, o município de Pelotas é responsável por 90 % da produção de pêssego, possuindo condições de clima e solo para a sua produção; porém, existe a necessidade de novas pesquisas que visem à melhoria na qualidade do fruto e no aumento da produtividade. Este trabalho teve como objetivo avaliar as relações existentes entre os atributos físicos do solo e da planta de pessegueiro, nos anos de 2010 e 2011, por meio da técnica multivariada de correlação canônica. O experimento foi conduzido em um pomar de pessegueiro situado no município de Morro Redondo, RS, onde foi estabelecida uma malha experimental constituída de 101 plantas. Em uma trincheira aberta ao lado de cada uma das 101 plantas, foram coletadas amostras de solo para determinar os teores de silte, argila, areia, densidade do solo, porosidade total, macroporosidade, microporosidade e umidade volumétrica, nas camadas de 0,00-0,10 e 0,10-0,20 m. Em cada planta e em cada ano, foram avaliados os seguintes atributos: diâmetro do tronco, tamanho e número de frutos por planta, peso médio do fruto por planta, firmeza da polpa, teor de Brix e produtividade do pomar. A profundidade do horizonte A do solo na área experimental também foi avaliada. A análise exploratória dos dados foi realizada por meio da estatística descritiva, e as relações entre os atributos físicos do solo e da planta foram avaliadas pela análise de correlação canônica. Os resultados evidenciaram que as variáveis argila e microporosidade foram as que apresentaram maior coeficiente de carga canônica cruzada com os atributos da planta nas camadas de solo avaliadas, e que a variável peso médio do fruto por planta foi a que demonstrou os maiores valores de correlação dentro do grupo da planta para os dois anos avaliados.
Termos de indexação: Prunus persica, correlação canônica, atributos físicos do solo.
INTRODUCTION
Fruit growing in a temperate climate in the southern half of the State of Rio Grande do Sul is one of the agricultural activities that has gained prominence in recent years due to its high profitability in small areas, and it is present in many of the family farm properties of this region. Among the fruit-bearing crops in a temperate climate, the peach has been an option for crop diversification within these rural properties, as well as an option for generation and maintenance of jobs in the rural area. According to Herter et al. (2003), this is due to the fact that the region has favorable climate and soil conditions for peach production.
Timm et al. (2007) mention that there is a lack of studies that seek to evaluate the soil-plant interactions of the peach tree since peach fruit quality is the result of the interaction of various factors, including topography of the site, the soil, water, climate, and the management practices adopted in production (Herter et al., 2003). Thus, one of the main factors that should be taken into consideration in planning for establishment of an orchard is the initial condition of the soil, which may be checked through analysis of
its physical and chemical properties. From the physical point of view, the structural quality of soils has been associated with conditions favorable to growth of the root system, aeration, water infiltration, and movement in the soil profile, conditions which do not limit root penetration and water and nutrient uptake and, consequently, do not restrict crop development (Coelho Filho et al., 2001; Li et al., 2002).
Schmildt et al. (2011) used canonical correlation analysis to study the relationship between plant characteristics and the capacity for formation of sprouts after pruning.
Seeking to test the hypothesis that soil structural conditions affect the growth and yield properties of the peach orchard, as well as fruit quality, the aim of the present study was to evaluate the relationships that exist between soil physical properties and the peach tree plant in the years 2010 and 2011 in an orchard located in the municipality of Morro Redondo, RS, Brazil, by the technique of multivariate canonical correlation.
MATERIAL AND METHODS
The present study was carried out in the years 2010 and 2011 in a peach orchard located in the municipality of Morro Redondo, RS. The geographical coordinates of the experimental area are 31o 31’ 55.30" latitude South and 52o 35’ 37.87" longitude West. Climate in the region, according to the Köppen climate classification, is the “Cfa” type, i.e., humid subtropical with hot summers. The region has an annual mean temperature of 18 °C and annual mean rainfall of 1,509.2 mm, and relative humidity of 78.8 %. The soil was classified according to Santos et al. (2006) as Argissolo Bruno-Acinzentado and as Aquertic Hapludalf based on the US Soil Taxonomy system (NRCS, 2009).
The peach orchard evaluated was composed of the Esmeralda cultivar with trees of three years of age at the beginning of the study, and an experimental grid was established of 101 plants out of a total of 1450. The crop practices (soil fertilization, weed management, plant health management, pruning, and thinning) were performed according to the recommendations of Medeiros & Raseira (1998). In July 2010, disturbed and undisturbed soil samples were collected at the 0.00-0.10 and 0.10-0.20 m layers in a trench opened beside each one of the 101 plants. The samples were identified, packaged, and taken to the Soil Physics Laboratory of Embrapa Clima Temperado (Pelotas, RS) to determine the following soil physical properties in each layer: sand, silt, and clay percentages by the Pipette Method (Gee & Or, 2002); soil bulk density (BD) by the (volumetric) soil sample ring method (Grossman & Reinsch, 2002); and total porosity (TP), macroporosity (MA), and microporosity (MI) (Embrapa, 1997). At each experimental point and in each layer, moisture content was determined based on volume at the time of collection. The depth of the “A” horizon was demarcated at each point with the aid of a soil auger. Soil physical properties were identified in the following manner: in the 0.00-0.10 m layer - SAN1 (sand), SIL1 (silt), CLA1 (clay), BD1 (bulk density),
MA1 (macroporosity), MI1 (microporosity), TP1 (total porosity), and VM1 (volumetric moisture); and in the 0.10-0.20 m layer - SAN2, SIL2, CLA2, BD2, MA2, MI2, TP2, VM2, and DAH (depth of “A” horizon).
In the 101 peach tree plants, the following determinations were made (2010 and 2011) and identified as indicated: 2010 - TD10 (trunk diameter), FSP10 (fruit size per plant), NFP10 (total number of fruits per plant), MFWP10 (mean fruit weight per plant), F10 (pulp firmness), B10 (Brix content), and Y10 (yield); and in the year 2011: TD11, FSP11, NFP11, MFWP11, F11, B11, and Y11. Pulp firmness and Brix content were determined according to the methods described in Manzino et al. (1987), and the other variables were determined according to Medeiros & Raseira (1998).
The R statistical software (R Core Team, 2012) was used for data analysis. The coefficient of variation (CV) was classified according to Wilding & Drees (1983) as CV 15 %, 15 % < CV 35 %, and CV > 35 %; representing low, moderate, and high, respectively. To test the normality hypothesis of data distribution, the test of Shapiro & Wilk (1965) was performed at the 5 and 1 % significance levels.
In canonical correlation analysis, 17 soil physical properties were considered in the year 2010, denoted as X’ (x1, x2, x3,..., x17), and 7 plant properties in each year (2010 and 2011), denoted as Y’ (y1, y2, y3,..., Y7).
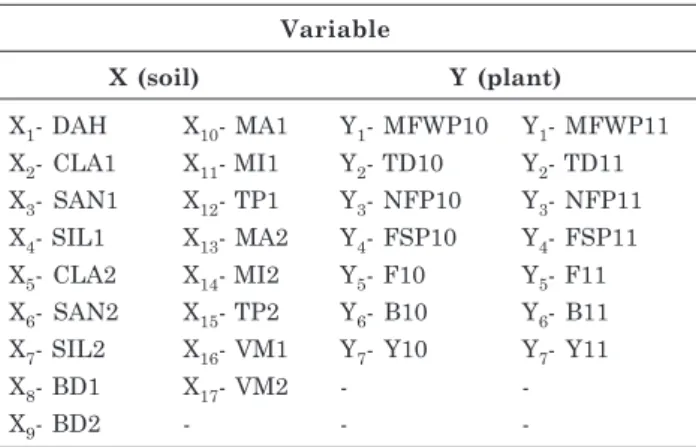
Identification of the variables in each group is shown in table 1.
In the linear combinations X1 = a1x1 + ... + apxp
and Y1 = b1y1 + ... + bqyq, the values a’ = [a1...ap] and
Variable
X (soil) Y (plant)
X1- DAH X10- MA1 Y1- MFWP10 Y1- MFWP11 X2- CLA1 X11- MI1 Y2- TD10 Y2- TD11 X3- SAN1 X12- TP1 Y3- NFP10 Y3- NFP11 X4- SIL1 X13- MA2 Y4- FSP10 Y4- FSP11 X5- CLA2 X14- MI2 Y5- F10 Y5- F11 X6- SAN2 X15- TP2 Y6- B10 Y6- B11 X7- SIL2 X16- VM1 Y7- Y10 Y7- Y11
X8- BD1 X17- VM2 -
-X9- BD2 - -
-Table 1. Identification of the variables in each group
Soil variables: 1 - 0.00-0.10 m layer and 2 - 0.10-0.20 m layer; plant variables: 10: year of 2010, 11: year of 2011; -: does not have values; DAH: depth of A horizon (cm); CLA: clay content (g kg-1); SAN: sand content (g kg-1); SIL: silt content (g kg-1);
b’ = [b1...bq] are the vectors of the weights of the
characteristics corresponding to groups 1 and 2, respectively. The first canonical correlation corresponds to the following equation:
(
)
( )
1( )
1 1 1 1 Y var X var Y , X cov r =which maximizes the relationship between the functions X1 and Y1 that represent the first canonical
pair, with: cov(X1,Y1) = a’S12b; var(X1) = a’S11a;
var(Y1) = b’S22b; S11 = pxp matrix of covariances of
the traits of group 1; S22 = qxq matrix of covariance of
the traits of group 2; and S12 = pxq matrix of covariances between the traits of groups 1 and 2.
With R11, R22, and R12 being the sample correlation
matrices, the first canonical correlation (r1), corresponding to the first canonical pair, is the square
root of the first eigenvalue
(
r1= l1)
, the solution ofthe equation 1 12 11 22
11R R R
R - -l . The weighted coefficients of the canonical pairs are known as eigenvectors and are associated with the respective eigenvalues. The significance test applied for each canonical correlation was the chi-square (χ²):
(
)
[
]
[
(
2)
]
i s
1 i 2 n 0.5p q 3 ln 1 r x =- - + + P=
-where n = number of observations; p = number of variables of the X group (independent); q = number of variables of the Y group (dependent), 2
i
r = square of the canonical correlation of the equation to be tested. Canonical loading and canonical cross-loading were also evaluated, the latter measure being more used for analysis of the functions and, moreover, the measure adopted by the main statistical packages. These loadings include the correlation between each variable (dependent or independent) and the index of their respective group.
RESULTS AND DISCUSSION
Table 2 exhibits the descriptive statistics for the data in reference to the plant properties in the years 2010 and 2011, showing that, for both years, the mean values of the variables for mean fruit weight per plant (MFWP), trunk diameter (TD), fruit size per plant (FSP), firmness (F), and Brix (B) are similar. Nevertheless, this behavior cannot be seen for the number of fruits per plant (NFP) and yield (Y) variables.
The data spread around the mean, expressed by the coefficient of variation (CV), was low (CV 15%) for the variables for MFWP, TD, FSP, F, and B for the years 2010 and 2011 (Table 2), according to the classification proposed by Wilding & Drees (1983). The number of fruits per plant (NFP) and yield (Y)
variables exhibited a spread classified as moderate (15 % < CV 35 %) in the year 2011. The CV values calculated were high (CV > 35 %) for the number of fruits per plant (NFP) (CV = 54.6 %) and yield (Y) (CV = 55.7 %) variables in the year 2010. The variability of the data of NFP and Y may be attributed to the occurrence of high wind (72.4 km h-1) in the
experimental area on October 31, 2010, which caused a great deal of windfall and thus heterogeneity in the distribution of the number of fruits per plant throughout the orchard and, consequently, a reduction in peach yield. It may also be seen in table 2 that the residual distributions of the NFP and Y did not follow the tendency toward normality in the year 2010 by the Shapiro & Wilk test (p 0.05); nevertheless, for the year 2011, they showed a tendency toward normality. For the other variables, there was no change in the tendency of distribution, showing the same tendency in the two years.
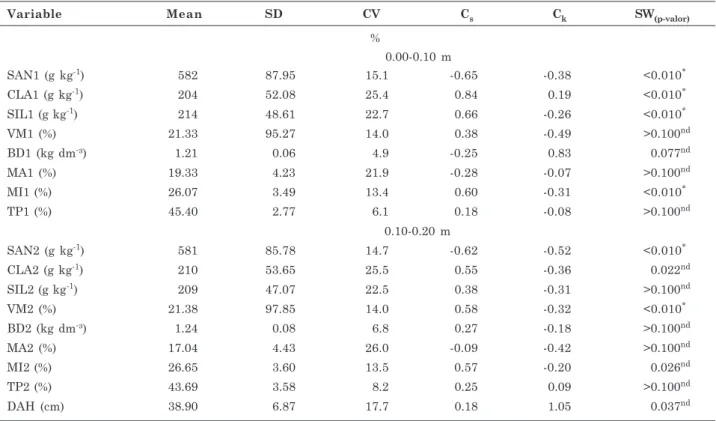
In table 3, the values of the descriptive statistics for the soil physical properties determined in the 0.00-0.10 and 0.00-0.10-0.20 m layers are shown. It may be observed that, in both layers, the mean values of the BD and TP variables are similar. The data spread around the mean value was low (CV 15 %) for the variables for BD, MI, TP, and volumetric moisture (VM) in the two layers, and for the sand (SAN) variable in the layer from 0.10-0.20 m. Nevertheless, the distributions of the variables for clay (CLA), silt (SIL), MA (in both layers), SAN (0.00-0.10 m layer), and depth of the “A” horizon (DAH) were classified as moderate (Table 3) (Wilding & Drees, 1983). The distributions of the variables for bulk density (BD), macroporosity (MA) and total porosity (TP) in both layers, and volumetric moisture (VM) (0.00-0.10 m) followed the trend toward normality by the Shapiro & Wilk test (p 0.01) (Table 3) as well as the distributions of the variables CLA, SIL, and MI in the 0.10-0.20 m layer and DAH. In contrast, the distributions of clay, silt, and microporosity in the layer of 0.00-0.10 m and VM (0.10-0.20 m) did not show a tendency toward normality of the data by the Shapiro & Wilk test (p 0.01) (Table 3). The same results are found for the distributions of sand in both layers.
Variable Mean SD CV Cs Ck SW(p-valor)
%
0.00-0.10 m
SAN1 (g kg-1) 582 87.95 15.1 -0.65 -0.38 <0.010*
CLA1 (g kg-1) 204 52.08 25.4 0.84 0.19 <0.010*
SIL1 (g kg-1) 214 48.61 22.7 0.66 -0.26 <0.010*
VM1 (%) 21.33 95.27 14.0 0.38 -0.49 >0.100nd
BD1 (kg dm-³) 1.21 0.06 4.9 -0.25 0.83 0.077nd
MA1 (%) 19.33 4.23 21.9 -0.28 -0.07 >0.100nd
MI1 (%) 26.07 3.49 13.4 0.60 -0.31 <0.010*
TP1 (%) 45.40 2.77 6.1 0.18 -0.08 >0.100nd
0.10-0.20 m
SAN2 (g kg-1) 581 85.78 14.7 -0.62 -0.52 <0.010*
CLA2 (g kg-1) 210 53.65 25.5 0.55 -0.36 0.022nd
SIL2 (g kg-1) 209 47.07 22.5 0.38 -0.31 >0.100nd
VM2 (%) 21.38 97.85 14.0 0.58 -0.32 <0.010*
BD2 (kg dm-³) 1.24 0.08 6.8 0.27 -0.18 >0.100nd
MA2 (%) 17.04 4.43 26.0 -0.09 -0.42 >0.100nd
MI2 (%) 26.65 3.60 13.5 0.57 -0.20 0.026nd
TP2 (%) 43.69 3.58 8.2 0.25 0.09 >0.100nd
DAH (cm) 38.90 6.87 17.7 0.18 1.05 0.037nd
Table 3. Descriptive statistics for the soil physical properties
SAN: sand; SIL: silt; CLA: clay; BD: bulk density; MA: macroporosity; MI: microporosity; TP: total porosity; VM: volumetric moisture; 1: 0.00-0.10 m depth; 2: 0.10-0.20 m depth; DAH: depth of the A horizon; SD: standard deviation; CV: coefficient of variation; Cs: coefficient of asymmetry; Ck: coefficient of kurtosis; SW: Shapiro and Wilk Test; *: property does not follow normal distribution at 1 %; nd: property follows normal distribution at least at 1 %.
Variable Mean SD CV Cs Ck SW(p-value)
% 2010
MFWP10 (kg) 0.11 0.01 13.6 -0.44 0.78 >0.100nd
TD10 (cm) 7.13 0.74 10.5 -0.04 -0.52 >0.100nd
NFP10 (-) 57.53 31.39 54.6 0.40 -0.76 0.025*
FSP10 (cm) 57.54 2.94 5.1 -0.19 -0.11 >0.100nd
F10 (Lb) 7.19 0.97 13.6 0.22 0.29 >0.100nd
B10 (%) 13.08 1.12 8.6 0.10 0.62 >0.100nd
Y10 (kg ha-1) 6.41 3.56 55.7 0.53 -0.33 0.034*
2011
MFWP11 (kg) 0.11 0.01 8.3 0.29 -0.19 >0.100nd
TD11 (cm) 8.38 1.11 13.3 -0.43 0.80 >0.100nd
NFP11 (-) 180.54 48.34 26.8 -0.01 -0.11 >0.100nd
FSP11 (cm) 50.40 2.66 5.3 0.55 0.80 0.080nd
F11 (Lb) 7.85 0.99 12.7 0.03 0.74 >0.100nd
B11 (%) 12.46 0.96 7.7 0.01 0.07 >0.100nd
Y11 (kg ha-1) 20.11 5.32 26.5 -0.17 -0.39 >0.100nd
Table 2. Parameters of the descriptive statistics for plant properties in the years 2010 and 2011
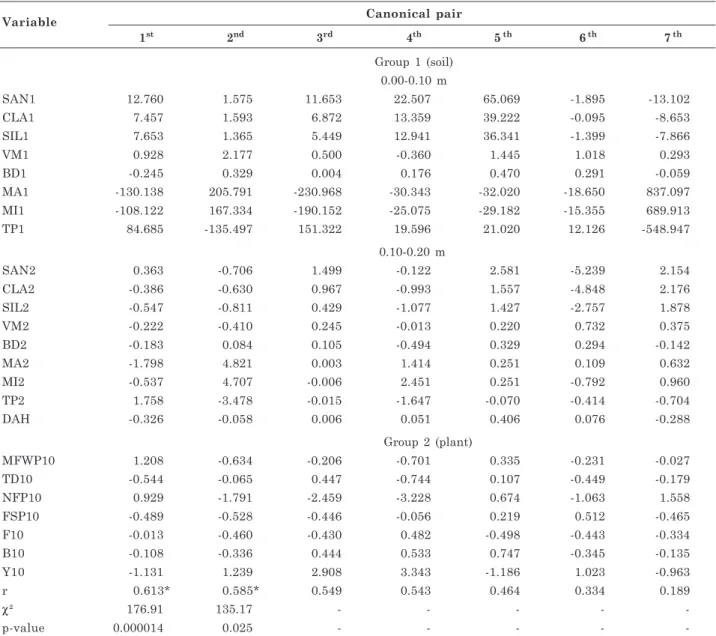
has 17 variables and group 2 is composed of seven variables, thus allowing the formation of seven canonical pairs in all. It may be observed in table 4 that the first canonical pair showed a correlation coefficient r equal to 0.613, and was significant by the chi-square test (p-value = 0.000014). The second canonical pair also showed significant correlation (r = 0.585), with a p-value of 0.025. It may further be seen in table 4 that, in both pairs, the variables for MA, MI, and TP, are correlated in a direct manner among themselves, for MI was obtained by the difference between MA and TP in both layers. In the face of this situation, the interpretation and analysis
of the coefficients of the first and second canonical pair may lead to a mistaken understanding because the variables that are really important might not be easily identified. Thus, it is necessary to apply analysis of the canonical loadings which allow one to clearly and objectively identify the contribution of each variable, both for its group and for the other. The canonical correlation coefficients between the group of soil variables and the group of plant variables in the year 2011 are shown in table 5. It may be observed that only the first canonical pair was significant at 5 % by the chi square test (p-value = 0.0078), showing a correlation (r = 0.615) slightly greater than the year 2010 (r = 0.613). The
Variable Canonical pair
1st 2nd 3rd 4th 5 th 6 th 7 th
Group 1 (soil) 0.00-0.10 m
SAN1 12.760 1.575 11.653 22.507 65.069 -1.895 -13.102
CLA1 7.457 1.593 6.872 13.359 39.222 -0.095 -8.653
SIL1 7.653 1.365 5.449 12.941 36.341 -1.399 -7.866
VM1 0.928 2.177 0.500 -0.360 1.445 1.018 0.293
BD1 -0.245 0.329 0.004 0.176 0.470 0.291 -0.059
MA1 -130.138 205.791 -230.968 -30.343 -32.020 -18.650 837.097
MI1 -108.122 167.334 -190.152 -25.075 -29.182 -15.355 689.913
TP1 84.685 -135.497 151.322 19.596 21.020 12.126 -548.947
0.10-0.20 m
SAN2 0.363 -0.706 1.499 -0.122 2.581 -5.239 2.154
CLA2 -0.386 -0.630 0.967 -0.993 1.557 -4.848 2.176
SIL2 -0.547 -0.811 0.429 -1.077 1.427 -2.757 1.878
VM2 -0.222 -0.410 0.245 -0.013 0.220 0.732 0.375
BD2 -0.183 0.084 0.105 -0.494 0.329 0.294 -0.142
MA2 -1.798 4.821 0.003 1.414 0.251 0.109 0.632
MI2 -0.537 4.707 -0.006 2.451 0.251 -0.792 0.960
TP2 1.758 -3.478 -0.015 -1.647 -0.070 -0.414 -0.704
DAH -0.326 -0.058 0.006 0.051 0.406 0.076 -0.288
Group 2 (plant)
MFWP10 1.208 -0.634 -0.206 -0.701 0.335 -0.231 -0.027
TD10 -0.544 -0.065 0.447 -0.744 0.107 -0.449 -0.179
NFP10 0.929 -1.791 -2.459 -3.228 0.674 -1.063 1.558
FSP10 -0.489 -0.528 -0.446 -0.056 0.219 0.512 -0.465
F10 -0.013 -0.460 -0.430 0.482 -0.498 -0.443 -0.334
B10 -0.108 -0.336 0.444 0.533 0.747 -0.345 -0.135
Y10 -1.131 1.239 2.908 3.343 -1.186 1.023 -0.963
r 0.613* 0.585* 0.549 0.543 0.464 0.334 0.189
χ² 176.91 135.17 - - - -
-p-value 0.000014 0.025 - - - -
-Table 4. Coefficients of canonical correlations (r) and canonical pairs between the group of soil physical variables (group 1) and the group of plant variables (group 2) in the year 2010
SAN: sand (g kg-1); SIL: silt (g kg-1); CLA: clay (g kg-1); BD: bulk density (kg dm-3); MA: macroporosity (%); MI: microporosity (%);
TP: total porosity (%); VM: volumetric moisture (%); 1: depth of 0.00-0.10 m; 2: depth of 0.10-0.20 m; DAH: depth of A horizon (cm); MFWP: mean fruit weight per plant (kg); TD: trunk diameter (cm); NFP: number of fruits per plant; FSP: fruit size per plant (cm); F: pulp firmness (Lb); B: Brix content (%); Y: yield (kg ha-1); -: do not have values; 10: year of 2010;
χ²: chi square calculated;
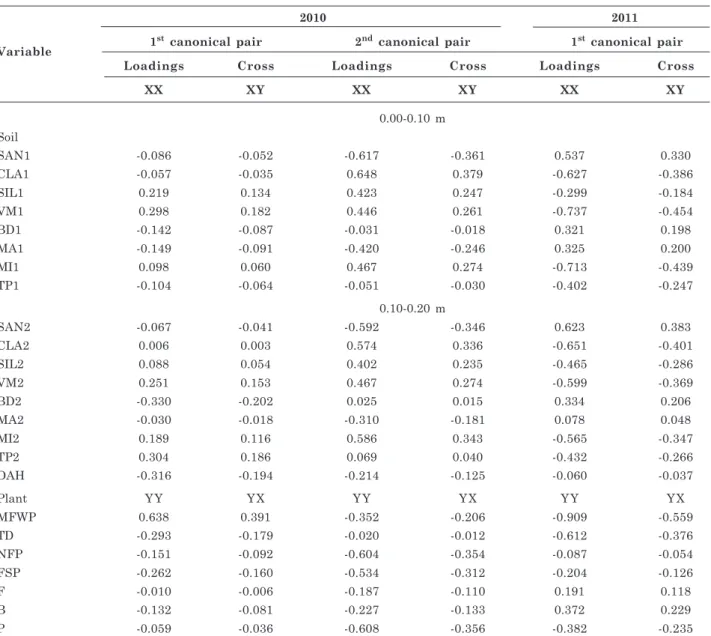
problem of multicollinearity in the year 2010 among the MA, MI, and TP variables was also observed in analysis of the 2011 data, seen by the high values of the coefficients of the first canonical pair in relation to the others. Thus, we chose to adopt the same criterion in analysis of canonical loadings for the year 2011.
In canonical correlation analysis, we sought to verify the relationships that exist between the group of soil variables, in each one of the layers, and the group of plant variables for the years 2010 and 2011. Due to the occurrence of high wind in the year 2010 in the experimental area, as cited above, we believe
that the results of the correlations between the variables of the two groups do not represent that which was expected for the year. Thus, we chose to analyze and discuss the results in reference to the correlations between the soil physical properties, in each one of the layers, and the plant properties only for the year 2011. The values of the coefficients of canonical cross-loading between the group of soil physical variables, in both layers, and the group of plant variables for the year 2011 are shown in table 6.
Analyzing the canonical loadings for the year 2011 (Table 6), which indicate the contribution of each
Variable Canonical pair
1st 2nd 3rd 4th 5 th 6 th 7 th
Group 1 (soil) 0.00-0.10 m
SAN1 10.655 -104.056 34.211 91.890 17.277 16.692 44.825
CLA1 7.006 -61.632 22.518 52.809 10.075 9.517 25.003
SIL1 7.043 -57.375 20.046 50.534 9.387 9.437 23.950
VM1 0.380 0.059 -0.855 0.008 -2.167 0.969 0.037
BD1 0.045 0.148 -0.170 0.061 -0.563 -0.709 0.451
MA1 224.719 -40.252 -79.482 477.518 -513.580 227.450 -403.560
MI1 184.474 -32.448 -63.703 394.977 -421.698 187.569 -332.439
TP1 -147.731 26.268 52.390 -313.298 336.848 -149.661 265.214
0.10-0.20 m
SAN2 -0.798 -1.435 -1.150 -1.172 0.946 1.423 -1.671
CLA2 -1.734 -0.963 -2.370 0.329 0.013 0.983 0.555
SIL2 -1.434 -1.142 -2.275 -0.566 -0.215 0.168 0.354
VM2 0.334 1.466 -1.287 0.234 0.328 0.518 -0.074
BD2 0.071 0.683 -0.674 -0.503 -0.0001 1.139 0.294
MA2 1.103 -1.425 -1.718 0.021 -1.977 3.071 -0.754
MI2 0.986 -2.806 -1.372 -0.028 -1.241 1.791 -1.860
TP2 -1.027 1.056 0.957 -0.435 1.935 -2.028 0.225
DAH -0.070 0.471 0.124 -0.117 -0.018 -0.394 -0.109
Group 2 (plant)
MFWP11 -0.626 -0.038 0.523 -0.051 0.826 0.089 -2.476
TD11 -0.323 -0.253 -0.176 -0.559 0.493 0.787 0.604
NFP11 0.786 1.185 1.822 -1.013 3.951 1.457 -6.433
FSP11 0.100 0.421 -0.517 0.535 0.649 0.347 0.381
F11 0.164 -0.149 0.230 0.676 -0.420 0.618 0.208
B11 -0.129 -0.874 -0.046 0.295 0.604 -0.366 0.367
Y11 -0.886 -0.927 -1.033 1.591 -3.632 -2.041 6.658
r 0.615* 0.547n.s. 0.473 0.436 0.395 0.305 0.227
χ² 143.21 101.08 - - - -
-p-value 0.0078 0.590 - - - -
-Table 5. Coefficients of canonical correlations (r) and canonical pairs between the group of soil physical variables (group 1) and the group of plant variables (group 2) in the year 2011
SAN: sand (g kg-1); SIL: silt (g kg-1); CLA: clay (g kg-1); BD: bulk density (kg dm-3); MA: macroporosity (%); MI: microporosity (%);
TP: total porosity (%); VM: volumetric moisture (%); 1: depth of 0.00-0.10 m; 2: depth of 0.10-0.20 m; DAH: depth of A horizon (cm); MFWP: mean fruit weight per plant (kg); TD: trunk diameter (cm); NFP: number of fruits per plant; FSP: fruit size per plant (cm); F: pulp firmness (Lb); B: Brix content (%); Y: yield (kg ha-1); -: do not have values; 11: year of 2011;
χ²: chi square calculated;
Variable
2010 2011
1st canonical pair 2nd canonical pair 1st canonical pair Loadings Cross Loadings Cross Loadings Cross
XX XY XX XY XX XY
0.00-0.10 m Soil
SAN1 -0.086 -0.052 -0.617 -0.361 0.537 0.330
CLA1 -0.057 -0.035 0.648 0.379 -0.627 -0.386
SIL1 0.219 0.134 0.423 0.247 -0.299 -0.184
VM1 0.298 0.182 0.446 0.261 -0.737 -0.454
BD1 -0.142 -0.087 -0.031 -0.018 0.321 0.198
MA1 -0.149 -0.091 -0.420 -0.246 0.325 0.200
MI1 0.098 0.060 0.467 0.274 -0.713 -0.439
TP1 -0.104 -0.064 -0.051 -0.030 -0.402 -0.247
0.10-0.20 m
SAN2 -0.067 -0.041 -0.592 -0.346 0.623 0.383
CLA2 0.006 0.003 0.574 0.336 -0.651 -0.401
SIL2 0.088 0.054 0.402 0.235 -0.465 -0.286
VM2 0.251 0.153 0.467 0.274 -0.599 -0.369
BD2 -0.330 -0.202 0.025 0.015 0.334 0.206
MA2 -0.030 -0.018 -0.310 -0.181 0.078 0.048
MI2 0.189 0.116 0.586 0.343 -0.565 -0.347
TP2 0.304 0.186 0.069 0.040 -0.432 -0.266
DAH -0.316 -0.194 -0.214 -0.125 -0.060 -0.037
Plant YY YX YY YX YY YX
MFWP 0.638 0.391 -0.352 -0.206 -0.909 -0.559
TD -0.293 -0.179 -0.020 -0.012 -0.612 -0.376
NFP -0.151 -0.092 -0.604 -0.354 -0.087 -0.054
FSP -0.262 -0.160 -0.534 -0.312 -0.204 -0.126
F -0.010 -0.006 -0.187 -0.110 0.191 0.118
B -0.132 -0.081 -0.227 -0.133 0.372 0.229
P -0.059 -0.036 -0.608 -0.356 -0.382 -0.235
Table 6. Analysis of the group indexes through the canonical loadings and canonical cross-loadings for the years 2010 and 2011
SAN: sand (g kg-1); SIL: silt (g kg-1); CLA: clay (g kg-1); BD: bulk density (kg dm-3); MA: macroporosity (%); MI: microporosity (%);
TP: total porosity (%); VM: volumetric moisture (%); 1: depth of 0.00-0.10 m; 2: depth of 0.10-0.20 m; DAH: depth of A horizon (cm); MFWP: mean fruit weight per plant (kg); TD: trunk diameter (cm); NFP: number of fruits per plant; FSP: fruit size per plant (cm); F: pulp firmness (Lb); B: Brix content (%); Y: yield (kg ha-1); loadings: canonical loadings; and cross: canonical cross-loadings.
variable to its own group, it may be seen that in the soil group, the CLA variable, related to soil texture, showed the highest values of the correlation coefficient (-0.627 in the 0.00-0.10 m layer and -0.651 in the 0.10-0.20 m layer) with the other variables belonging to this group. It may also be seen that this variable, in both layers, has the opposite sign of the coefficient of canonical loading in relation to SAN, BD, and MA, which was expected. In contrast, the signs of the coefficients of canonical loadings of VM, TP, and MI are equal to that of the CLA variable, corroborating the expected result. Among the variables linked to soil structure (BD, MA, MI, and TP), the MI variable
the NFP variable, this same relationship is not in evidence. From canonical analysis, it may also be observed that the B and F variables are related in the direction opposite to the other plant variables since, normally, larger fruits (MFWP and FSP) have greater cell size and, consequently, less concentration of solutes and less firmness, especially if this effect of cell growth is a consequence of better moisture conditions. The greater value of the coefficient of canonical loading of the Y variable in the year 2011 (-0.382) reflects, within the group of plant variables, the greater values of the other coefficients of the variables linked to peach production (MFWP, TD, and FSP).
Among the variables related to soil texture, the CLA variable was that which exhibited the greatest coefficients of canonical cross-loading (-0.386 and -0.401 in the 0.00-0.10 and 0.10-0.20 m layers, respectively) with the plant group variables. As mentioned above, this variable also stood out in the correlation with its own group. Among the variables linked to soil structure, MI exhibited the greatest values of the coefficient of canonical cross-loading (-0.439 in the 0.00-0.10 m layer and -0.347 in the 0.10-0.20 m layer) with those belonging to the plant group, suggesting that soil MI, which is directly related to water storage in the soil (Reichardt & Timm, 2012), affected the behavior of the plant variables in this study. The values of the coefficients of canonical cross-loading between the VM variable (-0.454 in the 0.00-0.10 m layer and -0.369 in the 0.10-0.20 m layer) and the group of plant variables provided evidence of the fact that VM of the soil is a variable that integrates factors related to its texture (CLA) and structure (MI). This result is corroborated when correlation in the direction of the plant variables with the soil group variables (Table 6) is analyzed because the signs of the coefficients of canonical cross-loadings are the same (negative), indicating that the variables that represent FSP and TD are directly related to soil water availability (Simões, 2007).
CONCLUSIONS
1. The clay and microporosity variables are those that show the greatest coefficient of canonical cross-loading with the plant properties in the soil layers evaluated.
2. The mean fruit weight per plant and trunk diameter variables are those that show the greatest correlation values within the plant group for the two years evaluated.
3. The mean fruit weight per plant and trunk diameter variables are directly related to the volumetric moisture of the soil, which is a variable that integrates factors related to texture and soil structure.
ACKNOWLEDGMENTS
To Embrapa Temperate Agricultável - RS for its infrastructure, to the producer Marcus Fiss for granting the experimental area, and to the CAPES for granting a scholarship.
LITERATURE CITED
AMARANTE, C.V.T.; CHAVES, D.V. & ERNANI, P.R. Análise multivariada de atributos nutricionais associados ao “bitter pit” em maçãs Gala. Pesq. Agropec. Bras., 41:841-846, 2006.
COELHO FILHO, M.A.; COELHO, R.D. & GONÇALVES, A.C.A. Variabilidade espacial de varáveis físico-hídricas do solo em um pomar de lima ácida Tahiti, irrigado por microaspersão. R. Bras. Eng. Agríc. Amb., 5:239-246, 2001. COIMBRA, J.L.M.; GUIDOLIN, A.F.; ALMEIDA, M.L.; SANGOI, L.; ENDER, M. & MEROTTO JÚNIOR, A. Análise de trilha dos componentes do rendimento de grãos em genótipos de canola. Ci. Rural, 34:1421-1428, 2004. COIMBRA, J.L.M.; GUIDOLIN, A.F.; CARVALHO, F.I.F. &
AZEVEDO, R. Correlações canônicas: II - Análise do rendimento de grãos de feijão e seus componentes. Ci. Rural, 30:31-35, 2000.
CRUZ, C.D.; REGAZZI, A.J. & CARNEIRO, P.C.S. Modelos biométricos aplicados ao melhoramento genético. 3.ed. Viçosa, MG, Universidade Federal de Viçosa, 2003. 480p. EMPRESA BRASILEIRA DE PESQUISA AGROPECUÁRIA -EMBRAPA. Centro Nacional de Pesquisa de Solos. Manual de métodos de análise de solo. 2.ed. Rio de Janeiro, 1997. 212p.
GEE, G.W. & OR, D. The solid phase: Particle-Size analysis. In: DANE, J.H. & TOPP, G.C., eds. Methods of soil analysis. Physical methods. Madison, Soil Science Society of America, 2002. Part 4. p.255-293.
GROSSMAN, R.B. & REINSCH, T.G. The solid phase: Bulk density and linear extensibility. In: DANE, J.H. & TOPP, G.C., eds. Methods of soil analysis: Physical methods. Madison, Soil Science Society of America, 2002. Part 4. p.201-228.
HERTER, F.G.; SACKS, S.; CARVALHO, F.L.C. & FLORES, C.A. Condições de clima e solo para instalação do pomar. In: RASEIRA, M.C.B. & CENTELLAS-QUEZADA, A., eds. Pêssego. Brasília, Embrapa Informação Tecnológica, 2003. p.36-40.
LI, H.; LASCANO, R.J.; BOOKER, J.; WILSON, L.T.; BRONSON, K.F. & SEGARRA, E. State-space description of heterogeneity: Water and nitrogen use in cotton. Soil Sci. Soc. Am. J., 66:585-595, 2002.
MEDEIROS, C.A.B. & RASEIRA, M.C.B., ed. Cultura do pessegueiro. Brasília, Embrapa-CPACT, 1998. 350p. (Embrapa-387 SPI)
NRCS, 2009. Available at: <http://soils.usda.gov/technical/ classification/tax_keys>. Accessed: Jan. 27, 2014. R CORE TEAM. R: A language and environment for statistical
computing. R version 2.15.1. Viena, R Foundation for Statistical Computing, 2012.
REICHARDT, K. & TIMM, L.C. Solo, planta e atmosfera: Conceitos, processos e aplicações. 2.ed. Barueri, Manole, 2012. 524p.
RIGÃO, M.H.; STORCK, L.; BISOGNIN, D.A. & LOPES, S.J. Correlação canônica entre caracteres de tubérculos para seleção precoce de clones de batata. Ci. Rural, 39:2347-2553, 2009.
SANTOS, H.G.D.; JACOMINE, P.K.T.; ANJOS, L.H.C.D.; OLIVEIRA, V.A.D.; OLIVEIRA, J.B.D.; COELHO, M.R.; LUMBRERAS, J.F. & CUNHA, T.J.F., eds. Sistema brasileiro de classificação de solos. 2.ed. Rio de Janeiro, Embrapa Solos, 2006. 306p.
SANTOS, C.A.F.; CAVALCANTI, J.; PAINI, J.N. & CRUZ, C.D. Correlações canônicas entre componentes primários e secundários da produção de grãos em guandu (Cajanus cajan (L.) Millsp). R. Ceres, 41:459-464, 1994.
SCHMILDT, O.; SILVA, C.A.; FERREGUETE, G.A.; SCHMILDT, E.R. & CZEPAK, M.P. Correlação canônica entre caracteres vegetativos e de Capacidade de brotação em mamoeiro. Encicl. Biosfera, 7:255-262, 2011. SHAPIRO, S.S. & WILK, M.B. An analysis of variance test for
normality: Complete samples. Biometrika, 52:591-611, 1965. SILVA, J.W.; SOARES, L.; FERREIRA, P.V.; SILVA, P.P. & SILVA, M.J.C. Correlações canônicas de características agroindustriais em cana-de-açúcar. Acta Sci. Agron., 29:345-349, 2007.
SIMÕES, F. Padrões de resposta do pessegueiro cv. Maciel a diferentes níveis de déficit hídrico. Pelotas, Universidade Federal de Pelotas, 2007. 93p. (Dissertação de Mestrado) TAVARES, M.; MELO, A.M.T. & SCIVITTARO, W.B. Efeitos diretos e indiretos e correlações canônicas para caracteres relacionados com a produção de pimentão. Bragantia, 58:41-47, 1999.
TIMM, L.C.; TAVARES, V.E.Q.; REISSER JUNIOR, C. & MORO, M. Manejo da irrigação na cultura do pessegueiro: Manual técnico. Pelotas, Universidade Federal de Pelotas, 2007. 110p.