Pesq. agropec. bras., Brasília, v.49, n.7, p.559-568, jul. 2014 DOI: 10.1590/S0100-204X2014000700009 Patricia Ferreira Ponciano Ferraz , Tadayuki Yanagi Junior , Yamid Fabián Hernández Julio ,
Jaqueline de Oliveira Castro(1), Richard Stephen Gates(2), Gregory Murad Reis(1) and Alessandro Torres Campos(1) (1)Universidade Federal de Lavras (Ufla), Departamento de Engenharia, Campus Universitário, Caixa Postal 3037, CEP 37200‑000 Lavras, MG, Brazil. E‑mail: [email protected], [email protected], [email protected], [email protected], [email protected], [email protected] (2)University of Illinois, Department of Agricultural and Biological Engineering, Urbana‑Champaign, UI, 61801, USA. E‑mail: [email protected]
Abstract – The objective of this work was to develop, validate, and compare 190 artificial intelligence‑based models for predicting the body mass of chicks from 2 to 21 days of age subjected to different duration and intensities of thermal challenge. The experiment was conducted inside four climate‑controlled wind tunnels using 210 chicks. A database containing 840 datasets (from 2 to 21‑day‑old chicks) – with the variables dry‑bulb air temperature, duration of thermal stress (days), chick age (days), and the daily body mass of chicks – was used for network training, validation, and tests of models based on artificial neural networks (ANNs) and neuro‑fuzzy networks (NFNs). The ANNs were most accurate in predicting the body mass of chicks from 2 to 21 days of age after they were subjected to the input variables, and they showed an R² of 0.9993 and a standard error of 4.62 g. The ANNs enable the simulation of different scenarios, which can assist in managerial decision‑making, and they can be embedded in the heating control systems.
Index terms: animal welfare, artificial neural network, broiler, modeling, neuro‑fuzzy network, thermal comfort.
Predição da massa corporal de pintinhos por meio de modelos
baseados em inteligência artificial
Resumo – O objetivo deste trabalho foi desenvolver, validar e comparar 190 modelos baseados em inteligência artificial, para predizer a massa corporal de pintinhos de 2 a 21 dias de vida, submetidos a diferentes períodos e intensidades de estresse térmico. O experimento foi realizado com 210 pintinhos, em quatro túneis de vento climatizados. Um banco de dados com 840 conjuntos de dados (de aves de 2 a 21 dias) – com as variáveis temperatura de bulbo seco do ar, duração do estresse térmico (dias), idade das aves (dias) e a massa corporal diária dos pintinhos – foi utilizado para treinamento de rede, validação e testes dos modelos baseados em redes neurais artificiais (RNA) e redes “neuro‑fuzzy” (RNF). As RNA mostraram‑se mais precisas para se predizer a
massa corporal de pintinhos de 2 a 21 dias de idade, submetidos às variáveis de entrada, e apresentaram R² de 0,9993 e erro‑padrão de 4,62 g. As RNA propiciam a simulação de diversos cenários, que podem auxiliar na tomada de decisões em relação ao manejo, e podem ser incorporadas nos sistemas de controle de aquecimento. Termos para indexação: bem estar animal, redes neurais artificiais, frango, modelagem, redes neurais difusas, conforto térmico.
Introduction
The poultry industry is facing several challenges to its sustained productivity and profitability. Among these challenges are environmental conditions, diseases, economic pressure, feed availability and other ones. Renaudeau et al. (2012) stated that climatic factors are among the main limiting factors for the growth of livestock production in developing countries. Although weather is tropical in the most part of Brazil, which favors the grown of chicks in the country, broiler houses are opened and slightly
thermally isolated.This makes it difficult to maintain the proper thermal environment within the facilities.
According to Mujahid (2010), newly hatched chicks are poikilothermic animals, which means that their thermoregulatory mechanisms are still poorly developed. Therefore, these birds are not especially resistant to environment temperatures outside their comfort range. During the first week of life, air dry‑bulb temperatures (tdb) ranging from 32 to 34°C are considered comfortable for chicks (Cony & Zocche, 2004). For the second week of life, the tdb should be between 30 and 32°C and, in the third week, should be maintained within the interval of 26 and 28°C (Cony & Zocche, 2004). Air velocity should be maintained within the interval of 0.15 and 0.3 m s‑1 until chick is fully feathered.
Predicting responses, such as daily body mass of broilers, allows producers to infer the thermal environment effects on this variable, which assists in decision‑making related to the thermal control of the production area. Among many predictive methods, artificial neural networks (ANNs) and neuro‑fuzzy networks (NFNs) models have been applied to various fields of study, and their use is generally linked to a search for patterns and techniques of temporal predictions for the decision‑making process, such as in poultry production, and animal environments, among others. ANNs are made of a simple interconnected group of cells known as artificial neurons, which are distributed in layers and used to calculate mathematical functions (Matin et al., 2012). These models are inspired by the structure of the brain, and aim to simulate human behaviors, such as learning, association, generalization, and abstraction, after being subjected to training (Ferreira et al., 2011). NFNs have emerged as a promising tool because they combine the benefits of learning and the computational power of ANNs with the capacity for representation and reasoning of fuzzy logic (Jang, 1993). A combination of the positive attributes from both techniques produces systems with an ability to learn and adapt to solving real‑world problems, which is ideal for applications such as identification, prediction, classification, and control (Rutkowski, 2008).
The objective of this work was to develop, validate, and compare 190 artificial intelligence‑based models for predicting the body mass of chicks from 2 to 21 days of age subjected to different duration and intensities of thermal challenge.
Materials and Methods
This experiment was conducted at the Laboratório de Construções Rurais e Ambiência, Departamento de Engenharia, Universidade Federal de Lavras (Ufla), which is located in Lavras, MG, Brazil. All procedures used in this experiment were approved by the Ethics Committee on Animal Use (Comissão de Ética no Uso de Animais ‑ Ceua) of the Ufla protocol number 001/12.
Four environmentally‑controlled wind tunnels with air recirculation and air partial renewal were used. Each wind tunnel was built with steel frames, steel sheets, and PVC pipes. The control, measurement and storage of the thermal environment variables in the wind tunnels were performed at one‑minute intervals using a control and measurement data logger CR1000 (Campbell Scientific, Logan, Utah, USA) with accuracy within 0.3°C, 0.5% and 0.1 m s‑1 for tdb, relative humidity (RH), and air velocity (V), respectively. Air heating and humidification within the tunnels were automatically done through the operation of electric heaters and humidifiers controlled by the data logger and the associated electromagnetic relays.
Inside each wind tunnel, broiler chicks were housed in a 0.40 x 0.60 x 0.50 m cage, which was divided into three equal compartments of 0.08 m² each. The cages were built with steel square tubes and wire netting with 1x1 cm mesh. In the first week, fifteen chicks were lodged in each cage, with five chicks per cage compartment, setting up a replicate for each treatment. One chick from each compartment, with a body mass having the greatest deviation from the median of the same replicate, was removed at the eighth day. Another chick from each replicate was removed again at the 15th day of life, leaving three animals per replicate. This method was used to maintain an appropriate animal density throughout the entire experimental period and replicate breeding conditions similar to commercial broiler breeding production (Cobb‑Vantress, 2008).
Pesq. agropec. bras., Brasília, v.49, n.7, p.559‑568, jul. 2014 DOI: 10.1590/S0100‑204X2014000700009
same feed was used for all the chicks throughout the experimental period, with no changes in its formulation, with a continuous light regime (Abreu et al., 2011).
Chicks were maintained at 33, 30, and 27°C during the first, second, and third week, respectively, as recommended by Menegali et al. (2013). Throughout the experimental period, the relative humidity (RH, %) inside the climate‑controlled wind tunnels was maintained at approximately 60%, as recommended by Lin et al. (2005). However, each group of fifteen chicks was subjected to both cold and heat stress‑inducing temperatures (27, 30, and 36°C), for periods ranging from one to four days, starting on the second day. After being subjected to stressful conditions, chicks were re‑subjected to their preferred temperature.
A database containing 840 datasets was collected during the experimental period and used to train, or adjust, validate, and test models based on ANNs and NFNs. Each dataset consisted of 3 levels of tdb (27, 30, and 36 °C), 4 D periods (1, 2, 3, and 4 days), 20 days of measurement (from 2 to 21‑day‑old chicks), and three replicates, totalizing 720 datasets. For the control treatment (tdb of 33°C), 20 days of measurement, and six replicates were used, adding 120 more datasets to the database. Two groups of fifteen chicks each were kept in a state of comfort throughout the experimental period. Each group of chicks was subjected to a treatment only once. Each morning, at 7:00 a.m., chick body mass was recorded individually.
For the ANNs and NFNs, the dry‑bulb air temperature (tdb, ºC), stress duration (D, days) and age of chicks (A) were used as input variables, and the body mass (BM, g) of Cobb chicks from 2 to 21 days old was used as output variables.
Each dataset was divided into three subgroups (training, validation, and tests), which were used to model the ANNs and NFNs. The training set is used to find the optimal weights which are associated to neurons. The validation set is used to achieve the optimal number of hidden units, or to determine a stopping point for the back propagation algorithm. The test set is used only to estimate the performance of the final model.
Out of all the data, 70% of the experimental dataset (588 independent data points) were used for training, and 15% of the data (126 data points each) were used for validation and tests, for a total of 840 data points from the experimental dataset. The data for the final model
validation was composed of 42 experimental datasets, which is equivalent to the mean BD corresponding to the 7th, 14th and 21st days of age for the chicks.
One hundred and fifty models based on ANNs and forty models based on NFNs were fitted to predict the BM of broilers from the 2nd to the 21st days of life, after chicks were subjected to different intensities and duration of thermal stress. Among the fitted models, one based on ANN, and other on NFN which exhibited the highest coefficient of determination (R²) and the lowest mean square error (MSE), were selected for comparison. The R² and MSE were used for their capacity to indicate the precision and measure the accuracy of a model, respectively (Tedeschi, 2006).
According to Ravi Kiran & Rajput (2011), layer formation is transmitted to the ANN model with the aid of a known set of data patterns that the network continuously “learns” by adapting its weights and deviations through an activation function called A. Thus, the network calculates the output in accordance with the following equation:
in which: A is the activation function;n is the number of neurons in the subsequent layer; wk is the weight of the respective connections; xk represents the input variables in a k neuron; and β is the bias for the neuron.
The activation or transfer functions are used to activate neurons from several layers. These functions can be sigmoid, tan‑sigmoid, pure linear, and of other types. Thus, the network is formed until the error is reduced enough to provide an accurate output for a given input dataset.
The model parameters included the number of hidden layers, the transfer functions in each hidden layer, the number of neurons on hidden layer (s), the learning rate, the moment rate and the neuron weights. Models based on ANNs employed tdb, D and A as the input variables, and the BM of broilers from 2 to 21 days old were used as output variables. To develop the models based on ANNs, the software Matlab (MathWorks, 2011) was used with the neural fitting tool (ntool).
coefficient and the lowest MSE. These models were subsequently validated with experimental data and, then, the best model was selected.
In the present study, the tested architectures that showed the best BM prediction performance were the multilayer networks (multilayer perceptron, mLP), which have been widely used for the development of an ANN (Savegnago et al., 2010; Kaewtapee et al., 2011).
Two “feedforward” layers and supervised training were employed with the Levenberg‑Marquardt backpropagation (LM) training algorithm, which is considered the fastest method for training such networks (Barbosa et al., 2005).
The root mean square (RMS) error was used for the performance function, whereas the activation function of the neuron output selected was the tangent sigmoid “tansig”.
Three variables, namely, tdb, D and A, were used in the input layer for the development of ANNs. The initial network parameters were configured as follows: hidden layer (1, default value), number of epochs (1,000), error tolerance (<0.099), learning rate (0.7), and moment rate (1x10‑3); these values – as well as the neuro weights – were automatically optimized during the network training by the computer application used for this process. The model was developed to allow the user to independently train and test the network.
A fuzzy system is an approach to computing based on many‑valued logic, with truth values between 0 and 1, rather than binary (two‑valued) logic that uses 0 to be false and 1 to be true. Thus, a fuzzy system is a generalized set that can assign various degrees of memberships over the interval [0, 1]. Therefore, the operation of this type of NFN is the same as that of ANN, except that when neural network “learns”, it modifies the sets and rules of the fuzzy inference system (membership functions) (Jang, 1993).
When using an NFN to solve a problem, the final solution for an NFN can be interpreted as a Takagi‑Sugeno type fuzzy inference system (FIS). In this system, the input and output structures are based on rules; however, the consequences of the rules are formed by crisp functions (non‑fuzzy). These systems use rules in the following expression by Takagi & Sugeno (1985):
If x is A (assumption), then y = f(x) (consequence), in which: x and y represent the input and output variables,
respectively; and A is the linguistic term associated with the fuzzy set that describes the variable.
The fuzzy logic toolbox Anfisedit of Matlab software (MathWorks, 2011) was used to develop these NFNs. The function of this toolbox is to construct an FIS by using input and output datasets (for training, validation, and testing). The specific parameters to the membership function (MF) employed two types of methods (the error backpropagation algorithm, either individually or in a hybrid form, combined with the least squares method). This setting allows fuzzy models to learn from the data during the modeling process.
Several neuro‑fuzzy models were developed and simulated using different settings. Different types of membership functions (Gaussian, triangular, and trapezoidal ones), epoch numbers and optimization methods (backpropagation or a hybrid) were tested, resulting in 40 models. The model with the lowest training error and no output internal errors in their fuzzy sets (with an amplitude outside the normal range or sets with values of zero (0) for the study variable BM) were selected. The hybrid training method (optimization), which was based on a 0.0 error tolerance and 3,000 epochs, was chosen because it best fits the dataset (Tahmasebi & Hezarkhani, 2010). The training was halted when both training and validation errors were stabilized.
The best neuro‑fuzzy tested model consisted of a collection of fuzzy propositions, as presented in an if‑and‑then form, which was elaborated based on the input variables. The knowledge base was composed of 27 rules, and each rule was assigned a weighting factor of 1.
The significance of the ANN and NFN models and the coefficients was tested using the F and t tests (p<0.05), respectively. The models that exhibited the best fit were selected (smallest sum of squared deviations). To analyze the models, the statistical software R (R Development Core Team, 2011) was used.
Results and Discussion
Pesq. agropec. bras., Brasília, v.49, n.7, p.559‑568, jul. 2014 DOI: 10.1590/S0100‑204X2014000700009
error, and 327.75 test error for BM. From that stage, increasing the number of neurons in the intermediate layer led to an increase in the difference between the prediction errors, indicating model overfitting. The achieved MSE values showed that ANN can adequately predict the output variable.
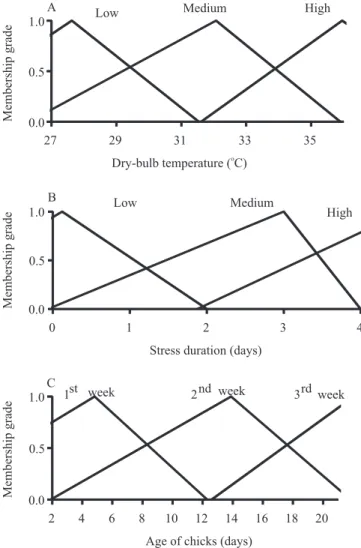
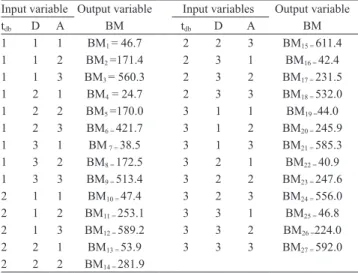
For the selected NFN final model, the input variables were represented by triangular membership functions (Figure 1) and the “constant” function was chosen for the output variable because they best fit the selected dataset. Thus, the best model for predicting the BM was composed of twenty‑seven rules that determined the input variable behavior (tdb, D, and A) (Table 1).
Based on Table 1, the system of fuzzy interference rules was created for the input variables and the values of the output variable BM (Table 2).
Despite the similarity of the two models, the one based on ANN always showed lower absolute deviations, standard deviations, percentage errors, standard error, and root mean square error (RMSE) than the best NFN‑based model (Table 3). Furthermore, ANN models had an intercept value closer to 0 and a slope closer to 1, which indicates a better accuracy in this model than in the NFN ones (Tedeschi, 2006). Thus, the ANN‑based model was superior to the NFN‑based one for predicting the BM of broilers from 2 to 21 days old subjected to thermal stress.
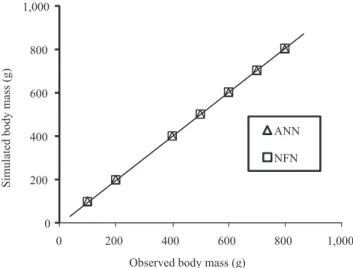
When comparing the BM values simulated with the experimental values by ANNs and NFNs, the proposed models were found to be precise in predicting the BM of broilers aged from 2 to 21 days (Figure 2). According to Savegnago et al. (2010), the coefficient of determination (R²) is an indicator of the goodness‑of‑fit between the model and the data. Comparing R² values of the two test models showed that the ANN‑based model outperformed the NFN‑based one (0.9993 and 0.9970, respectively). This result indicates that the BM values predicted by the models were similar to those experimentally observed and that the network learning faults during the training process were minimal (Ahmadi & Golian, 2010). Besides, when comparing the relationship between the observed BM with the BM simulated by the linear regression obtained from Figure 2 (Figure 3), it is clear that both models showed a similar performance.
The occurrence frequency of the absolute deviations of BM from 0 to 2 g was 42.0% for the ANN models and 31.0% for the NFN ones. ANN showed an error occurrence frequency of 2.0%, between 16 and 18 g, and for NFN it was 8.0% (Figure 4). Thus, it appears that the ANN had the lowest error occurrence frequency for this interval. With these data is possible affirm that
Figure 1. Membership curves of neuro‑fuzzy network
(NFN) input variables for stress temperature (tdb, °C) (A),
stress duration (D, days) (B), and age of chicks (A, days) (C) observed for chicks.
Table 1. Characteristics of the Sugeno‑type or neuro‑fuzzy
system (NFS) for body mass (BM).
Membership function tdb (°C) D (day) A (day)
for the smaller values of absolute deviations (smaller than 6 g), ANN had a better performance. However, for absolute deviations bigger than 6 g, NFN showed the best results.
In both tested models, the results confirm that ANNs could be the best methodology for BM prediction
in broilers from 2 to 21 days of life, after they are subjected to thermal stress. Ahmadi & Golian (2008) used ANN to predict the weekly egg production rate, and also found the lowest error values and highest R² than the prediction by regression models. Savegnago et al. (2010) also found the best results using ANN (multilayer perceptron type) to investigate the possibility of using mathematical models for egg production curves. This performance superiority over other types of modeling may occur because the relationships between the input and output variables, fault tolerance, and interpolation capacity are mapped in this type of modeling (Zhang et al., 2007). In addition, Bishop (1995) states that ANNs have the ability to learn the behavioral patterns of a dataset during the
Table 2. System of fuzzy interference rules for the input
variables dry‑bulb temperature (tdb), stress duration (D), and
age of chicks (A), and the values of the output variable body mass (BM) for chicks.
Input variable Output variable Input variables Output variable
tdb D A BM tdb D A BM
1 1 1 BM1 = 46.7 2 2 3 BM15 = 611.4
1 1 2 BM2 =171.4 2 3 1 BM16 = 42.4
1 1 3 BM3 = 560.3 2 3 2 BM17 = 231.5
1 2 1 BM4 = 24.7 2 3 3 BM18 = 532.0
1 2 2 BM5 =170.0 3 1 1 BM19 =44.0
1 2 3 BM6 = 421.7 3 1 2 BM20 = 245.9
1 3 1 BM 7 = 38.5 3 1 3 BM21 = 585.3
1 3 2 BM8 = 172.5 3 2 1 BM22 = 40.9
1 3 3 BM9 = 513.4 3 2 2 BM23 = 247.6
2 1 1 BM10 = 47.4 3 2 3 BM24 = 556.0
2 1 2 BM11 = 253.1 3 3 1 BM25 = 46.8
2 1 3 BM12 = 589.2 3 3 2 BM26 =224.0
2 2 1 BM13 = 53.9 3 3 3 BM27 = 592.0
2 2 2 BM14 = 281.9
Table 3. Statistical results of the fitted models artificial
neural network (ANN) and neuro‑fuzzy network (NFN) for output variable body mass (g) of chicks.
Statistical indices Tested models(1)
ANN NFN
Absolute deviations
Minimum 0.2 0.0
Mean 3.3 6.6
Median 2.7 4.5
Maximum 16.1 29.6
Standard deviations
Minimum 0.1 0.0
Mean 2.3 4.6
Median 1.9 3.2
Maximum 11.4 20.9
Percentage error
Minimum 0.1 0.0
Mean 1.2 2.1
Median 0.9 1.8
Maximum 4.4 5.8
R2 0.9993 0.9970
Standard error 4.62 9.80
RMSE 1.63 2.65
Regression coefficients (slopes)(1) 1.0033±0.0041 1.0118±0.0087
Intercepts ‑0.7067±1.4862 ‑4.4432±3.1822
(1)The slope close to 1 and intercept simultaneously close to 0 indicate a
high accuracy. RMSE, root mean square error.
Figure 2. Functional relationship between chick body mass
Pesq. agropec. bras., Brasília, v.49, n.7, p.559‑568, jul. 2014 DOI: 10.1590/S0100‑204X2014000700009
training process, providing consistent predictions, or the possibility of test generalizations, as confirmed in the present study.
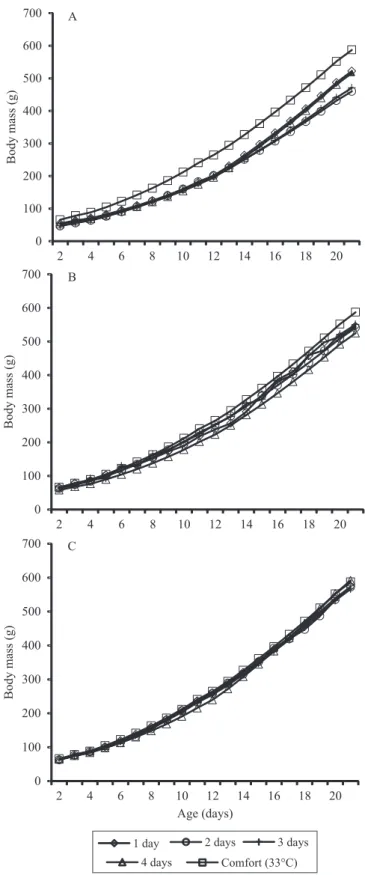
The plots of BM were subsequently generated for the first three weeks of life as a function of A (days) and D (days) for tdb of 27, 30, and 36°C, based on the models of ANN a NFN (Figures 5 and 6). In both tested models, chicks subjected to 27°C had lower BM values than those subjected to 30°C, and both groups showed a BM reduction in relation to the comfortable temperature (33oC). In addition, irrespectively of the D period for the temperatures of 27 or 30°C, when these
Figure 3. Values of observed and predicted chick body
mass by coefficients of regression. ANN, artificial neural networks; NFN, neuro‑fuzzy networks.
Figure 4. Frequency of absolute deviations between the body
mass (BM) data for chicks from 2 to 21 days, as simulated by models based on artificial neural networks (ANN) (A) and neuro‑fuzzy networks (NFN) (B), and the validation dataset.
Figure 5. Plot of predicted body mass by artificial neural
network (ANN), according to the following conditions of: dry‑bulb temperature (tdb, °C) to which the chicks were
chicks reached the 21st day of life, they still showed smaller BM values (Figures 5 and 6); this means that even for a short period of thermal challenge and after being subjected to thermoneutral temperature again, the chicks were not able to regain their BM until their 21st day of life. However, it should be noted that despite the small loss, when considering a house of chickens for commercial production, this difference in BM can result in significant animal losses, and can even cause financial loss to the producer. Van den Brand et al. (2010) studied feed different concentrations for newly‑hatched poultry, and noted that the feed intake, especially for feed with a higher energy content, is essential for chicks at this age, in order to develop their digestive systems and thus maintain their homeothermy. However, Mujahid & Furuse (2009) studied the physiological responses of chicks exposed to very low temperatures (20°C), and confirmed that newborn chicks are unable to maintain their thermostability under those conditions, even if feed is available. Furthermore, the authors observed that these chicks did not engage in compensatory feed intake to try to maintain heat production. Therefore, it can be inferred that if chicks are under cold stress conditions (at greater or lesser intensity), the feed intake is affected, consequently affecting their digestive and body development in addition to their homeothermy, thus influencing weight and body mass gain.
For 36°C thermal challenge, the loss related to BM was almost negligible or even nonexistent, which shows that chicks can adapt well to higher temperatures in this age group (Figures 5 and 6). This information is in agreement with Abreu et al. (2012), who stated that young chicks show greater resistance to high temperatures, and have a greater susceptibility to cold stress conditions. Thus, chicks at 36°C could perform better than those under 27 and 30°C conditions.
Conclusions
1. The artificial neural networks (ANN) and neuro‑fuzzy networks (NFN) are very similar to predict the body mass of broilers from 2 to 21 days of age subjected to different dry‑bulb temperature.
2. The ANN‑based model produces more accurate predictions than the NFN‑based one.
3. The ANN model can be embedded in a microcontroller‑based system to control aviary heating systems.
Figure 6. Plot of predicted body mass by neuro‑fuzzy
network (NFN), according to the conditions of: dry‑bulb temperature (tdb, °C) to which chicks were subjected at 27°C
Pesq. agropec. bras., Brasília, v.49, n.7, p.559‑568, jul. 2014 DOI: 10.1590/S0100‑204X2014000700009
Acknowledgements
To Conselho Nacional de Desenvolvimento Científico e Tecnológico (CNPq), to Fundação de Amparo à Pesquisa do Estado de Minas Gerais (Fapemig), and to Coordenação de Aperfeiçoamento de Pessoal de Nível Superior (Capes), for financial support.
References
ABREU, P.G. de; ABREU, V.M.N.; COLDEBELLA, A.; HASSEMER, M.J.; TOMAZELLI, I.L. Medidas morfológicas em função do peso e da idade da ave, por meio de imagens. Revista Brasileira de Engenharia Agrícola e Ambiental, v.16, p.795‑801, 2012. DOI: 10.1590/S1415‑43662012000700014.
ABREU, V.M.N.; ABREU, P.G. de; COLDEBELLA, A.; JAENISCH, F.R.F.; SANTOS FILHO, J.I. dos; PAIVA, D.P. de. Curtain color and lighting program in broiler production: I ‑ general performance. Revista Brasileira de Zootecnia, v.40, p.2026‑2034, 2011. DOI: 10.1590/S1516‑35982011000900027.
AHMADI, H.; GOLIAN, A. Neural network model of egg production curve. Journal of Animal and Veterinary Advances,
v.7, p.1168‑1170, 2008.
AHMADI, H.; GOLIAN, A. The integration of broiler chicken threonine responses data into neural network models. Poultry Science, v.89, p.2535‑2541, 2010. DOI: 10.3382/ps.2010‑00884. BARBOSA, A.H.; FREITAS M.S. da R.; NEVES, F. de A. das. Confiabilidade estrutural utilizando o método de Monte Carlo e redes neurais. REM: Revista Escola de Minas, v.58, p.247‑255, 2005. DOI: 10.1590/S0370‑44672005000300011.
BISHOP, C.M. Neural networks for pattern recognition. Oxford: Clarendon Press, 1995. 482p.
CHOWDHURY, V.S.; TOMONAGA, S.; NISHIMURA, S.; TABATA, S.; FURUSE, M. Physiological and behavioral responses of young chicks to high ambient temperature. Journal ofPoultry Science, v.49, p.212‑218, 2012. DOI: 10.2141/jpsa.011071. COBB‑VANTRESS. COBBbroiler management guide.Siloam Springs: Cobb‑Vantress, 2008. 68p.
CONY, A.V.; ZOCCHE, A.T. Manejo de frangos de corte. In: MENDES, A.; NÄÄS, I. de A.; MACARI, M. (Ed.). Produção de frangos de corte. Campinas: Facta, 2004. p.118‑136.
FERREIRA, R.P.; SASSI, R.J.; AFFONSO, C.O. Aplicação de uma rede neuro Fuzzy para a previsão do comportamento do tráfego veicular urbano na região metropolitana da cidade de São Paulo. Exacta, v.9, p.363‑375, 2011.
JANG, J.‑S.R. ANFIS: adaptive‑network‑based fuzzy inference system. IEEE Transactions Systems, Man, and Cybernetics,
v.23, p.665‑685, 1993. DOI: 10.1109/21.256541.
KAEWTAPEE, C.; KHETCHATURAT, C.; BUNCHASAK, C. Comparison of growth models between artificial neural networks and nonlinear regression analysis in Cherry Valley ducks. Journal
of Applied Poultry Research, v.20, p.421‑428, 2011. DOI: 10.3382/japr.2010‑00223.
LIN, H.; ZHANG, H.F.; JIAO, H.C.; ZHAO, T.; SUI, S.J.; GU, X.H.; ZHANG, Z.Y.; BUYSE, J.; DECUYPERE, E. Thermoregulation responses of broiler chickens to humidity at different ambient temperatures. I. One week of age. Poultry Science, v.84, p.1166‑1172, 2005. DOI: 10.1093/ps/84.8.1173. MATHWORKS. Fuzzy logic toolbox: user’s guide. Version 2011. Available at: <http://www.mathworks.com/help/toolbox/ fuzzy/49243.html>. Accessed on: Oct. 2011.
MATIN, H.; SAKI, A.; ALIARABI, H.; SHADMANI, M.; ZARE ABYANE, H. Intestinal broiler microflora estimation by artificial neural network. Neural Computing and Applications, v.21, p.1043‑1047, 2012. DOI: 10.1007/s00521‑011‑0553‑2.
MENEGALI, I.; TINÔCO, I.F.F.; CARVALHO, C. da C.S.; SOUZA C. de F.; MARTINS J.H. Comportamento de variáveis climáticas em sistemas de ventilação mínima para produção de pintos de corte. Revista Brasileira de Engenharia Agrícola e Ambiental, v.17, p.106‑113, 2013. DOI: 10.1590/S1415‑43662013000100015. MUJAHID, A. Acute cold‑induced thermogenesis in neonatal chicks (Gallus gallus). Comparative Biochemistry and Physiology – Part A: Molecular and Integrative Physiology, v.156, p.34‑41, 2010. DOI: 10.1016/j.cbpa.2009.12.004.
MUJAHID, A.; FURUSE, M. Behavioral responses of neonatal chicks exposed to low environmental temperature. Poultry Science, v.88, p.917‑922, 2009. DOI: 10.3382/ps.2008‑00472. R DEVELOPMENT CORE TEAM. R: a language and environment for statistical computing. Vienna: R Foundation for Statistical Computing, 2012.
RAVI KIRAN, T.; RAIPUT, S.P.S. An effectiveness model for an indirect evaporative cooling (IEC) system: comparison of artificial neural networks (ANN), adaptive neuro‑fuzzy inference system (ANFIS) and fuzzy inference system (FIS) approach. Applied Soft Computing, v.11, p.3525‑3533, 2011. DOI: 10.1016/j. asoc.2011.01.025.
RENAUDEAU, D.; COLLIN A.; YAHAV, S.; BASILIO, V. de; GOURDINE, J.L.; COLLIER, R.J. Adaptation to hot climate and strategies to alleviate heat stress in livestock production. Animal,
v.6, p.707‑728, 2012. DOI: 10.1017/S1751731111002448. RUTKOWSKI, L. Computational intelligence: methods and techniques. Berlin: Springer, 2008. DOI: 10.1007/978‑3‑540‑76288‑1. SAVEGNAGO, P.R.; NUNES, B.N.; CAETANO, S.L.; FERRAUDO, A.S.; SCHMIDT, G.S.; LEDUR, M.C.; MUNARI, D.P. Comparison of logistic and neural network models to fit to the egg production curve of White Leghorn hens. Poultry Science,
v.90, p.705‑711, 2010. DOI: 10.3382/ps.2010‑00723.
TEDESCHI, L.O. Assessment of the adequacy of mathematical models. Agricultural Systems, v.89, p.225‑247, 2006. DOI: 10.1016/j.agsy.2005.11.004.
VAN DEN BRAND, H.; MOLENAAR, R.; VAN DER STAR, I.; MEIJERHOF, R. Early feeding affects resistance against cold exposure in young broiler chickens. Poultry Science, v.89, p.716‑720, 2010. DOI: 10.3382/ps.2009‑00432.
ZHANG, Z.; WANG Y.; FAN, G.; HARRINGTON, P.B. A comparative study of multilayer perceptron neural networks for the identification of rhubarb samples. Phytochemical Analysis,
v.18, p.109‑114, 2007. DOI: 10.1002/pca.957.
ZHANG, Z.W.; LI, Z.H.; LI, J.L.; LI, S.; XU, S.W.; WANG, X.L. Effects of cold stress on nitric oxide in duodenum of chicks. Poultry Science, v.90, p.1555‑1561, 2011. DOI: 10.3382/ps.2010‑01333.