ISSN 0101-2061 Food Science and Technology
DI:
D http://dx.doi.org/10.1590/1678-457X.09416
1 Introduction
Chitosan is a linear polysaccharide of β-(1-4)-D-glucosamine (deacetylated unit) and n-acetyl-D-β-(1-4)-D-glucosamine (acetylated unit) derived from chitin, the second most abundant polysaccharide in nature after cellulose. Chitin is the main component of the exoskeleton of crustaceans, mollusks, and arthropods, as well as of the cell walls in some fungi (Alvarado et al., 2015). Chitosan films are an excellent choice for food packaging, due to its excellent mechanical properties and oxygen barrier (Aguirre-Loredo et al., 2014). However, the properties of the film can be significantly modified by the moisture content of the material. Water is an important constituent of foods as it affects the quality and stability as well as rheological properties. Also, water promotes the mobility of the hydrophilic polymer chains (Pittia & Sacchetti, 2008) due to a plasticizing effect. In general, increasing the moisture content decreases the glass transition temperature (Tg) and modifies the performance and quality of biodegradable packaging materials. Plasticization by water molecules is an important phenomenon when hydrophilic materials are intended for food packaging. The water activity (aw) is a measure of the water state in foods; this concept is commonly related to safety and quality (Barbosa-Cánovas et al., 2008). Water molecules have an important effect on the molecular structure of the polymer and thus in the properties of the films, as a result of hydration, plasticization or partial solubilization of the
material. As a result of these processes, the mechanical and barrier properties of the films are modified considerably, altering the quality of the stored products (Alvarado et al., 2015; Cunha et al., 2014). Water sorption isotherms represent the relationship of the equilibrium moisture content of a food product and the relative humidity at a particular temperature (Muzaffar & Kumar, 2016). The water activity changes with the temperature and usually the food is exposed to a wide range of temperatures during transporting and storage. Temperature affects the mobility of the molecules of water and the dynamic equilibrium between vapor and adsorbents phases (Nordin Ibrahim et al., 2013). In food systems, at constant aw, an increase in temperature results in a decrease in moisture content. In moisture sorption isotherms the experimental data can be fitted by several mathematical models, empirical or theoretical; however, not all models are applicable to the full scale of water activity that ranges from 0 to 1. Most of the mathematical models do not include the temperature as a parameter into the equation. Usually, to consider this effect, each model is fitted to each temperature at the time, obtaining different values for each parameter of the model as a function of temperature. There are some modified models where the temperature is included as a variable. These models are not always fully effective fitting the experimental data in the whole range of aw. Therefore, the objective of the present study
Modelling the effect of temperature on the water sorption isotherms of chitosan films
Rocio Yaneli AGUIRRE-LDREDD1, Adriana Inés RDDRIGUEZ-HERNANDEZ2, Gonzalo VELAZQUEZ1*
Received 13 Apr., 2016 Accepted 27 June, 2016
1 Centro de Investigación en Ciencia Aplicada y Tecnología Avanzada Unidad Querétaro – CICATA, Instituto Politécnico Nacional – IPN, Querétaro, Qro., México 2 Instituto de Ciencias Agropecuarias, Universidad Autónoma del Estado de Hidalgo – UAEH, Tulancingo, Hidalgo, México
*Corresponding author: [email protected] Abstract
The interaction of the water molecules from the environment with foods and other materials can be evaluated using sorption isotherms. Films and biodegradable films are susceptible to changes in their functional characteristics due to adsorbed water. The amount of moisture that biodegradable films can adsorb depends on the temperature, relative humidity of the storage area and chemical composition. Several mathematical models can be used to describe the behavior of sorption isotherms in biodegradable films and some of them have been modified to include the temperature parameter into the equation. In this research, the original and modified BET, GAB, Halsey, Henderson and Dswin models were assessed to determine their suitability describing the behavior of moisture adsorption isotherms of chitosan films at 15, 20, 25 and 30 °C. The modified models of GAB, Dswin and Halsey gave the best fit to the experimental sorption data of the chitosan films, with R2 values higher than 0.97 demonstrating that those models describe better the sorption isotherms at the temperatures studied.
Keywords: chitosan film; moisture adsorption isotherm; GAB model.
was to compare several mathematical models to determine their suitability to describe the effect of temperature on the sorption isotherms of biodegradable chitosan-based films at temperatures of 15, 20, 25, and 30 °C.
2 Materials and methods 2.1 Materials
Chitosan (Sigma-Aldrich, United States, with a degree of acetylation > 75%) from shrimp shell and glacial acetic acid (Fermont, Mexico) were employed to obtain biodegradable films. Reagent grade salts (Jalmek Cientifica S.A. de C.V., Mexico) were used to prepare supersaturated aqueous saline solutions to obtain a wide range of equilibrium relative humidity (RHeq) environments, as described in section 2.3.
2.2 Film preparation
Film-forming solution was prepared by dissolving 1 g of chitosan in 100 mL of 1% acetic acid (v/v). The filmogenic solution was centrifuged at 3000 rpm for 20 min (Eppendorf, 580HR model) to remove insoluble particles and air bubbles. The films were obtained by the casting method using 150 mm × 150 mm glass molds. Solutions were dried in a dehydrator with forced convection (Excalibur Products, United States) at 30 ± 1 °C for 3 h. After drying, films were stored at room temperature for 7 days in a desiccator containing silica gel. Preliminary tests showed that 5 days are enough for the films to reach equilibrium.
2.3 Moisture adsorption isotherms
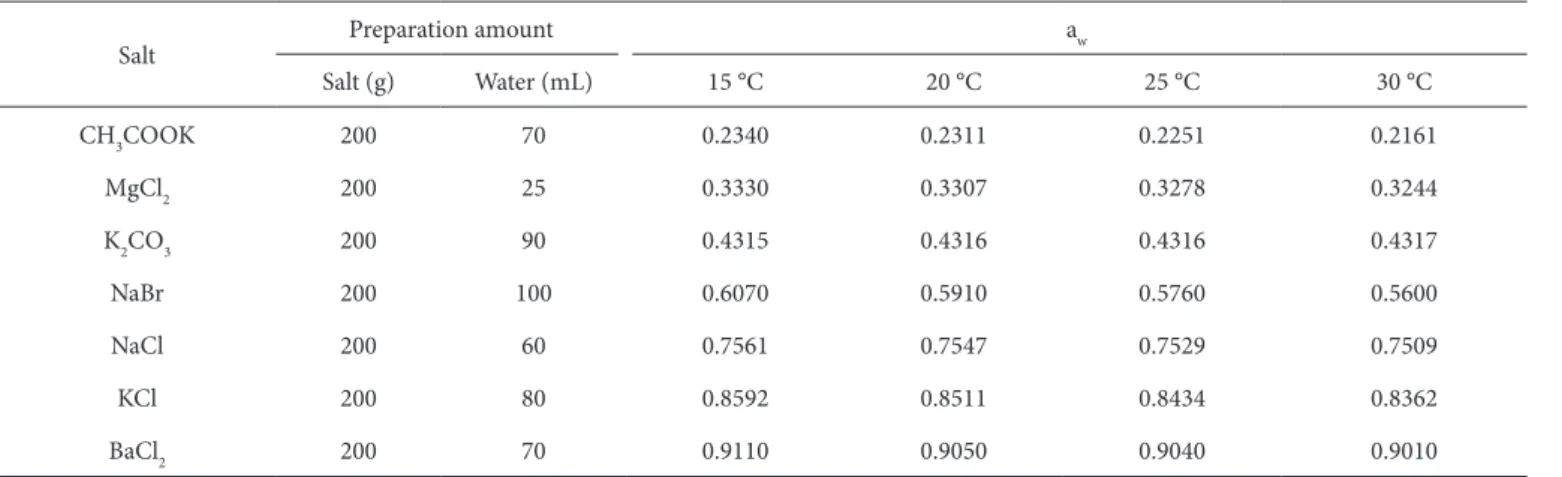
To evaluate the interaction of water with chitosan films, the moisture adsorption isotherms were obtained following the static method of microclimates (Wolf et al., 1985). Dne-L acrylic containers with an airtight lid were used to obtain microclimates in the range from 22 to 90% of equilibrium relative humidity (RHeq) at 15, 20, 25 and 30 °C using supersaturated saline solutions of CH3CDDK, MgCl2, K2CD3, NaBr, NaCl,
KCl and BaCl2. The amount of salt and water for preparing supersaturated saline solutions and aw values (aw = RHeq/100) for each temperature are listed in Table 1.
Rectangular samples of chitosan films were placed by triplicate on brackets over saline solutions, ensuring that the absorption of water vapor molecules takes place on both sides of the film. Containers were placed in a chamber with controlled temperature for 7 days. After equilibrium in each microclimate, the samples were weighed using an analytical balance (0.0001 g sensitivity) and then the dry weight was determined using an oven at 110 °C for 20 h.
2.4 Mathematical moisture sorption models
Modified equations of the models were used to take into account the effect of the temperature on the adsorption isotherms. A comparison of the fitting was carried out for both the original (without including the temperature effect) and the modified models.
In this study, 10 mathematical models were used to describe the adsorption isotherms of chitosan films at different temperatures (Aviara et al., 2004; Ayala Aponte et al., 2011; Furmaniak et al., 2007; Gálvez et al., 2006; Timmermann et al., 2001). From these 10 equations (Equations 1-10; Table 2), 5 are the original models and 5 are modified versions of each model where the temperature is taken into account. The parameters were estimated by nonlinear regression using the least squares method to minimize the sum of squares of the residuals between calculated and experimental values.
2.5 Statistical analysis
The best model to predict the equilibrium moisture content was selected considering the value of the coefficient of determination (R2) and the value of %E (mean percentage error). To assess the fitting of each model, the values of the R2 and %E were calculated
Table 1. aw values of several salts as a function of temperature.
Salt Preparation amount aw
Salt (g) Water (mL) 15 °C 20 °C 25 °C 30 °C
CH3CDDK 200 70 0.2340 0.2311 0.2251 0.2161
MgCl2 200 25 0.3330 0.3307 0.3278 0.3244
K2CD3 200 90 0.4315 0.4316 0.4316 0.4317
NaBr 200 100 0.6070 0.5910 0.5760 0.5600
NaCl 200 60 0.7561 0.7547 0.7529 0.7509
KCl 200 80 0.8592 0.8511 0.8434 0.8362
BaCl2 200 70 0.9110 0.9050 0.9040 0.9010
using the software DriginPro v. 8.5.1. (DriginLab Corporation), and the %E was calculated using Equation 11.
100
% e p *
e x x E x n − = ∑ (11)
Taking into account the approximation by non-linear regression, a value of R2 ≥ 0.98 was considered a good fitting. In the case of %E, values lower than 5 indicate a good fit; values between 5 and 10, indicate a reasonable adjustment and values higher than 10 indicate a poor fit (Muzaffar & Kumar, 2016; Peng et al., 2007; Slavutsky & Bertuzzi, 2012).
3 Results and discussion 3.1 Moisture adsorption isotherms
Moisture adsorption isotherms of chitosan films obtained as a function of temperature are shown in Figure 1, the curves are considered type III isotherms according to the classification of Brunauer (Lavoyer et al., 2013). The moisture adsorbed by chitosan films increased when subjected to high levels of aw and decreased with the increase of temperature at a given aw value. A similar behavior is observed in all the curves obtained as the slope increases rapidly at aw values higher than 0.5. According to these results, chitosan films can adsorb up to 40% of moisture at 30 °C and as the temperature decreases, the capability to adsorb water increases, reaching up to 70% of moisture at 15 °C when the material is exposed to an environment of 90% RHeq. This behavior is explained taking into account the relationship between the kinetic energy of the molecules and the binding sites in the adsorbing material. Due to a higher state of excitation of molecules, the distance between a water molecule and the
polymer increases resulting in a decrease of the attractive forces, becoming less stable and spreading of the binding sites. This might result in a reduction in the total number of active sites in which the water molecules interact as a consequence of the physical changes in the polymeric material. Therefore, an increase in temperature results in a reduction in the amount of moisture adsorbed at a given water activity value (Li, 2012; Mrad et al., 2013; Muzaffar & Kumar, 2016; Souza et al., 2015). Water molecules also have the capability to increase the free volume in the polymer matrix, thus increasing the mobility of the polymer chains and the permeability of the material (Schmid et al., 2015).
Moisture adsorption isotherms can be divided into regions that describe the behavior of the material and can help to understand the changes taking place in the structural matrix. These regions are not static and they change according to the material and the experimental conditions. The region corresponding to aw < 0.2 describes the adsorption of water in the monolayer region; the region corresponding to additional layers of water adsorption is allocated between aw 0.2-0.7; the region aw > 0.7, corresponds to the condensation of water in the pores of the material followed by a dissolution of the material (Ghayal et al., 2013; Zomorodian et al., 2011). At lower aw values, the slope of the curve of the adsorption isotherms of chitosan films was smaller and increased at aw values > 0.75. Similar behavior has been reported for films made from chitosan-polyvinyl alcohol, chitosan-FeCl3 and starch-gelatin (Al-Hassan & Norziah, 2012; Hirase et al., 2010; Sébastien et al., 2006; Srinivasa et al., 2003).
According to the literature, the effect of adsorbed water on hydrophilic materials can be divided into three regions of hydration. In the case of chitosan, when it is hydrated at low values of RHeq (< 50%) the rate of relaxation of the solvent
Table 2. Isotherm models used for experimental data fitting (Aviara et al., 2004; Ayala Aponte et al., 2011; Furmaniak et al., 2007; Gálvez et al., 2006; Timmermann et al., 2001).
Model Driginal equation Modified equation Parameters
BET (1 )
(
1m (w 1 ))
w w
x c a X
a c a
=
− + −
(1) ( ( )( ) )
1 1
w
w w w
A BT C a
X
a a C a
+ =
− − +
(2)
xm: monolayer water content
c: energy difference between the upper layers and the monolayer
A, B y C: empirical parameters
GAB ( )( )
1 1
m w
w w w
x c k a X
k a k a c k a
=
− − + (3) (1 ) 1
m w
w w w
c
x k a
T X
c
ka ka ka
T + = − − +
. (4)
xm: monolayer water content
c: energy difference between the upper layers and the monolayer
k: degree of freedom of water molecules
Henderson ( )
1 log 1 0.01 10 B w A a
X= − −
(5)
( ) ( ) 1 ln 1 * C w a X
A B T
−
= − +
(6) A, B y C: empirical parameters
Halsey
( )
1
ln 1 /
B w A X a =
(7)
( ) 1
exp C w A BT X ln a + = −
(8) A, B y C: empirical parameters
Dswin 1 B w w a X A a = −
(9) ( )
1 1 C w w a
X A BT
a = + −
(10) A, B y C: empirical parameters
increases slightly. Intermediate RHeq values (from 50 to 75%) increase the mobility of the matrix of chitosan. At higher RHeq values (80%) there is a significant increase in the molecular mobility of the matrix. It has been reported that the chitosan has 3 adsorption sites: the hydroxypropyl group, the amino group, and the end of the polymer chain consisting of a hydroxyl or aldehyde group (Cervera et al., 2004; Gocho et al., 2000). Based on the degree of interaction between water and polymer, three states of water adsorbed in the hydrophilic materials have been proposed: (i) non-freezable or composition water, which does not crystallize, even at low temperatures, (ii) linked or freezable water, which crystallizes below 0 °C, and (iii) free water, which can be crystallized at 0 °C (Lin et al., 2007). After the adsorption of water, chitosan may swell, but will stop to some extent due to the cross-linking of the crystalline zones (Gocho et al., 2000).
3.2 Modeling of experimental data
There are several models for fitting the experimental data of moisture adsorption isotherms. Some equations include the effect of the temperature as a parameter. In most of those there is no scientific basis to justify the inclusion of the temperature effect; usually, its position is defined by trial and error when fitting data (Jain et al., 2010). In this work, 10 mathematical models used to describe sorption isotherms were tested to fit the experimental data of the adsorption isotherms of chitosan films. The values obtained for the parameters of each model are shown in Table 3.
BET model theory proposes a multilayer adsorption, a monolayer strongly attached to the chains of the material, and the subsequent layers thermodynamically tend to behave in the same way, however, different from the monolayer and with similar characteristics of liquid water (Hartley et al., 1992). The applicability of the BET model is limited to the low range of aw (0-0.75). The parameters are the moisture content in the monolayer (xm) and the energy involved in the process of water adsorption (c). xm is the amount of water which is adsorbed strongly at specific binding sites on the surface of the material and can also be set as a measure of the availability of active sites of a material for the adsorption of water molecules (Figura & Teixeira, 2007; Lavoyer et al., 2013; Quirijns et al., 2005). In the chitosan-based films, BET model fitted appropriately the range from 0 to 0.75 aw. The xm values decreased when the experimental temperature increased, changing from 10.99 to 6.75 g water/100 g dry matter at 15 and 30 °C, respectively. The original and modified models of BET gave a good fit to the experimental data in the range from 0 to 0.75 aw. In moisture adsorption isotherms of foods such as vegetables, BET model fit the experimental data in a range from 0.1 to 0.5 aw (Kaymak-Ertekin & Sultanoğlu, 2001). The BET model has a little dependence on temperature, and a greater dependence is observed in the initial ranges of relative humidity (Furmaniak et al., 2007).
Anderson (1946) modified the equation of BET assuming that the adsorption heat from the second to ninth layer is less than the heat of liquefaction. The equation of Anderson was later derived kinetically and statistically by Boer (1953) and Guggenheim (1966), respectively. Both the BET and the GAB model
are based on the same principle of monolayer coverage (xm) and the parameter c; however, GAB model introduced an additional constant (k) which gives the higher versatility. The inclusion of the parameter k assumes that molecules which are in multilayer have interaction with the sorbent and this interaction changes in energy levels somewhere between the monolayer and the free water molecules, the value of the constant k is always less than 1 (Furmaniak et al., 2007; Barbosa-Cánovas et al., 2008; Timmermann et al., 2001) as showed in this study. The moisture content in the monolayer represents the amount of water required to form a monolayer on the surface (Arslan & Togˇrul, 2005). In chitosan films, increasing the temperature results in a significant decrease in the xm values according to the data obtained with the GAB and BET models (Figure 2).
The constant c from the BET model is logarithmically related to the difference between the chemical potential of the sorbate molecules in pure liquid and the first layer of sorption. Dn the other hand, the c constant of GAB model is related to the difference between the quantities in the upper layers and the monolayer, while the constant k is related to the difference of the sorbate pure liquid state and the upper layers or multilayered, and the product of both (cGAB + k = cBET) represents the equivalent of the parameter c of BET (Timmermann et al., 2001). It has been observed that the values of xm and c in both models can show a characteristic behavior, where xm values calculated by the model of BET are usually smaller than the GAB. In this work, the
xm values calculated by the BET model were lower than the GAB model, for all temperatures (Table 3). Also, the constant energy c Table 3. Sorption isotherm model parameters and coefficient of regression R2 values for chitosan films.
Model Temp (°C) Parameters
xm c k A B C
T
aw Range 0-0.75 15 10.99 15,985.16 - - -
-R2= 0.9244 20 10.29 1,757.52 - - -
-%E= 20.1029 25 8.03 13,361.27 - - -
-30 6.75 6,281.44 - - -
-Modified BET
aw Range 0-0.75 15 9.59 4,490.89 - - -
-R2= 0.9215 20 8.35 3,181.96 - - -
-%E= 13.9420 25 6.38 2,637.54 - - -
-30 5.74 1,787.79 - - -
-GAB
aw Range 0-0.9 15 16.74 9.15 0.84 - -
-R2= 0.9714 20 15.27 9.37 0.82 - -
-%E= 7.9196 25 10.15 3,887.34 0.85 - -
-30 7.81 482.41 0.89 - -
-Modified GAB
aw Range 0-0.9 15 16.27 10.94 0.85 - -
-R2= 0.9847 20 16.79 7.84 0.80 - -
-%E= 8.3945 25 11.22 18.40 0.84 - -
-30 8.31 15.33 0.90 - -
-Henderson
aw Range 0-0.9 15 - - - 1.28 -4.90
-R2= 0.9666 20 - - - 1.34 -5.05
-%E= 11.8945 25 - - - 1.47 -5.38
-30 - - - 1.21 -4.38
-Modified Henderson
aw Range 0-0.9 15-30 - - - 0.00055 1.15 1.31
R2= 0.9729
%E= 11.0574
Halsey
aw Range 0-0.9 15 - - - 321.11 1.89
-R2= 0.9807 20 - - - 283.75 1.92
-%E= 12.4197 25 - - - 255.68 2.03
-30 - - - 77.50 1.74
-Modified Halsey
aw Range 0-0.9 15-30 - - - 6.79 -0.06 1.90
R2= 0.9703
%E= 9.9392
Dswin
aw Range 0-0.9 15 - - - 25.96 0.44
-R2= 0.9813 20 - - - 23.27 0.43
-%E= 8.6661 25 - - - 18.77 0.40
-30 - - - 15.17 0.47
-Modified Dswin
aw Range 0-0.9 15-30 - - - 33.38 2.13 -0.61
R2= 0.9781
of BET is usually higher than the values obtained with the GAB model (Timmermann et al., 2001). The modified GAB model gave a better fit than the original model for the experimental data obtained from the moisture adsorption isotherms in the range from 0.10 to 0.90 aw (Table 3). As the parameters of the GAB equation are based on the physical phenomena involved in water adsorption by hydrophilic materials, it is considered the most suitable model to describe experimental data (Bratasz et al., 2012; Figura & Teixeira, 2007; Furmaniak et al., 2007; Lavoyer et al., 2013; Medeiros et al., 2006; Souza et al., 2015; Timmermann et al., 2001; Zhang & Han, 2008).
The original and modified Dswin models gave an excellent fit to the experimental data. A %E value of 8.66 was obtained from the modified equation. Similar values have been reported for adsorption isotherms of soybeans, where the modified model presented the most suitable fitting (Aviara et al., 2004). This model has been found to be convenient to describe moisture adsorption isotherms of biodegradable films (Srinivasa et al., 2007), as well as products with high contents of protein and starch (Chen, 2002). In dried fruits, the modified model of Dswin gave a better fit than the modified model of Henderson at temperatures from 30 to 50 °C (Jain et al., 2010).
The original model of Henderson was effective in modeling experimental data of adsorption at temperatures of 10 to 30 °C. Similar behavior is reported for dried papaya adsorption isotherms (Jain et al., 2010). The modified model of Henderson gave the best fit, with an R2 of 0.9729 and a mean percentage error of 11.06.
Halsey equation is a multimolecular sorption model where the binding energy of the sorbate is a function of the strength of sorption. The Halsey equation gave a good fit to the experimental data with an R2 = 0.9711 and 0.9703 for the original and the modified model, respectively. The mean percentage error decreased from 12.42 to 9.94 % for the original and the modified model, respectively. Similar behavior was observed with the BET model as the %E decreased from 20.10 to 13.94 on the modified model. This model is recommended for foods such as meat, dairy products and seeds (Ghayal et al., 2013; Zomorodian et al., 2011). The model showed a poor fit for biodegradable chitosan films with polyethylene glycol (Srinivasa et al., 2007).
4 Conclusions
The original and modified GAB and Dswin models fitted better to the experimental data of moisture adsorption isotherms of biodegradable films based on chitosan. Dn the other hand, only the modified models of Halsey and Henderson showed good fit. In general, the modified models were best suited to describe the behavior of moisture adsorption of chitosan films.
References
Aguirre-Loredo, R. Y., Rodríguez-Hernández, A. I., & Chavarría-Hernández, N. (2014). Physical properties of emulsified films based on chitosan and oleic acid. CyTA - Journal of Food, 12(4), 305-312. http://dx.doi.org/10.1080/19476337.2013.853207.
Al-Hassan, A. A., & Norziah, M. H. (2012). Starch-gelatin edible films: water vapor permeability and mechanical properties as affected by plasticizers. Food Hydrocolloids, 26(1), 108-117. http://dx.doi. org/10.1016/j.foodhyd.2011.04.015.
Alvarado, S., Sandoval, G., Palos, I., Tellez, S., Aguirre-Loredo, Y., & Velazquez, G. (2015). The effect of relative humidity on tensile strength and water vapor permeability in chitosan, fish gelatin and transglutaminase edible films. Food Science and Technology, 35(4), 690-695. http://dx.doi.org/10.1590/1678-457X.6797.
Alzamora, S. M., Tapia, M. S., López-Malo, A., & Welti-Chanes, J. (2003). The control of water activity. In P. Zeuthen & L. Bøgh-Sørensen (Eds.), Food preservation techniques (pp. 126-153). Cambrigde: Woodhead Publishing.
Anderson, R. B. (1946). Modifications of the Brunauer, Emmett and Teller Equation. Journal of the American Chemical Society, 68(4), 686-691. http://dx.doi.org/10.1021/ja01208a049. PMid:18861755. Arslan, N., & Togˇrul, H. (2005). Modelling of water sorption isotherms
of macaroni stored in a chamber under controlled humidity and thermodynamic approach. Journal of Food Engineering, 69(2), 133-145. http://dx.doi.org/10.1016/j.jfoodeng.2004.08.004.
Aviara, N. A., Ajibola, D. D., & Dni, S. A. (2004). Sorption equilibrium and thermodynamic characteristics of soya bean. Biosystems Engineering, 87(2), 179-190. http://dx.doi.org/10.1016/j.biosystemseng.2003.11.006. Ayala Aponte, A., Serna Cock, L., & Rodriguez de la Pava, G. (2011).
Moisture adsorption isotherms in yellow pitahaya (Selenicereus megalanthus). DYNA, 78, 7-14.
Barbosa-Cánovas, G. V., Fontana, A. J., Jr., Schmidt, S. J., & Labuza, T. P. (2008). Water activity prediction and moisture sorption isotherms. In T. P. Labuza & L. Altunakar (Eds.), Water activity in foods (pp. 109-154). Dxford: Blackwell Publishing.
Boer, J. H. (1953). The dynamical character of adsorption. Dxford: Clarendon Press.
Bratasz, Ł., Kozłowska, A., & Kozłowski, R. (2012). Analysis of water adsorption by wood using the Guggenheim-Anderson-de Boer equation. European Journal of Wood and Wood Products, 70(4), 445-451. http://dx.doi.org/10.1007/s00107-011-0571-x.
Cervera, M. F., Heinämäki, J., Krogars, K., Jörgensen, A. C., Karjalainen, M., Colarte, A. I., & Yliruusi, J. (2004). Solid-state and mechanical properties of aqueous chitosan-amylose starch films plasticized with polyols. AAPS PharmSciTech, 5(1), 109-114. PMid:15198536. Chen, C. (2002). PH-pastharvest technology: sorption isotherms of
sweet potato slices. Biosystems Engineering, 83(1), 85-95. http:// dx.doi.org/10.1006/bioe.2002.0093.
Cunha, C. R. D., Santos, S. L. D., Maciel, V. T., Souza, M. L. D., Furtado, C. D. M., & Carvalho, A. V. (2014). Stability of porridge pre-mixture made with Brazil nut flour and green banana flour with and without Figure 2. Monolayer moisture content of chitosan films as a function
Muzaffar, K., & Kumar, P. (2016). Moisture sorption isotherms and storage study of spray dried tamarind pulp powder. Powder Technology, 291, 322-327. http://dx.doi.org/10.1016/j.powtec.2015.12.046.
Nordin Ibrahim, M., Tajaddodi Talab, K., Spotar, S., Kharidah, M., & Rosnita, A. T. (2013). Desorption isotherm model for a Malaysian rough rice variety (MR219). Pertanika. Journal of Tropical Agricultural
Science, 36(2), 189-198.
Peng, G., Chen, X., Wu, W., & Jiang, X. (2007). Modeling of water sorption isotherm for corn starch. Journal of Food Engineering, 80(2), 562-567. http://dx.doi.org/10.1016/j.jfoodeng.2006.04.063. Pittia, P., & Sacchetti, G. (2008). Antiplasticization effect of water in
amorphous foods: a review. Food Chemistry, 106(4), 1417-1427. http://dx.doi.org/10.1016/j.foodchem.2007.03.077.
Quirijns, E. J., van Boxtel, A. J. B., van Loon, W. K. P., & van Straten, G. (2005). Sorption isotherms, GAB parameters and isosteric heat of sorption. Journal of the Science of Food and Agriculture, 85(11), 1805-1814. http://dx.doi.org/10.1002/jsfa.2140.
Schmid, M., Reichert, K., Hammann, F., & Stäbler, A. (2015). Storage time-dependent alteration of molecular interaction–property relationships of whey protein isolate-based films and coatings. Journal
of Materials Science, 50(12), 4396-4404. http://dx.doi.org/10.1007/
s10853-015-8994-0.
Sébastien, F., Stéphane, G., Copinet, A., & Coma, V. (2006). Novel biodegradable films made from chitosan and poly(lactic acid) with antifungal properties against mycotoxinogen strains. Carbohydrate
Polymers, 65(2), 185-193. http://dx.doi.org/10.1016/j.carbpol.2006.01.006.
Slavutsky, A. M., & Bertuzzi, M. A. (2012). A phenomenological and thermodynamic study of the water permeation process in corn starch/MMT films. Carbohydrate Polymers, 90(1), 551-557. http:// dx.doi.org/10.1016/j.carbpol.2012.05.077. PMid:24751076. Souza, S. J. F., Alves, A. I., Vieira, É. N. R., Vieira, J. A. G., Ramos, A. M.,
& Telis-Romero, J. (2015). Study of thermodynamic water properties and moisture sorption hysteresis of mango skin. Food Science and
Technology, 35(1), 157-166. http://dx.doi.org/10.1590/1678-457X.6557.
Srinivasa, P. C., Ramesh, M. N., & Tharanathan, R. N. (2007). Effect of plasticizers and fatty acids on mechanical and permeability characteristics of chitosan films. Food Hydrocolloids, 21(7), 1113-1122. http://dx.doi.org/10.1016/j.foodhyd.2006.08.005.
Srinivasa, P. C., Ramesh, M. N., Kumar, K. R., & Tharanathan, R. N. (2003). Properties and sorption studies of chitosan–polyvinyl alcohol blend films. Carbohydrate Polymers, 53(4), 431-438. http://dx.doi. org/10.1016/S0144-8617(03)00105-X.
Timmermann, E. D., Chirife, J., & Iglesias, H. A. (2001). Water sorption isotherms of foods and foodstuffs: BET or GAB parameters? Journal
of Food Engineering, 48(1), 19-31.
http://dx.doi.org/10.1016/S0260-8774(00)00139-4.
Wolf, W., Spiess, W. E. L., & Jung, G. (1985). Standardization of isotherm measurements (Cost-Project 90 and 90 BIS). In D. Simatos & J. L. Multon (Eds.), Properties of water in foods (Vol. 90, pp. 661-679). Dordrecht: Springer Netherlands.
Zhang, Y., & Han, J. H. (2008). Sorption isotherm and plasticization effect of moisture and plasticizers in pea starch film. Journal of
Food Science, 73(7), E313-E324.
http://dx.doi.org/10.1111/j.1750-3841.2008.00867.x. PMid:18803705.
Zomorodian, A., Kavoosi, Z., & Momenzadeh, L. (2011). Determination of EMC isotherms and appropriate mathematical models for canola.
Food and Bioproducts Processing, 89(4), 407-413. http://dx.doi.
org/10.1016/j.fbp.2010.10.006. milk powder. Food Science and Technology, 34(3), 585-590. http://
dx.doi.org/10.1590/1678-457x.6368.
Figura, L. D., & Teixeira, A. A. (2007). Water activity. In L. D. Figura & A. A. Teixeira (Eds.), Food physics (pp. 1-39). Berlin: Springer Berlin Heidelberg.
Furmaniak, S., Terzyk, A. P., Gauden, P. A., & Rychlicki, G. (2007). Applicability of the generalised D’Arcy and Watt model to description of water sorption on pineapple and other foodstuffs. Journal of
Food Engineering, 79(2), 718-723. http://dx.doi.org/10.1016/j.
jfoodeng.2006.02.036.
Gálvez, A. V., Aravena, E. L., & Mondaca, R. L. (2006). Isotermas de adsorción en harina de maíz (Zea mays L.). Food Science and
Technology, 26(4), 821-827.
http://dx.doi.org/10.1590/S0101-20612006000400017.
Ghayal, G., Jha, A., Sahu, J. K., Kumar, A., Gautam, A., Kumar, R., & Rasane, P. (2013). Moisture sorption isotherms of dietetic Rabri at different storage temperatures. International Journal of Dairy
Technology, 66(4), 587-594. http://dx.doi.org/10.1111/1471-0307.12083.
Gocho, H., Shimizu, H., Tanioka, A., Chou, T. J., & Nakajima, T. (2000). Effect of polymer chain end on sorption isotherm of water by chitosan. Carbohydrate Polymers, 41(1), 87-90. http://dx.doi. org/10.1016/S0144-8617(99)00113-7.
Guggenheim, E. A. (1966). Applications of statistical mechanics. Dxford: Clarendon Press.
Hartley, I. D., Kamke, F. A., & Peemoeller, H. (1992). Cluster theory for water sorption in wood. Wood Science and Technology, 26(2), 83-99. http://dx.doi.org/10.1007/BF00194465.
Hirase, R., Higashiyama, Y., Mori, M., Takahara, Y., & Yamane, C. (2010). Hydrated salts as both solvent and plasticizer for chitosan.
Carbohydrate Polymers, 80(3), 993-996. http://dx.doi.org/10.1016/j.
carbpol.2010.01.001.
Jain, S. K., Verma, R. C., Sharma, G. P., & Jain, H. K. (2010). Studies on moisture sorption isotherms for osmotically dehydrated papaya cubes and verification of selected models. Journal of Food Science
and Technology, 47(3), 343-346.
http://dx.doi.org/10.1007/s13197-010-0056-7. PMid:23572650.
Kaymak-Ertekin, F., & Sultanoğlu, M. (2001). Moisture sorption isotherm characteristics of peppers. Journal of Food Engineering, 47(3), 225-231. http://dx.doi.org/10.1016/S0260-8774(00)00120-5. Kitic, D., Jardim, D. C. P., Favetto, G. J., Resnik, S. L., & Chirife, J. (1986). Theoretical prediction of the water activity of standard saturated salt solutions at various temperatures. Journal of Food Science, 51(4), 1037-1041. http://dx.doi.org/10.1111/j.1365-2621.1986.tb11227.x. Lavoyer, F. C. G., Gabas, A. L., Dliveira, W. P., & Telis-Romero, J.
(2013). Study of adsorption isotherms of green coconut pulp. Food
Science and Technology, 33(1), 68-74. http://dx.doi.org/10.1590/
S0101-20612013005000017.
Li, X. (2012). The hygroscopic properties and sorption isosteric heats of different chinese wheat types. Journal of Food Research, 1(2), 82-98. http://dx.doi.org/10.5539/jfr.v1n2p82.
Lin, S.-Y., Wang, S.-L., Wei, Y.-S., & Li, M.-J. (2007). Temperature effect on water desorption from methylcellulose films studied by thermal FT-IR microspectroscopy. Surface Science, 601(3), 781-785. http:// dx.doi.org/10.1016/j.susc.2006.11.006.
Medeiros, M. L., Bartolomeu Ayrosa, A. M. I., de Moraes Pitombo, R. N., & da Silva Lannes, S. C. (2006). Sorption isotherms of cocoa and cupuassu products. Journal of Food Engineering, 73(4), 402-406. http://dx.doi.org/10.1016/j.jfoodeng.2005.02.002.