Identifying Nile tilapia strains and their hybrids
farmed in Brazil using microsatellite markers
Rafael Antunes Baggio(1), Raphael Orélis‑Ribeiro(1) and Walter Antonio Boeger(1)
(1)Universidade Federal do Paraná, Setor de Ciências Biológicas, Departamento de Zoologia, Laboratório de Ecologia Molecular, Avenida Coronel Francisco H. dos Santos, no 100, Jardim das Américas, CEP 81531‑980 Curitiba, PR, Brazil. E‑mail: rbaggioufpr@gmail.com, ror0002@tigermail.auburn.edu, wboeger@ufpr.br
Abstract – The objective of this work was to evaluate a Bayesian model-based clustering method to identify the strains of Nile tilapia (Oreochromis niloticus) individuals from fish farms in Southern Brazil. Assignment methods using nine microsatellite loci were applied to differentiate individuals of five reference strains (GIFT, GST, Nilótica, Chitralada, and Saint Peter) and to identify individuals of unknown strains from fish farms near the Itaipu reservoir and in the Uruguay River basin. The procedure assigned the correct strain in more than 90% of the cases and was also able to detect hybrids between strains. The obtained results showed that several fish farms in Southern Brazil cultivate more than one tilapia strain and even interstrain hybrids. The proposed methodology is a reliable tool for the identification of the strain origin of Nile tilapia individuals. Index terms: Oreochromis niloticus, aquaculture, strain certification.
Identificação de linhagens de tilápia‑do‑nilo e seus híbridos
cultivados no Brasil por meio de marcadores microssatélites
Resumo – O objetivo deste trabalho foi avaliar uma metodologia de agrupamento baseada em modelo Bayesiano para identificação de linhagens de indivíduos de tilápia‑do‑nilo (Oreochromis niloticus) de pisciculturas no Sul do Brasil. Métodos de alocação com nove loci de marcadores microssatélites foram aplicados para diferenciar indivíduos de cinco linhagens‑referência (GIFT, GST, Nilótica, Chitralada e Saint Peter) e para identificar indivíduos de linhagens desconhecidas coletados em pisciculturas ao redor do reservatório de Itaipu e na bacia do rio Uruguai. O procedimento atribuiu a linhagem correta em mais de 90% dos casos e pôde, inclusive, detectar híbridos entre linhagens. Os resultados obtidos mostraram que várias pisciculturas no Sul do Brasil cultivam mais de uma linhagem de tilápia‑do‑nilo e até mesmo híbridos entre as linhagens. A metodologia proposta é uma ferramenta confiável para a identificação das linhagens de origem de indivíduos de tilápia‑do‑nilo.
Termos para indexação: Oreochromis niloticus, aquicultura, certificação de linhagens.
Introduction
Nile tilapia, Oreochromis niloticus (Linnaeus, 1758),
is one of the most popular fish in global aquaculture
and, therefore, has been a target species for numerous genetic improvement programs (Eknath & Hulata,
2009; Rodriguez‑Rodriguez et al., 2013). As such,
several strains have been developed and improved
along the years. Specifically in Brazil, some of these strains have been officially imported and produced
since 1971 (Moreira et al., 2007; Massago et al., 2010).
A few notable examples include: the Chitralada strain
from Thailand, imported in 1996 from the Asian Institute of Technology (Khlong Luang, Pathum
Thani, Thailand); the GenoMar Supreme Tilapia (GST) strain from Norway, imported in 2002 from GenoMar
(Oslo, Norway); and the Genetically Improved Farmed Tilapia (GIFT) strain from Malaysia, imported in 2005 from WorldFish (Bayan Lepas, Penang, Malaysia)
(Lupchinski Júnior et al., 2008; Massago et al., 2010;
Rodriguez‑Rodriguez et al., 2013; Dias et al., 2016). The identification of Nile tilapia at species and
subspecies levels has been traditionally based on distinctive recognition features, such as reproduction traits, feeding habits, developmental differences, structural characters, and biogeography (Melo et al.,
2008). However, due to considerable intraspecific
levels of hybridization among stocks, which clearly affects the accuracy of their identification. This many strains have different zootechnical characteristics,
and the farming of interstrain hybrids may result in
decreased productivity in fish farms (Sukmanomon
et al., 2012a). Therefore, the accurate determination of species, subspecies, strains, and hybrids of farmed tilapia should be a priority to increase the production
efficiency and reliability of Nile tilapia aquaculture.
Molecular markers are widely used to identify diverse taxa, irrespectively of their life stage, allowing
a limited amount of tissue sampling. Given these
attributes, such markers might represent a suitable and reliable tool to overcome the problems inherent in determining the identity of cultured Nile tilapia strains. Previous attempts to discriminate these strains
were based on random amplification of polymorphic
DNA (RAPD) (Bardakci & Skibinski, 1994) and on
5S rDNA (Alves‑Costa et al., 2006). However, the problems related with RAPD replicability (Freeland
et al., 2011) and the uncontrolled introgression of genes in Nile tilapia (Sukmanomon et al., 2012b) have rendered these techniques less applicable than other
modern multilocus molecular markers. For instance, Van Bers et al. (2012) described a pool of 384 single
nucleotide polymorphisms (SNP) that could be used to differentiate individuals from different species and strains of Nile tilapia. Likewise, microsatellite markers can also be adopted for this purpose. The latter method was previously used to test genetic changes in strains of Nile tilapia (Sukmanomon et al., 2012a; Li et al., 2015) and to assess genetic introgression on feral populations of the species from Thailand (Sukmanomon et al.,
2012b), Fiji (McKinna et al., 2010), and southern Africa
(D’Amato et al., 2007).
Although the outcomes from the aforementioned studies indicate that this method is promising as a tool to identify the strain of origin of Nile tilapia individuals, there is no known study that performs such analysis.
The objective of this work was to evaluate a Bayesian model-based clustering method to identify the strains of
Nile tilapia individuals from fish farms in South Brazil.
Materials and Methods
To create a baseline dataset of genotypes, a total of 99 samples were collected from reference strains of
Nile tilapia obtained from five commercial hatcheries
that maintain their own brood stock. These samples
included: 20 specimens of the Saint Peter strain,
from Piscicultura Dal Bosco (Toledo, PR, Brazil); 20 specimens of the Nilótica strain, from Aquacultura Tupi (Guaíra, PR, Brazil); 20 specimens of the Chitralada strain, from Aquabel Piscicultura (Rolândia, PR, Brazil); 20 specimens of the GST strain, also from Aquabel Piscicultura (Rolândia, PR, Brazil); and 19 specimens of the GIFT strain, from Universidade Estadual de Maringá (Maringá, PR, Brazil). It should be noted that the Chitralada, GST, and GIFT strains
farmed by these commercial hatcheries are direct descendants of the original stocks from the Asian
Institute of Technology, GenoMar, and WorldFish,
respectively, whereas the reference specimens for the
two remaining strains, Nilótica and Saint Peter, do not
represent pure individuals. However, this apparent limitation should not hinder further analyses because the methodology employed in the present study for strain discrimination is based on the detection of
shared genetic profiles of individuals, in spite of the
amount of mixing with other strains, which can also be estimated with this protocol.
To test the effectiveness of the method, four
individuals were collected from each of the eight fish farms near the Itaipu reservoir, in the state of Paraná, and from ten fish farms in the Uruguay river basin, in the state of Rio Grande do Sul (Table 1). Both reference
individuals and with unknown strains were sampled in 2010.
Fin clips from each individual were removed,
preserved in a saline EDTA-DMSO buffer (Seutin et al., 1991), and stored at -20oC. Total genomic DNA
was extracted with the iPrep ChargeSwitch kit using an
automated liquid-handling robot (Invitrogen, Thermo
Fisher Scientific, Waltham, MA, USA), according to the manufacturer’s specifications. All individuals
were genotyped for nine microsatellite loci of different linkage groups, which are frequently used to access the genetic diversity of Nile tilapia species and strains,
using the following fluorescent‑labeled primers, with the GenBank accession number between parentheses: UNH104 (G12257.1), UNH118 (G12271.1), UNH146 (G12298.1), UNH160 (G12312.1), UNH169 (G12321.1), UNH178 (G12330.1), UNH208 (G12359.1), UNH211 (G12362.1), and UNH222 (G12373.1). Ten µL PCR reactions for each locus included the following final concentrations: 1.5 µmol L-1 fluorescent‑labeled
0.2 mmol L-1 dNTP, 0.03 U Taq Platinum, 1x buffer,
1.5 mmol L-1 MgCl, and 0.5 ng µL-1 DNA template. PCR
conditions for all loci included initial denaturation for
3 min at 94ºC, followed by 35 cycles of denaturation for 30 s at 95ºC, annealing temperature for 60 s at 48ºC (UNH146 at 56ºC), extension for 60 s at 70°C, and final extension for 1 hour at 70oC. Genotyping
was performed on the ABI 3130 sequencer (Applied Biosystems, Thermo Fisher Scientific Waltham, MA,
USA), and fragment analyses were conducted using
the GeneMarker software, version 1.6 (SoftGenetics, State College, PA, USA).
The presence of null alleles and scoring errors
was assessed using the Micro‑Checker software, version 2.2.3 (van Oosterhout et al., 2004). Diversity, Hardy‑Weinberg equilibrium, and FST analyses were
implemented in the Arlequin software, version 3.5 (Excoffier & Lischer, 2010). In all tests in which multiple comparisons were made, the significance
levels were corrected by Bonferroni’s method.
Assignment of individuals of unknown strains to their putative source populations, as well as the evaluation of the accuracy of the method, was carried out using a Bayesian model-based clustering approach
in the Structure software, version 2.3.1 (Pritchard et al., 2000). First, the genetic structure of the reference
populations was assessed to determine the number of clusters (K) that best differentiated the strains, using no admixture model. Once the best number of clusters
was identified for the reference strains, an assignment
analysis was performed using a model without admixture, including the individuals of unknown
strains sourced from fish farms. The calculations were
performed for each K between 1 and 8, with 10 runs of 100,000 burn-in and 1,000,000 replicates per run. Individuals that presented 0.1< q <0.9 were considered hybrids (Vähä & Primmer, 2006).
Results and Discussion
All nine loci evaluated in the present study presented
a high number of alleles and levels of heterozygosity
in the reference samples (Table 2), similar to those found by Rutten et al. (2004), Melo et al. (2006), Moreira et al. (2007), and Petersen et al. (2012). The presence of null alleles, scoring errors, linkage, and Hardy-Weinberg disequilibrium was not recurrent
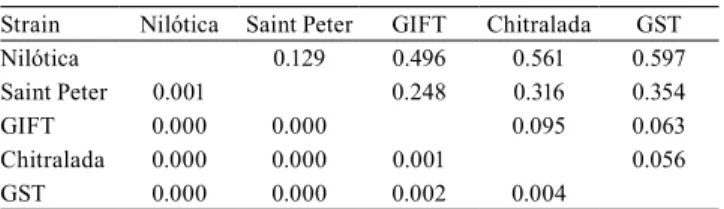
among stocks and among loci. Pairwise FST revealed
significant genetic differentiation among all reference strains (Table 3), presenting values that ranged from 0.056 (p=0.004), between Chitralada and GST strains, to 0.597 (p<0.001), between GST and Nilótica strains.
In the assignment test, the best estimate for K was 4. In this analysis, all strains were well differentiated from
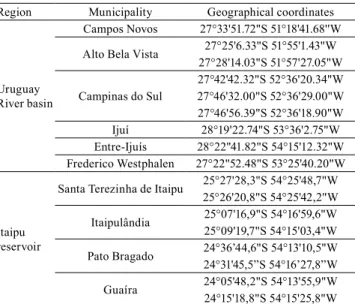
Table 1. Geographical location of fish farms in the Uruguay
River basin and near the Itaipu reservoir where individuals of unknown strains of Nile tilapia (Oreochromis niloticus) were sampled.
Region Municipality Geographical coordinates
Uruguay River basin
Campos Novos 27°33'51.72"S 51°18'41.68''W
Alto Bela Vista 27°25'6.33"S 51°55'1.43"W
27°28'14.03"S 51°57'27.05"W
Campinas do Sul
27°42'42.32"S 52°36'20.34"W 27°46'32.00"S 52°36'29.00"W 27°46'56.39"S 52°36'18.90"W
Ijuí 28°19'22.74"S 53°36'2.75"W Entre-Ijuís 28°22"41.82"S 54°15'12.32"W
Frederico Westphalen 27°22"52.48"S 53°25'40.20"W
Itaipu reservoir
Santa Terezinha de Itaipu 25°27'28,3"S 54°25'48,7"W 25°26'20,8"S 54°25'42,2"W Itaipulândia 25°07'16,9"S 54°16'59,6"W25°09'19,7"S 54°15'03,4"W
Pato Bragado 24°36’44,6"S 54°13'10,5"W
24°31'45,5”S 54°16’27,8”W Guaíra 24°05'48,2"S 54°13'55,9"W 24°15'18,8"S 54°15'25,8"W
Table 2. Number of individuals genotyped (N), observed heterozygosity (Ho), expected heterozygosity (He), inbreeding coefficient (Fis), and number of alleles of each loci.
Strain N Ho He Fis UNH104 UNH118 UNH146 UNH160 UNH169 UNH178 UNH208 UNH211 UNH222 Mean
Nilótica 20 0.469 0.533 0.123 2* 5 4 1 3 5 5 6 4 4.2
Saint Peter 20 0.750 0.771 0.028 9 9 4 8 12 8 9 7 7 8.1
GIFT 19 0.731 0.702 -0.042 9 6 4 7 9 5 5 7 3 6.1
Chitralada 20 0.700 0.692 -0.010 7 8 3 5 10 8 8 10 5 7.1
GST 20 0.761 0.737 ‑0.033 11 8 2 8 8 9 8 10 3 7.4
each other, with the exception of GIFT and GST that
were assigned to the same cluster, thereafter named
GIFT‑GST (Table 4). The inaccuracy of the proposed protocol to distinguish individuals of the GIFT and GST strains likely reflects their origins. The genetic
improvement of both strains was based on the same
genetic profile. GenoMar acquired all marketing rights of GIFT in 1999 and developed the GenoMar Supreme Tilapia strain (GST) from Generation 10 (Gupta &
Acosta, 2004). However, it is possible that a greater number of loci may be more effective in differentiating these strains.
When only individuals of reference strains were included in the assignment test, the total percentage of correct assignment was 91%. Individuals of the
Nilótica, Saint Peter, and GIFT strains were correctly
assigned in 100% of the cases, whereas individuals
from the Chitralada and GST strains were correctly assigned in 90 and 60% of them, respectively (Figure 1).
The percentage of correct assignment increased to 94% of reference strain individuals and to 80% in the
analysis of the GST strain in the analysis comprising
individuals of unknow strains.
The inability to fully distinguish between
individuals from the Chitralada and GST strains
is not unprecedented. Sukmanomon et al. (2012a)
found similar introgression between Chitralada and GIFT strains, when using 14 microsatellite loci and 28 individuals of the GIFT strain (reference population), 80 individuals of the Chitralada strain
(reference population), and 50 individuals from each
of the two Chitralada‑derived populations. This
recurrence suggests that this introgression is real, instead of a potential shortcoming of the method.
Despite the inability of the method to separate GIFT and GST strains, the present protocol showed high
efficiency (91–94% correct assignments) in identifying
the strains of Nile tilapia individuals. The addition to the analysis of individuals of unknown strains
from fish farms near the Itaipu reservoir and in the
Uruguay River basin improved the resolution of the
assignment to the GST strain, that is, the percentage
of correct assignment. This result indicates that using
more individuals may increase the efficiency of the identifications. Therefore, the results of the present
study suggest that at least 20 individuals from each strain should be used to create the baseline dataset, comprising the reference populations. However, a more robust framework is most likely to be reached
using around 30 individuals from each known strain.
This number is approximately the mean value of the sum of the number of individuals assigned within each
strain, which was of 31.6 in the analysis that used the
whole dataset (i.e., individuals from reference strains
jointly with the assigned individuals from the fish
farms) and that correctly determined the strain of 94% of the individuals of the reference populations.
High levels of assignment of the individuals from the reference strains were maintained only when the following loci were removed: UNH178 (92%); UNH104 and UNH178 (91%); and UNH104, UNH178, UNH 208, and UNH211 (91%). When only the UNH118,
UNH146, UNH160, and UNH169 loci were analyzed,
accuracy was reduced to 85%. In other words, although each reference strain was assigned correctly in the
analyses with five to nine loci, analyses using a lower
number of loci resulted in a less accurate assignment of individuals from the reference populations. Therefore,
at least five loci should be used, in this case, UNH118,
UNH146, UNH160, UNH169, and UNH222, but
Table 3. FST values (above diagonal) among five different
strains of Nile tilapia (Oreochromis niloticus) and their respective p-values (below diagonal)(1).
Strain Nilótica Saint Peter GIFT Chitralada GST
Nilótica 0.129 0.496 0.561 0.597
Saint Peter 0.001 0.248 0.316 0.354
GIFT 0.000 0.000 0.095 0.063
Chitralada 0.000 0.000 0.001 0.056
GST 0.000 0.000 0.002 0.004
(1)Significant differences at 0.5% probability after Bonferroni correction.
Table 4. Proportion of the genotypes from each strain (lines) belonging to each of the four clusters (columns) in the analyses using only reference strains of Nile tilapia (Oreochromis niloticus) (before bar) and using both reference and unknown strains (after bar).
Strain/cluster Nilótica Saint Peter GIFT‑GST Chitralada
Nilótica 0.999 / 0.999* 0.001 / 0.001 0.000 / 0.000 0.000 / 0.000 Saint Peter 0.004 / 0.005 0.996 / 0.995* 0.000 / 0.000 0.000 / 0.000
GIFT 0.000 / 0.000 0.000 / 0.000 1.000 / 1.000* 0.000 / 0.000
Chitralada 0.000 / 0.000 0.000 / 0.000 0.059 / 0.107 0.941 / 0.893*
using seven (plus UNH208 and UNH211) or eight (plus UNH104, UNH208, and UNH211) may be advantageous in order to improve the assignment accuracy of strains, probably even of those that were not examined in the present study.
The molecular protocol tested in the present study also has an outstanding potential to evaluate the degree
of hybridization among strains of Nile tilapia. Therefore,
it may be instrumental in assessing the management of
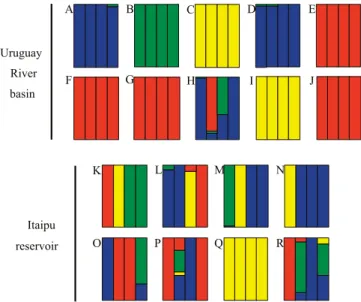
captive systems. Interstrain hybrids were found in fish farms from both analyzed areas (Figure 2). However, despite the lower number of sampled fish farms and
genotyped individuals, hybrids were more prevalent in
the farms near the Itaipu reservoir. Of these fish farms, only one cultivated single‑strain tilapia (GIFT‑GST),
while seven (88%) presented more than one strain,
and two (25%) interstrain hybrids. In fish farms from the Uruguay River basin, only the farm fish in
Entre-Ijuís cultivated hybrid specimens. All reference strains were detected in this region, with a prevalence
of the Chitralada strain in 50% (n = 4) of the studied fish farms. Individuals from fish farms in Frederico Westphalen (Figure 2 H–J), assigned as Chitralada and GIFT strains, and from the reference strains of the
database of the present study were obtained from the
same suppliers – Aquabel GenoMar and Universidade
Estadual de Maringá, respectively –, and the analyses
assigned them correctly.
The presence of multiple strains produced in
the same fish farm, often in the same tank or pond,
along with the detection of interstrain hybrids is a matter of concern. The different strains have
distinct zootechnical characteristics, and the choice
of an appropriate strain for a set of conditions could
increase farming efficiency (Eknath & Hulata, 2009).
It should be highlighted that the farming of interstrain hybrids is undesirable and could lead to a decrease in productivity (Sukmanomon et al., 2012a).
The identification of individuals of unknown strains
is important to certify Nile tilapia larvae and fry. Oftentimes, producers purchase but do not receive fry from the expected strain of tilapia; this occurs due to lack of knowledge of the buyer but also of the producers
of the larvae (Chammas, 2008). This method can help
producers to ensure the identity of the strains that they
are producing and trading, with the associated benefits
of culturing a known strain. The choice of strains
with specific best performance, the avoidance of crossbreeds among stocks, and strain certification of
Figure 1. Relative assignment of Nile tilapia (Oreochromis niloticus) individuals in analyses using only reference strains (A) (K = 4) and using both reference and unknown strains (B) (K = 4). Single bars represent an individual. Colors represent the posterior probability that an individual belongs to each cluster: blue, Nilótica cluster; green, Saint Peter cluster; yellow, GIFT‑GST cluster; and Red, Chitralada cluster. K, number of clusters.
fry are essential stages towards the professionalization of aquaculture in Brazil (Chammas, 2008).
Conclusion
The Bayesian model-based clustering method implemented with microsatellite data presents high accuracy and, therefore, can be used to distinguish among all tested strains from farmed and traded Nile tilapia (Oreochromis niloticus) in Brazil.
Acknowledgments
To Ministério da Pesca e Aquicultura (MPA) and
to Conselho Nacional de Desenvolvimento Científico e Tecnológico (CNPq), for financial support; to CNPq,
for research fellowship to the third author; to Ricardo
Pereira Ribeiro of Universidade Estadual de Maringá,
to Ricardo Neukirchner of Aquabel Piscicultura, to
G. dal Bosco of Piscicultura Dal Bosco, to Aroudo of Aquacultura Tupi, and to Ivanir José Coldebella of
Universidade Regional Integrada do Alto Uruguai e das Missões (URI), for providing reference strains of
Nile tilapia; and to Flavio Miranda Marteleto, Diego
Barbalho Hungria, Lineu de Brito, Adriano Hauer, and
Diego Rafael Wojcik Gomes, for sampling.
References
ALVES‑COSTA, F.A.; WASKO, A.P.; OLIVEIRA, C.; FORESTI, F.; MARTINS, C. Genomic organization and evolution of the 5S ribosomal DNA in Tilapiini fishes. Genetica, v.127, p.243‑252, 2006. DOI: 10.1007/s10709‑005‑4013‑8.
BARDAKCI, F.; SKIBINSKI, D.O.F. Application of the RAPD technique in tilapia fish: species and subspecies identification. Heredity, v.73, p.117‑123, 1994. DOI: 10.1038/hdy.1994.110. CHAMMAS, M.A. Reflexões sobre as bases técnicas e conceituais
para o desenvolvimento da aquicultura. In: OSTRENSKY, A.;
BORGHETTI, J.R.; SOTO, D. (Ed.). Aquicultura no Brasil: o
desafio é crescer. Brasília: Secretaria Especial de Aquicultura e Pesca: FAO, 2008. p.229‑246.
D’AMATO, M.E.; ESTERHUYSE, M.M.; WALL, B.C.W. van der; BRINK, D.; VOLCKAERT, F.A.M. Hybridization and phylogeography of the Mozambique tilapia Oreochromis
mossambicus in southern Africa evidenced by mitochondrial and
microsatellite DNA genotyping. Conservation Genetics, v.8, p.475-488, 2007. DOI: 10.1007/s10592-006-9186-x.
DIAS, M.A.D.; FREITAS, R.T.F. de; ARRANZ, S.E.; VILLANOVA, G.V.; HILSDORF, A.W.S. Evaluation of the
genetic diversity of microsatellite markers among four strains of
Oreochromis niloticus. Animal Genetics, v.47, p.345‑353, 2016.
DOI: 10.1111/age.12423.
EKNATH, A.E.; HULATA, G. Use and exchange of genetic
resources of Nile tilapia (Oreochromis niloticus). Reviews in Aquaculture, v.1, p.197‑213, 2009. DOI: 10.1111/j.1753‑5131.200
9.01017.x.
EXCOFFIER, L.; LISCHER, H.E.L. Arlequin suite ver. 3.5: a
new series of programs to perform population genetics analyses under Linux and Windows. Molecular Ecology Resources, v.10, p.564-567, 2010. DOI: 10.1111/j.1755-0998.2010.02847.x.
FREELAND, J.R.; KIRK, H.; PETERSEN, S. Molecular
Ecology. 2nd ed. New Jersey: John Wiley & Sons, 2011. 464p. DOI: 10.1002/9780470979365.
GUPTA, M.V.; ACOSTA, B.O. From drawing board to dining : the success story of the GIFT project. NAGA, v.27, p.4-14, 2004.
LI, D.; YANG, H.; ZOU, Z.; XIAO, W.; ZHU, J.; LUO, Y.
Polymorphic microsatellite differences among four cultured populations of two selected tilapia strains. Aquaculture Research, v.46, p.492-498, 2015. DOI: 10.1111/are.12202.
LUPCHINSKI JÚNIOR, E.; VARGAS, L.; POVH, J.A.; RIBEIRO, R.P.; MANGOLIN, C.A.; BARRERO, N.M.L. Avaliação da variabilidade das gerações G0 e F1 da linhagem GIFT de tilápia do Nilo (Oreochromis niloticus) por RAPD. Acta Scientarum. Animal Sciences, v.30, p.233‑240, 2008. DOI:
10.4025/actascianimsci.v30i2.4708.
MASSAGO, H.; CASTAGNOLLI, N.; MALHEIROS, E.B.; KOBERSTEIN, T.C.R.D.; SANTOS, M.A. dos; RIBEIRO, R.P. Crescimento de quatro linhagens de tilápia Oreochromis
niloticus. Revista Acadêmica: Ciências Agrárias e Ambientais,
v.8, p.397‑403, 2010.
MCKINNA, E.M.; NANDLAL, S.; MATHER, P.B.; HURWOOD,
D.A. An investigation of the possible causes for the loss of productivity in genetically improved farmed tilapia strain in
Fiji: inbreeding versus wild stock introgression. Aquaculture Research, v.41, p.e730‑e742, 2010. DOI: 10.1111/j.1365‑2109.201 0.02539.x.
MELO, D.C.; OLIVEIRA, D.A.A.; RIBEIRO, L.P.; TEIXEIRA, C.S.; SOUSA, A.B.; COELHO, E.G.A; CREPALDI, D.V.; TEIXEIRA, E.A. Caracterização genética de seis plantéis comerciais de tilápia (Oreochromis) utilizando marcadores
microssatélites. Arquivo Brasileiro de Medicina Veterinária e Zootecnia, v.58, p.87‑93, 2006. DOI: 10.1590/ S0102‑09352006000100013.
MELO, D.C. de; OLIVEIRA, D.A.A.; SEERIG, A.; CARVALHO, D.C. de. Aplicações práticas de marcadores microssatélites na caracterização genética e identificação de plantéis de tilápia. Revista Brasileira de Reprodução Animal, v.32, p.220‑224,
2008.
PETERSEN, R.L.; GARCIA, J.E.; MELLO, G.; LIEDKE, A.M.R.; SINCERO, T.C.M.; GRISARD, E.C. Análise da diversidade genética de tilápias cultivadas no estado de Santa Catarina (Brasil) utilizando marcadores microssatélites. Boletim do Instituto da Pesca, v.38, p.313‑321, 2012.
PRITCHARD, J.K.; STEPHENS, M.; DONNELLY, P. Inference
of population structure using multilocus genotype data. Genetics, v.155, p.945-959, 2000.
RODRIGUEZ‑RODRIGUEZ, M. Del P.; LOPERA‑BARRERO, N.M.; VARGAS, L.; ALBUQUERQUE, D.M.; GOES, E.S. dos R.; PRADO, O.P.P. do; RIBEIRO, R.P. Caracterização genética de gerações de tilápia Gift por meio de marcadores microssatélites. Pesquisa Agropecuária Brasileira, v.48, p.1385‑1393, 2013. DOI: 10.1590/S0100‑204X2013001000010.
RUTTEN, M.J.M.; KOMEN, H.; DEERENBERG, R.M.; SIWEK, M.; BOVENHUIS, H. Genetic characterization of four strains
of Nile tilapia (Oreochromis niloticus L.) using microsatellite markers. Animal Genetics, v.35, p.93‑97, 2004. DOI: 10.1111/j.13
65-2052.2004.01090.x.
SEUTIN, G.; WHITE, B.N.; BOAG, P.T. Preservation of avian
blood and tissue samples for DNA analyses. Canadian Journal of Zoology, v.69, p.82‑90, 1991. DOI: 10.1139/z91‑013.
SUKMANOMON, S.; KAMONRAT, W.; POOMPUANG, S.; NGUYEN, T.T.T.; BARTLEY, D.M.; MAY, B.; NA‑NAKORN, U. Genetic changes, intra‑ and inter‑specific introgression in farmed
Nile tilapia (Oreochromis niloticus) in Thailand. Aquaculture,
v.324‑325, p.44‑54, 2012a. DOI: 10.1016/j.aquaculture.2011.10.025. SUKMANOMON, S.; SENANAN, W.; KAPUSCINSKI, A.R.; NA‑NAKORN, U. Genetic diversity of feral populations of Nile
tilapia (Oreochromis niloticus) in Thailand and evidence of genetic introgression. Kasetsart Journal, v.46, p.200-216, 2012b.
VAN BERS, N.E.M.; CROOIJMANS, R.P.M.A.; GROENEN,
M.A.M.; DIBBITS, B.W.; KOMEN, J. SNP marker detection and genotyping in tilapia. Molecular Ecology Resources, v.12,
p.932‑941, 2012. DOI: 10.1111/j.1755‑0998.2012.03144.x.
VAN OOSTERHOUT, C.; HUTCHINSON, W.F.; WILLS, D.P.M.; SHIPLEY, P. MICRO‑CHECKER: software for identifying and
correcting genotyping errors in microsatellite data. Molecular Ecology Notes, v.4, p.535‑538, 2004. DOI: 10.1111/j.1471‑8286.2
004.00684.x.
VÄHÄ, J.-P.; PRIMMER, C.R. Efficiency of model‑based
Bayesian methods for detecting hybrid individuals under different
hybridization scenarios and with different numbers of loci. Molecular Ecology, v.15, p.63‑72, 2006. DOI: 10.1111/j.1365‑29 4X.2005.02773.x.