Submitted6 May 2016
Accepted 19 August 2016
Published20 September 2016
Corresponding author
Katherine A. Cleary, [email protected]
Academic editor
Sean Rogers
Additional Information and Declarations can be found on page 8
DOI10.7717/peerj.2465
Copyright
2016 Cleary et al.
Distributed under
Creative Commons CC-BY 4.0
OPEN ACCESS
Development and characterization of
fourteen novel microsatellite markers
for the chestnut short-tailed fruit bat
(Carollia castanea), and
cross-amplification to related species
Katherine A. Cleary1, Lisette P. Waits1and Paul A. Hohenlohe2
1Department of Fish and Wildlife Sciences, University of Idaho, Moscow, ID, United States
2Department of Biological Sciences, Institute of Bioinformatics and Evolutionary Studies, University of Idaho,
Moscow, ID, United States
ABSTRACT
Rapid anthropogenic land use change threatens the primary habitat of the Chestnut short-tailed bat (Carollia castanea) throughout much of its range. Information on population genetic structure can inform management strategies for this widespread frugivorous bat, and effective protection ofC. castaneawill also benefit the more than 20 mutualistic plant species of which this bat is the primary seed disperser. To facilitate un-derstanding of population genetic structure in this species, fourteen novel microsatellite markers were developed using restriction-site-associated DNA libraries and Illumina sequencing and tested on 28 individuals from 13 locations in Costa Rica. These are the first microsatellite markers developed forC. castanea. All loci were polymorphic, with number of alleles ranging from 2–11 and average observed heterozygosity of 0.631. Markers were also cross-amplified in three additional frugivorous bat species threatened by habitat loss and fragmentation: Sowell’s short-tailed bat (Carollia sowelli), Seba’s short-tailed bat (Carollia perspicillata), and the Jamaican fruit bat (Artibeus jamaicensis), and 10, 11, and 8 were polymorphic, respectively.
SubjectsConservation Biology, Evolutionary Studies, Zoology
Keywords Microsatellite,Carollia castanea, Chestnut short-tailed bat, Restriction-site-associated DNA,Carollia sowelli,Carollia perspicillata,Artibeus jamaicensis
INTRODUCTION
risk of interrupted gene flow, genetic drift, and inbreeding, which reduce genetic diversity and adaptive capacity in the face of future perturbations (Willi et al., 2007;Méndez, Tella & Godoy, 2011).
To date, only one study has used molecular markers to evaluate the impact of ongoing land use change on C. castanea. Ripperger et al. (2014) sequenced the mitochondrial d-loop of 173 C. castaneaindividuals sampled from 10 plots in continuous forest and remnant forest patches in a fragmented agricultural landscape in northern Costa Rica, and found no evidence of significant genetic structure. However, mitochondrial markers have a much slower mutation rate than nuclear DNA markers, and are thus less capable of detecting recent response to landscape change (Wang, 2010). Since forest fragmentation and agricultural expansion in tropical regions have happened very recently on an evolutionary timescale, we would expect that only neutral nuclear DNA markers with high rates of mutation such as microsatellites would already show a response to these processes. Despite the utility of microsatellite markers for evaluating population responses to recent land use change, no microsatellite loci have previously been developed forC. castanea. In fact, of the seven currently recognized species in theCarolliagenus (Velazco, 2013), microsatellite markers have only been developed for one,Carollia brevicauda(Bardeleben et al., 2007); these authors also successfully cross-amplified eight microsatellites toC. castanea.
The goal of this study was to develop the first microsatellite markers specifically for
C. castaneausing Illumina high-throughput sequencing, to fully characterize these markers using a small sample of individuals from Costa Rica, and to evaluate the transferability of these microsatellites to three other co-distributed bat species: Sowell’s short-tailed bat (Carollia sowelli), Seba’s short-tailed bat (Carollia perspicillata), andthe Jamaican fruit bat (Artibeus jamaicensis). These novel markers can be used to quantify population genetic structure, identify populations that have become genetically isolated due to habitat loss and fragmentation, and evaluate correlations between genetic diversity, gene flow, and land use in fragmented agricultural landscapes. Future studies can also use these markers to increase understanding of mating and dispersal strategies inC. castanea; preliminary evidence of female-biased dispersal has been found in this species using mitochondrial DNA markers (Ripperger et al., 2014), which is very rare in mammals (Greenwood, 1980).
MATERIALS AND METHODS
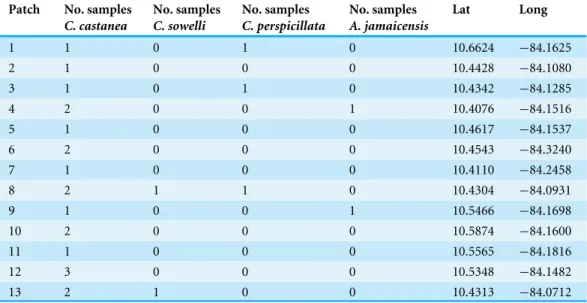
Table 1 Number of samples of each species collected from the remnant forest patches in the San Juan-La Selva biological corridor in northern Costa Rica.Latitude and longitude of each patch are given in decimal degrees.
Patch No. samples C. castanea
No. samples C. sowelli
No. samples C. perspicillata
No. samples A. jamaicensis
Lat Long
1 1 0 1 0 10.6624 −84.1625
2 1 0 0 0 10.4428 −84.1080
3 1 0 1 0 10.4342 −84.1285
4 2 0 0 1 10.4076 −84.1516
5 1 0 0 0 10.4617 −84.1537
6 2 0 0 0 10.4543 −84.3240
7 1 0 0 0 10.4110 −84.2458
8 2 1 1 0 10.4304 −84.0931
9 1 0 0 1 10.5466 −84.1698
10 2 0 0 0 10.5874 −84.1600
11 1 0 0 0 10.5565 −84.1816
12 3 0 0 0 10.5348 −84.1482
13 2 1 0 0 10.4313 −84.0712
Genomic DNA was extracted from tissue samples of three individuals using the Qiagen Blood and Tissue Kit. Libraries were prepared using a restriction-site-associated DNA approach (Etter et al., 2011). In brief, genomic DNA was digested with a restriction enzyme, and an adapter containing a 6 bp long RAD tag and both forward amplification and Illumina sequencing priming sites was ligated to the fragments. All fragments were pooled, sheared, and size selected. A second adapter was then ligated to the size selected fragments; this adapter is designed to ensure that only P1 adapter-ligated RAD tags will be amplified during the final amplification step. Final prepared libraries were run on one lane of an IlluminaR MiSeq250, which generated 3,179,284 250-bp sequences. Sequences were archived in the NCBI Sequence Read Archive (accession # SRP082144). Data was de-multiplexed and quality-cleaned using Stacks V.1.21 (Catchen et al., 2013). A total of 2,300,295 cleaned sequences were run through the program QDD V.3.1 (Meglécz et al., 2014) to identify microsatellites, filter out redundant sequences, and design primers. This process identified 10, 558 sequences containing at least one microsatellite.
All sequences were screened using strict criteria to select only perfect microsatellites with di- or tetranucleotide motifs, at least five repeats, and low alignment scores with known transposable elements. From the 656 candidate loci identified with these criteria we selected 32 high-quality loci to test for amplification. Unlabeled forward and reverse primers for these loci were synthesized through Applied Biosystems. Primers were diluted to a 10uM solution containing both forward and reverse primers, and tested on eight C. castanea
individuals from eight different remnant forest patches. Individual amplifications were performed in a 7µL reaction containing 2 µL template DNA (at 7 ng/µL), 2X Qiagen
Multiplex PCR Master Mix, 0.5X Q solution, and 0.10µL of each 10µM primer solution.
cycles of a touchdown protocol of 94◦C for 30s; 63◦C for 90 s; 72◦C for 60 s, and then 20 additional cycles of 94◦C for 30 s; 57◦C for 90 s; 72◦C for 60 s.
Amplification products were examined for polymorphism using standard gel elec-trophoresis with 3% agarose gels. Twenty loci were identified as potentially polymorphic. For these twenty loci, fluorescent labeled forward primers and unlabeled reverse primers were synthesized through Integrated DNA technologies and Applied Biosystems. Using the same amplification reactions and cycling conditions as for the previous step, these loci were amplified and amplification products were separated on an Applied Biosystems 3130xl Analyzer with LIZ500 internal size standard, and scored using GeneMapper 5 (Applied Biosystems). Fourteen of the twenty loci were identified as definitively polymorphic. These loci were multiplexed into two reactions (Table 2) and tested on 20 newC. castanea
individuals. To obtain estimates of population genetic parameters representative of the study area, we selected these individuals from thirteen different patches across the study area: the same eight remnant forest patches from the previous step, plus an additional five patches (Table 1). Cycling conditions were the same as used above for both multiplexes. Amplification products were separated on an Applied Biosystems 3130xl Analyzer with LIZ500 internal size standard, and scored using GeneMapper 5 (Applied Biosystems). To validate scoring methods, the distribution of raw allele sizes was visualized and the best bin sets for each locus were generated using Autobin v.09 (Fig. S1). All loci were tested twice using DNA from the sameC. castaneasamples to ensure reliable results.
Number of alleles per locus (NA), observed heterozygosity (HO), expected heterozygosity
(HE), and tests for departures from Hardy-Weinberg equilibrium (PHWE) were calculated
in GenAlEx 6.5 (Peakall & Smouse, 2012), and loci were screened for null alleles in CERVUS 3.0.7 (Kalinowski, Taper & Marshall, 2007). To assess baseline frequencies of each allele across the study area, GenAlEx 6.5 was used to calculate allele frequencies across all samples. Next, program STRUCTURE v 2.3.4 (Pritchard, Stephens & Donnelly, 2000) was used to test for genetic structure in the data. We chose an admixture model with correlated allele frequencies; this model is appropriate for our system because since land use change in the study area is a recent event we expected that allele frequencies in the remnant forest patches would still be fairly similar (Falush, Stephens & Pritchard, 2003). Since the samples were collected from 13 different forest patches and it is possible thatC. castaneapopulations in these patches represent 13 distinct genetic groups, we tested all values of K between one and 13. As recommended byGilbert et al. (2012), we ran the model for 100,000 generations, with a 100,000 generation burn-in, and confirmed this number of generations was adequate by checking for convergence of alpha, F, D, and log likelihood. We ran three independent replicate runs using the same model settings.
All fourteen loci were also tested for amplification and polymorphism in two individuals of Carollia sowelli, three individuals ofCarollia perspicillata, and three individuals of
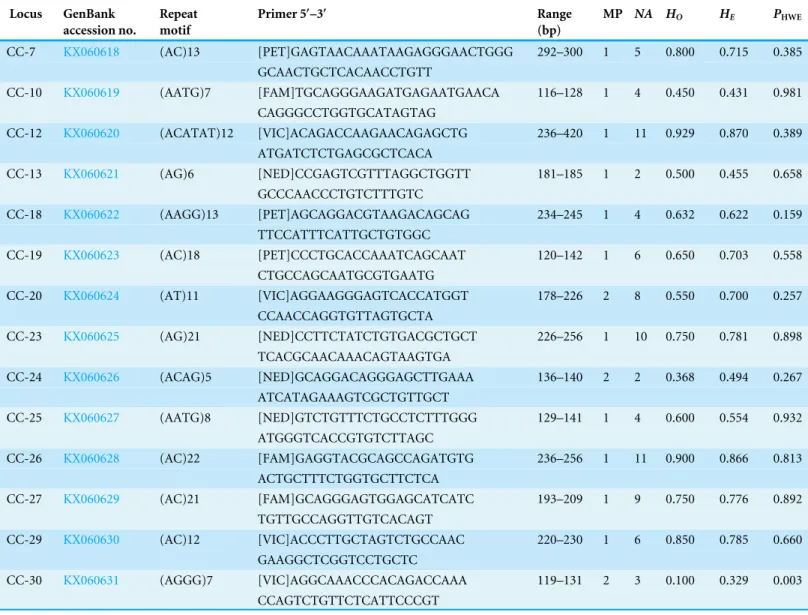
Table 2 Microsatellite loci characteristics.Microsatellite loci developed and characterized in 28 Chestnut short-tailed fruit bat (C. castanea) sam-ples from Costa Rica. Fluorescent labels attached to forward primers are in brackets.
Locus GenBank accession no.
Repeat motif
Primer 5′–3′ Range
(bp)
MP NA HO HE PHWE
CC-7 KX060618 (AC)13 [PET]GAGTAACAAATAAGAGGGAACTGGG 292–300 1 5 0.800 0.715 0.385
GCAACTGCTCACAACCTGTT
CC-10 KX060619 (AATG)7 [FAM]TGCAGGGAAGATGAGAATGAACA 116–128 1 4 0.450 0.431 0.981
CAGGGCCTGGTGCATAGTAG
CC-12 KX060620 (ACATAT)12 [VIC]ACAGACCAAGAACAGAGCTG 236–420 1 11 0.929 0.870 0.389
ATGATCTCTGAGCGCTCACA
CC-13 KX060621 (AG)6 [NED]CCGAGTCGTTTAGGCTGGTT 181–185 1 2 0.500 0.455 0.658
GCCCAACCCTGTCTTTGTC
CC-18 KX060622 (AAGG)13 [PET]AGCAGGACGTAAGACAGCAG 234–245 1 4 0.632 0.622 0.159
TTCCATTTCATTGCTGTGGC
CC-19 KX060623 (AC)18 [PET]CCCTGCACCAAATCAGCAAT 120–142 1 6 0.650 0.703 0.558
CTGCCAGCAATGCGTGAATG
CC-20 KX060624 (AT)11 [VIC]AGGAAGGGAGTCACCATGGT 178–226 2 8 0.550 0.700 0.257
CCAACCAGGTGTTAGTGCTA
CC-23 KX060625 (AG)21 [NED]CCTTCTATCTGTGACGCTGCT 226–256 1 10 0.750 0.781 0.898
TCACGCAACAAACAGTAAGTGA
CC-24 KX060626 (ACAG)5 [NED]GCAGGACAGGGAGCTTGAAA 136–140 2 2 0.368 0.494 0.267
ATCATAGAAAGTCGCTGTTGCT
CC-25 KX060627 (AATG)8 [NED]GTCTGTTTCTGCCTCTTTGGG 129–141 1 4 0.600 0.554 0.932
ATGGGTCACCGTGTCTTAGC
CC-26 KX060628 (AC)22 [FAM]GAGGTACGCAGCCAGATGTG 236–256 1 11 0.900 0.866 0.813
ACTGCTTTCTGGTGCTTCTCA
CC-27 KX060629 (AC)21 [FAM]GCAGGGAGTGGAGCATCATC 193–209 1 9 0.750 0.776 0.892
TGTTGCCAGGTTGTCACAGT
CC-29 KX060630 (AC)12 [VIC]ACCCTTGCTAGTCTGCCAAC 220–230 1 6 0.850 0.785 0.660
GAAGGCTCGGTCCTGCTC
CC-30 KX060631 (AGGG)7 [VIC]AGGCAAACCCACAGACCAAA 119–131 2 3 0.100 0.329 0.003
CCAGTCTGTTCTCATTCCCGT
Notes.
MP, Multiplex locus was assigned to; NA, Number of alleles per locus;He, Expected heterozygosity;Ho, Observed heterozygosity;PHWE, Probability the locus is in 2
Hardy-Weinberg equilibrium.
conditions were the same as used forC. castanea, but loci were tested separately to avoid the potential problem of overlapping alleles caused by shifting size ranges in the new species. Population genetic analyses were not conducted on these data due to the small sample size for each species.
RESULTS AND DISCUSSION
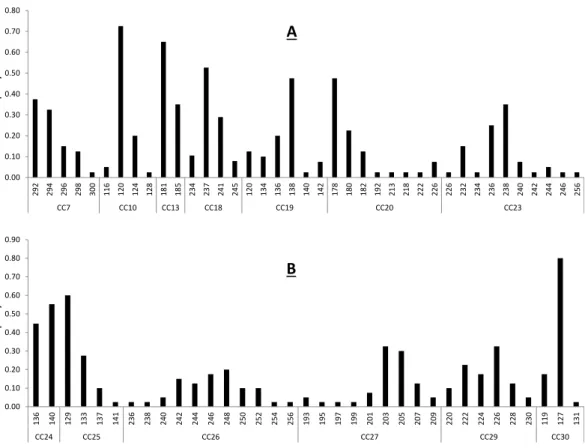
Figure 1 Baseline allele frequencies for all loci, averaged across all 20 sampled individuals ofC. cas-tanea. Loci 7–23 are shown in (A) and loci 24–30 in (B).
Primer sequences, size range of amplification product, and multiplex assignment for each of the fourteen microsatellite loci are presented inTable 2. All loci were in HWE with the exception of CC-30 (p=0.003) (Table 2), and all loci had null allele frequencies of <1% except CC-24 (14%) and CC-30 (53%). The null allele rate in CC-24 is moderate and this locus was not out of HWE, so we consider it a reliable marker for use inC. castanea. The marker CC-30 was significantly out of HWE and showed a fairly high null allele rate in these analyses, so it is not likely that this marker will prove to be reliable for use in this species. Excluding these two potentially problematic loci, remaining loci had 2–11 alleles per locus, with an average observed heterozygosity of 0.631 (±0.227) (Table 2). These levels of polymorphism and heterozygosity are similar to those found byBardeleben et al. (2007): the loci these authors cross-amplified fromC. brevicaudatoC. castaneashowed 2–18 alleles per locus, with an average observed heterozygosity of 0.69. Calculation of allele frequencies across the study area revealed that loci CC-10 and CC-30 are the only two loci where a single allele has a frequency of greater than 0.7 (Fig. 1).
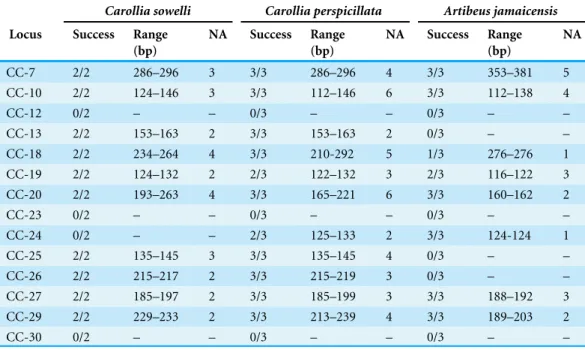
Table 3 Cross amplification in related species.Cross-species amplification success, range in base pairs, and number of alleles (NA) for novelC. castanealoci in three related Phyllostomid species.
Carollia sowelli Carollia perspicillata Artibeus jamaicensis
Locus Success Range (bp)
NA Success Range
(bp)
NA Success Range
(bp)
NA
CC-7 2/2 286–296 3 3/3 286–296 4 3/3 353–381 5
CC-10 2/2 124–146 3 3/3 112–146 6 3/3 112–138 4
CC-12 0/2 – – 0/3 – – 0/3 – –
CC-13 2/2 153–163 2 3/3 153–163 2 0/3 – –
CC-18 2/2 234–264 4 3/3 210-292 5 1/3 276–276 1
CC-19 2/2 124–132 2 2/3 122–132 3 2/3 116–122 3
CC-20 2/2 193–263 4 3/3 165–221 6 3/3 160–162 2
CC-23 0/2 – – 0/3 – – 0/3 – –
CC-24 0/2 – – 2/3 125–133 2 3/3 124-124 1
CC-25 2/2 135–145 3 3/3 135–145 4 0/3 – –
CC-26 2/2 215–217 2 3/3 215–219 3 0/3 – –
CC-27 2/2 185–197 2 3/3 185–199 3 3/3 188–192 3
CC-29 2/2 229–233 2 3/3 213–239 4 3/3 189–203 2
CC-30 0/2 – – 0/3 – – 0/3 – –
C. castaneapopulations in the same region. However, it is important to note that since the primary purpose of the present study is to develop new microsatellite markers, only a very small number of individuals were sampled (n=20). It is possible that analyzing additional individuals and individuals from more isolated forest patches could reveal significant genetic structure at the scale of the study area.
The novel microsatellite markers we have developed here will facilitate such future studies of population genetic structure inC. castanea and enable tests of whether levels of genetic diversity and gene flow in isolated populations are correlated with land use change and habitat loss and fragmentation. Understanding the impact of these processes onC. castaneais especially important since this bat is known to disperse at least 20 species of Neotropical plants (Lopez & Vaughan, 2007). IfC. castaneais able to maintain gene flow in fragmented landscapes, then these mutualistic plant species will also have a better chance of maintaining reproductive connectivity, genetic diversity, and recolonization capacity. In addition, these markers can be used to help resolve persistent taxonomic uncertainty within theCarolliagenus (Velazco, 2013). Previous studies have used mitochondrial DNA markers to identify cryptic species withinC. castanea, includingC. benkeithiin Ecuador and Panama (Solari & Baker, 2006), and an unnamed species from samples collected in Panama (Velazco, 2013). Although we are confident that all of the samples used in this study areC. castaneasince neither of these cryptic species overlaps in range with our study area, this taxonomic uncertainty should be considered when using the microsatellite markers presented here.
this species (Table 3). Eleven loci amplified and were polymorphic forC. perspicillata, and 8 loci amplified forA. jamaicensis, but only 6 were polymorphic (Table 3). Rates of polymorphism for these loci in these three species may be higher than reported here, since loci were tested in a small number of individuals of each species (n=2–3 individuals per species). In addition, allele frequencies reported inTable 3may not be representative of allele frequencies at these loci in the larger populations, since testing loci in only a few individuals can lead to ascertainment bias. Although microsatellite markers have previously been cross-amplified toC. perspicillataand directly developed forA. jamaicensis, these additional markers will add resolution and power to future studies of genetic patterns in these species.
ACKNOWLEDGEMENTS
The authors thank the landowners of Sarapiquí for allowing access to their land and Henry Lara Perez for help with species identification and sample collection. We are grateful to Cody Weinch and Tamara Max for invaluable assistance with developing RAD libraries.
ADDITIONAL INFORMATION AND DECLARATIONS
Funding
This research was supported by the NIH National Institute of General Medical Sciences under grant P30 GM103324, by the National Science Foundation under IGERT grant 0903479 and CNH grant 1313824, and by Bat Conservation International. KAC also received support from the Fulbright Student Scholarship Program to collect field data in Costa Rica. The funders had no role in study design, data collection and analysis, decision to publish, or preparation of the manuscript.
Grant Disclosures
The following grant information was disclosed by the authors: NIH National Institute of General Medical Sciences: P30 GM103324. National Science Foundation: 0903479, 1313824.
Fulbright Student Scholarship Program. Bat Conservation International.
Competing Interests
The authors declare there are no competing interests.
Author Contributions
• Katherine A. Cleary conceived and designed the experiments, performed the experiments, analyzed the data, wrote the paper, prepared figures and/or tables.
Animal Ethics
The following information was supplied relating to ethical approvals (i.e., approving body and any reference numbers):
Animal Care and Use Committee Protocol #2011-31—Ecology and Conservation Genetics of Phyllostomid Bats in the Human-Dominated Landscape of San Juan-La Selva Biological Corridor.
Field Study Permissions
The following information was supplied relating to field study approvals (i.e., approving body and any reference numbers):
Costa Rican Ministry of Energy and the Environment, Permit number: R-005-2013-OT-CONAGEBIO.
DNA Deposition
The following information was supplied regarding the deposition of DNA sequences: Sequence data is archived at NCBI Sequence Read Archive, accession #:SRP082144. Microsatellite primer sequences are archived in NCBI GenBank, accession numbers:
KX060618, KX060619, KX060620, KX060621, KX060622, KX060623, KX060624,
KX060625,KX060626,KX060627,KX060628,KX060629,KX060630,KX060631.
Data Availability
The following information was supplied regarding data availability: NCBI SRA:SRP082144.
Supplemental Information
Supplemental information for this article can be found online athttp://dx.doi.org/10.7717/ peerj.2465#supplemental-information.
REFERENCES
Bardeleben C, Campbell P, Lara M, Moore RL. 2007.Isolation of polymorphic tetranu-cleotide microsatellite markers for the silky short-tailed batCarollia brevicauda.
Molecular Ecology Notes7:63–65DOI 10.1111/j.1471-8286.2006.01525.x.
Bonaccorso FJ, Winkelmann JR, Shin D, Agrawal CI, Aslami N, Bonney C, Hsu A, Jekielek PE, Knox AK, Kopach SJ, Jennings TD, Lasky JR, Menesale SA, Richards JH, Rutland JA, Sessa AK, Zhaurova L, Kunz TH. 2006.Evidence for exploitative competition, comparative foraging behavior and roosting ecology of short-tailed fruit bats (Phyllostomidae).Biotropica39:249–256
DOI 10.1111/j.1744-7429.2006.00251.x.
Catchen J, Hohenlohe PA, Bassham S, Amores A, Cresko WA. 2013.Stacks: an analysis tool kit for population genomics.Molecular Ecology22:3124–3140
DOI 10.1111/mec.12354.
Rockman MV, eds.Molecular methods for evolutionary genetics. New York: Humana Press, 157–178.
Falush D, Stephens M, Pritchard JK. 2003.Inference of population structure: extensions to linked loci and correlated allele frequencies.Genetics164:1567–1587.
Faure PA, Daniel ER, Clare E. 2009.Wound healing in the flight membranes of big brown bats.Journal of Mammalogy90(5):1148–1156
DOI 10.1644/08-MAMM-A-332.1.
Gilbert KJ, Andrew RL, Bock DG, Franklin MT, Kane NC, Moore JS, Moyers BT, Renaut S, Rennison DJ, Veen T, Vines TH. 2012.Recommendations for utilizing and reporting population genetic analyses: the reproducibility of genetic clustering using the program structure.Molecular Ecology21(20):4925–4930
DOI 10.1111/j.1365-294X.2012.05754.x.
Greenwood PJ. 1980.Mating systems, philopatry and dispersal in birds and mammals.
Animal Behavior28:1140–1162DOI 10.1016/s0003-3472(80)80103-5.
Kalinowski ST, Taper ML, Marshall TC. 2007.Revising how the computer program CERVUS accommodates genotyping error increases success in paternity assignment.
Molecular Ecology 16:1099–1106DOI 10.1111/j.1365-294X.2007.03089.x.
Lopez JE, Vaughan C. 2007.Food niche overlap among neotropical frugivorous bats in Costa Rica.Revista de Biología Tropical55:301–313.
Meglécz E, Pech N, Gilles A, Dubut V, Hingamp P, Trilles A, Grenier R, Martin JF. 2014.QDD version 3.1: a user friendly computer program for microsatellite selection and primer design revisited: experimental validation of variables determining
genotyping success rate.Molecular Ecology Resources14:1302–1313
DOI 10.1111/1755-0998.12271.
Méndez J, Tella L, Godoy JA. 2011.Restricted gene flow and genetic drift in recently fragmented populations of an endangered steppe bird.Biological Conservation
144:2615–2622DOI 10.1016/j.biocon.2011.07.011.
Meyer CFJ, Kalko EKV, Kerth G. 2009.Small-scale fragmentation effects on local genetic diversity in two phyllostomid bats with different dispersal abilities in Panama.
Biotropica41:95–102 DOI 10.1111/j.1744-7429.2008.00443.x.
Meyer CFJ, Fründ J, Lizano WP, Kalko EKV. 2008.Ecological correlates of vulnerability to fragmentation in Neotropical bats.Journal of Applied Ecology45:381–391
DOI 10.1111/j.1365-2664.2007.01389.x.
Ortega J, Castro-Arellano I. 2001.Artibeus jamaicensis.Mammalian Species662:1–9
DOI 10.2307/3504520.
Peakall R, Smouse PE. 2012.GenAlEx 6.5: genetic analysis in Excel. Population genetic software for teaching and research—an update.Bioinformatics28:2537–2539
DOI 10.1093/bioinformatics/bts460.
Ripperger SP, Tschapka M, Kalko E, Rodríguez-Herrera B, Mayer F. 2014.Resisting habitat fragmentation, high genetic connectivity among populations of the frugiv-orous batCarollia castaneain an agricultural landscape.Agriculture, Ecosystems and Environment 185:9–15DOI 10.1016/j.agee.2013.12.006.
Solari S, Baker RJ. 2006.Mitochondrial DNA sequence, karyotypic, and morphological variation in theCarollia castaneaspecies complex (Chiroptera: Phyllostomidae) with description of a new species.Occasional Papers, Museum of Texas Tech University
254:1–16.
Thies W, Kalko EKV. 2004.Phenology of neotropical pepper plants (Piperaceae) and their association with their main dispersers, two short-tailed fruit bats, Carollia perspicillata and C. castanea (Phyllostomidae).Oikos104:362–376
DOI 10.1111/j.0030-1299.2004.12747.x.
Velazco PM. 2013.On the phylogenetic position of Carollia manu Pacheco et al., 2004 (Chiroptera: Phyllostomidae: Carolliinae).Zootaxa3718:267–276
DOI 10.11646/zootaxa.3718.3.3.
Wang IJ. 2010.Recognizing the temporal distinctions between landscape genetics and phylogeography.Molecular Ecology 19:2605–2608
DOI 10.1111/j.1365-294X.2010.04715.x.
Willi Y, Van Buskirk J, Schmid B, Fischer M. 2007.Genetic isolation of fragmented populations is exacerbated by drift and selection.Journal of Evolutionary Biology