Original
Received 26/9/2010 Accepted 8/11/2011 (005077)
1 Department of Chemical and Food Engineering, Federal University of Santa Catarina – UFSC, CEP 88040-900, Florianópolis, SC, Brazil, e-mail: [email protected] *Corresponding author
Integration of cooking and vacuum cooling of carrots in a same vessel
Integração dos processos de cozimento e resfriamento a vácuo de cenouras em um mesmo tanque
Luiz Gustavo Gonçalves RODRIGUES1, Darlene CAVALHEIRO1,
Franciny Campos SCHMIDT1, João Borges LAURINDO1*
1 Introduction
The demand for ready-to-eat foods has created a new market (REED; MCILVEEN-FARLEY; STRUGNELL, 2003). For their preparation, it is quite common the use of cooked vegetables for salads preparation, where the use of hot ingredients favors microbial growth. Therefore, the vegetables used in the composition of ready-to-eat foods and salads should be chilled immediately after cooking, to reduce the microbial growth rate (SUN; ZHENG, 2006).
In industries, cooked products are often cooled by slow air cooling, air blast, and water immersion cooling (DESMOND et al., 2000; McDONALD; SUN; KENNY, 2000). Among the new technologies for food cooling, many studies have shown the viability of using the vacuum cooling
technique for reducing the cooling time of different kind of foods such as vegetables, ready-to-eat foods, bakery products, and meat products (McDONALD; SUN, 2000; WANG; SUN, 2001; ZHENG; SUN, 2004; HUBER; LAURINDO, 2005; HUBER et al., 2006; HUBER; LAURINDO, 2006; SCHMIDT; ARAGÃO; LAURINDO, 2010). For instance, Zhang and Sun (2006b) reported different methods for cooling sliced carrots. They reported that the cooling time of 1.2 kg of carrot from 70 until 4 °C using methods such as vacuum cooling, forced air, cold fridge, and cold plates were approximately 8, 44, 193, and 215 minutes, respectively indicating the high efficiency of the vacuum cooling method. While conventional cooling methods are controlled by heat convection and heat conduction mechanisms, the vacuum cooling process is controlled by the Resumo
Para a preparação de refeições rápidas é comum o uso de legumes cozidos. A integração dos processos de cozimento e resfriamento de cenouras em um mesmo tanque pelo uso do resfriamento a vácuo é descrito neste artigo. A combinação de diferentes métodos de cozimento e resfriamento a vácuo foi investigada. O processo integrado de cozimento-resfriamento a vácuo em um mesmo tanque permitiu obter cenouras cozidas-resfriadas com temperaturas finais de 10 °C, o que é adequado à preparação de refeições rápidas com segurança. Quando o processo de cozimento-resfriamento foi realizado com amostras imersas em água de cozimento, a perda efetiva de massa foi de aproximadamente 3,6%. Quando o processo de cozimento-resfriamento foi realizado com amostras imersas em água fervente ou vapor, e o resfriamento a vácuo foi realizado após drenagem da água de cozimento, a perda de massa ficou entre 15 e 20%, ocasionando mudanças na textura dos produtos. Estes problemas podem ser compensados pela etapa de reidratação, utilizando pequena quantidade de água resfriada estéril. As propriedades de textura das amostras de cenoura reidratadas sob condição de vácuo e sob pressão atmosférica foram similares. Portanto, o processo integrado de cozimento-resfriamento a vácuo de cenouras em um mesmo tanque é uma alternativa viável para o processamento deste tipo de produto.
Palavras-chave: cenoura; cozimento; resfriamento a vácuo; processo integrado.
Abstract
Cooked vegetables are commonly used in the preparation of ready-to-eat foods. The integration of cooking and cooling of carrots and vacuum cooling in a single vessel is described in this paper. The combination of different methods of cooking and vacuum cooling was investigated. Integrated processes of cooking and vacuum cooling in a same vessel enabled obtaining cooked and cooled carrots at the final temperature of 10 °C, which is adequate for preparing ready-to-eat foods safely. When cooking and cooling steps were performed with the samples immersed in boiling water, the effective weight loss was approximately 3.6%. When the cooking step was performed with the samples in boiling water or steamed, and the vacuum cooling was applied after draining the boiling water, water loss ranged between 15 and 20%, which caused changes in the product texture. This problem can be solved with rehydration using a small amount of sterile cold water. The instrumental textural properties of carrots samples rehydrated at both vacuum and atmospheric conditions were very similar. Therefore, the integrated process of cooking and vacuum cooling of carrots in a single vessel is a feasible alternative for processing such kind of foods.
were monitored using T-type thermocouples (IOPE, model A-TX-TF-TF-R30AWG, Brazil), which were inserted into the geometric center of the carrots and connected to a data acquisition system (National Instruments, model PCI 4351, Hungary). Five repetitions were performed for each experimental condition of time-temperature. For each replicate, the weight loss and the final moisture content of the sample were determined, as well as the instrumental analysis of texture.
2.3 Integrating cooking and vacuum cooling of carrots in the same vessel
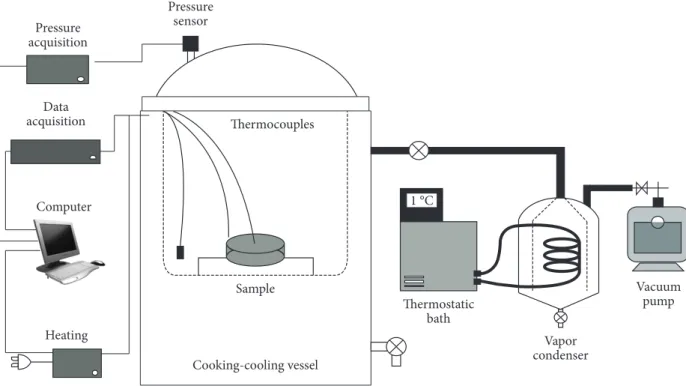
The integration of cooking and vacuum cooling of carrots in the same vessel was carried out using the experimental device presented in Figure 1. Such device consists of: a) an adapted autoclave (18 L); b) a rotary vacuum pump with nominal flow of 0.097 m/second (DVP, model LC.350, Italy); c) a steam condenser, i.e., a stainless steel container hermetically sealed, which contains a serpentine fed by cold water from a thermostatic bath (Microquimica, Model MQBMP-01, Brazil); and d) a pressure sensor (Frescale, model MPX2102, USA) connected to a data acquisition system. Like in the cooking process, the time-temperature evolution during the cooling of the samples was monitored using thermocouples inserted into the samples (geometric centers) and connected to the data acquisition system. Only samples from the experiments of steam cooking (SCk1500s) and cooking by immersion in boiling water (ICk1500s) were submitted to the integrated process of cooking-vacuum cooling. This choice was based on the results of texture, moisture content, and weight loss observed for cooked carrots samples under different time and temperature conditions (Table 1). Therefore, the following integrated processes of cooking-vacuum cooling were evaluated: 1) Cooking with steam for 1500 seconds, followed by vacuum cooling (SCk1500s + VC); 2) Cooking by water immersion for 1500 seconds, followed by drainage of cooking water and by the vacuum cooling (ICk1500s + VC); and 3) Cooking by water immersion for 1500 seconds, followed by vacuum cooling with the samples immersed in the cooking water (ICk1500s + IVC). Before starting the vacuum pump, the water used to heat the vessel in the process (1) and the cooking water in the process (2) was drained. The beginning of the vacuum cooling stage was marked by the closure of the vessel and the starting of the vacuum pump. Five repetitions were performed for each process. For each replication, the weight loss, the moisture content, and the instrumental textural properties were evaluated, as explained as follows.
evaporation of water from the product itself, which is a very efficient cooling method (SUN; ZHENG, 2006).
It is well known that vacuum cooling leads to product weight loss related to water evaporation. Procedures such as sprinkling water over the product before vacuum cooling or applying the vacuum with the product immersed in cooking water have been suggested as alternatives to reduce the weight loss during this process (APATI et al., 2006; ZHANG; SUN, 2006a, DRUMMOND; SUN, 2008; SCHMIDT; ARAGÃO; LAURINDO, 2010). Another feature of the vacuum cooling technique is the possibility of its integration with the cooking operation. In this case, the same unit can be used for both operations without needing to transfer the cooked product to another container (McDONALD; SUN, 2000, SCHMIDT; ARAGÃO; LAURINDO, 2010). Such integration reduces product handling and the total process time, and thus it is an efficient method for cooling sauces, suspensions, meat products, and other foods. However, the integration of cooking process and vacuum cooling of vegetables is an unexplored subject, which has not been found in the literature. Therefore, the objective of the present study was to evaluate process alternatives for integrating cooking and vacuum cooling of carrots in a same vessel. Different methods of cooking and integrated cooking-vacuum cooling were evaluated concerning the weight loss and texture of processed samples.
2 Materials and methods
2.1 Samples preparation
Carrots samples (Daucus carota L.) were purchased in a retail store in Florianópolis-SC, Brazil, and kept in a dark room (temperature between 20 and 25 °C) for two or three days until the completion of a group of experiments. Homogeneous cylindrical samples with height of 0.019 and 0.024 m in diameter, and mass of about 0.009 kg were extracted from peeled carrots and used in the cooking and cooling experiments. The average moisture of raw carrots was 9.9(0.6)kgwaterkgdrysolids–1 (kgw.kgds–1).
2.2 Cooking methods
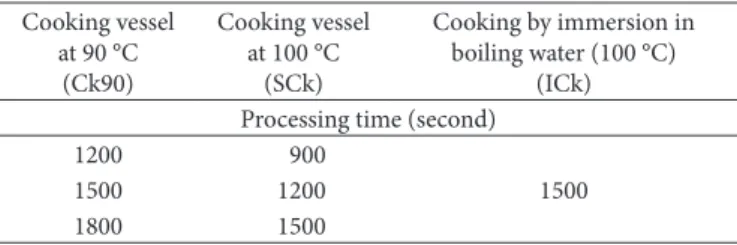
A laboratory scale autoclave (Phoenix, Model AV-18, Brazil) with a PID temperature digital controller was used to carry out the cooking of the carrot samples at atmospheric pressure. The cooking processes were performed at different times and temperatures (90 and 100 °C) using steam produced in the autoclave or by immersion in water with the temperature controlled by a thermostat. The cooking process of carrots by immersion in boiling water was also evaluated. The cooking methods used were similar to those proposed by Paulus and Saguy (1980), Zhang and Sun (2006b) and Miglio et al., (2008) for evaluating the effect of cooking variables on the mass loss, moisture content, and texture parameters of carrots. The experiments carried out for studying the influence of cooking variables on the properties of cooked carrots are showed in Table 1. Approximately 0.05 kg of carrots samples were used in each experiment. Time-temperature variations of the samples during cooking
Table 1. Cooking processes of carrot samples.
Cooking vessel at 90 °C
(Ck90)
Cooking vessel at 100 °C
(SCk)
Cooking by immersion in boiling water (100 °C)
(ICk) Processing time (second)
1200 900
1500 1200 1500
The quotient between the total sample temperature reduction during the cooling stage (∆T) and the cooling weight loss (WLCl) was denoted ηT, and it was calculated by
Equation 4.
T Cl T WL
η = ∆ (4)
The moisture contents of fresh, cooked, and cooked-cooled carrots were determined in triplicate by gravimetric method (ASSOCIATION…, 2000).
Instrumental texture analyses of samples of the cooked and cooked-cooled carrots were performed through compression tests and texture profile analysis (TPA) using a texture analyzer (Stable Micro System brand, model TA.XT2i, England). For such analysis, a load cell of 25 kg and an aluminum cylindrical probe with 0.025 m in diameter were used. After cooking and cooling, the cylindrical carrots samples were placed into plastic bags, (previously humidified to prevent moisture loss) and stored in a refrigerator (for 1 hour at 4 °C). For each sample, compression and TPA tests were performed with a strain level of 30% of its original size at an apparent compression ratio of 1 mm/second (VU et al., 2004).The higher force level observed during compression tests, for 30% of relative deformation, was used to compare the samples submitted to the different treatments. The texture parameters obtained from the TPA analysis were the hardness (N), gumminess (N), and chewiness (N) (CIVILLE; SZCZESNIAK, 1973; BOURNE, 2002). Five compression tests and TPA analysis were performed for each treatment of cooking and cooling.
2.4 Process parameters, analytical determinations, and instrumental measurement of texture
Weight loss during cooking and vacuum cooling, global weight loss, and the temperature drop per unit of percentage weight loss (ηT) were determined. The weight loss during the cooking stage (%WLCk) was computed from the difference between the mass of
cooked sample and the mass of raw sample, as given by Equation 1.
−
= 0×
0
% Ck 100
Ck
m m
WL m
(1)
Where mo is the initial mass of the raw sample (g) and mck
is the mass of the sample after cooking (g).
The weight loss during vacuum cooling (%WLCl) was evaluated
using Equation 2 from the difference between the weight of the cooked sample and the weight of the vacuum cooled sample.
% ck cl 100
Cl ck
m m
WL m
−
= × (2)
Where mck is the mass of the cooked sample (g) and mcl is the mass of the vacuum cooled sample (g).
The global weight loss during the integrated process of cooking and vacuum cooling (WLG) was determined according to Equation 3 based on the initial weight of fresh samples.
% G o cl 100
o
m m
WL m
−
= × (3)
Where mcl is the sample mass after cooling (g) and mo is the initial mass of the fresh sample (g).
−
= ×
0.38
3 374.15
2.255 10
274.15 vap
H
∆ T (7)
where T is the water saturation temperature given in °C and ∆Hvap is given in kJ.kg–1.
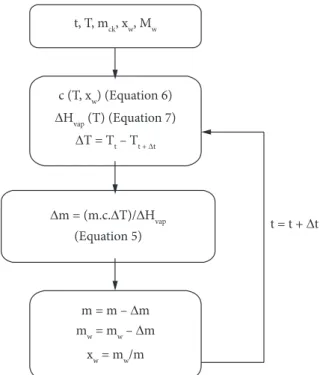
Using the algorithm (Figure 2), the value of the sample weight is updated at each iteration (m) allowing for estimating a new value of specific heat. Thus, the final sample weight can be estimated, and the final value is compared to the experimental result obtained by weighting. The algorithm was implemented using the MATLAB® software.
2.6 Recovery of mass losses by immersion of the cooled samples in small volume of sterile water
To balance the weight loss occurred during the vacuum cooling, the effect of impregnating the samples with the cold sterile water was evaluated. Cold sterile water should be used to avoid possible cross contamination. The samples impregnation was performed under atmospheric pressure and under vacuum, i.e., by vacuum impregnation (FITO et al., 1996). When the process of impregnation was performed at atmospheric pressure, the samples were transferred to a refrigerated container with water at 10 °C (ratio sample:water fixed at 1:3) and kept immersed for 300, 600, and 900 seconds (SCk1500s + SC + WI300, SCk1500s + VC + WI600 and SCk1500s + VC + WI900, respectively).The vacuum impregnation process was carried out in the same vessel used for cooking and cooling the product. For that, the samples were immersed in water at 10 °C using also a sample:water ratio of 1:3. Vacuum was applied in order to reduce the absolute pressure to 50 mbar for 300 seconds, followed by the recovery of the atmospheric pressure (SCk1500s + VC + VWI300).
After both impregnation processes, the samples were removed from the liquid, the water adhered on their surfaces was dried with a filter paper for 10 seconds, the weight gain (Equation 8) and the final moisture content were determined, and the texture tests were performed. Four replicates were done for each process.
% I I cl 100
cl
m m
WG m
−
= × (8)
Where %WGI is the relative weight gain after impregnation,
mcl is the mass of cooled sample (g), and mI is the mass of the sample after impregnation (g).
2.7 Statistical analysis
The results were evaluated by one-way ANOVA at the 95% probability level. In the case of significant effects (p < 0.05), the means were compared using the Tukey’s test.
3 Results and discussion
3.1 Cooking parameters
Table 2 presents the results of weight loss, moisture content, and maximum compression force observed for a relative deformation of 30%, and also the parameters representing the texture profile analysis (TPA) for the samples of carrots
2.5 Simulation of mass loss during vacuum cooling
A numerical simulation was performed to determine the sample weight evolution during vacuum cooling, from experimental time–temperature data, initial sample weight, and moisture content. Figure 2 presents the algorithm used to calculate the mass loss during cooling. The amount of water evaporated from the product during vacuum cooling was calculated considering the assumption that water evaporation occurs exclusively as a result of sample cooling, as given by Equation 5.
ck Cl
vap
c m T
m WL
H × × ∆ ∆ = =
∆ (5)
where ∆m or WLCl is the weight loss (kg) during vacuum cooling,
c (kJ.kg–1.K–1) is the sample specific heat that depends on its
moisture (Equation 6), mck is the sample mass before cooling
(kg), ΔT is the decrease of sample temperature during cooling (°C), and ∆Hvap (kJ.kg–1) is the latent heat of evaporation of water,
which depends on the saturation temperature (Equation 7) (WANG; SUN, 2001; HUBER; SOARES, LAURINDO, 2003).
The specific heat of the cooked carrot was estimated using Equation 6 (SINGH; HELDMAN, 2001).
=1, 424 c+1, 549 p+1,675 f+0,837 a+4,187 w
c X X X X X (6)
Where c, given in kJ.kg–1.K–1, x is the mass fraction and
the subscripts c, p, f, a, and w are related to carbohydrates, proteins, lipids, ash, and water, respectively. These mass fractions were obtained from the Brazilian Table of Food Composition (UNIVERSIDADE…, 2006). The latent heat of vaporization of water as a function of the temperature was determined by the empirical model given by Equation 7 (DOSTÁL et al., 1999):
the samples temperature. The homogeneity of the temperatures observed at the different samples indicates that water evaporation occurs in the same way in all samples within the vacuum chamber. The lowest pressure reached at the end of the vacuum cooling process was approximately 14 mbar resulting in temperatures of approximately 10 °C for all samples. Next, the ambient pressure was restored to finish the experiment. The vacuum cooling process followed the water saturation curve very closely, i.e., for each dynamic value of pressure, the measured temperature was the saturation temperature. Schmidt, Aragão and Laurindo (2010) reported similar results for vacuum cooling of pre-cooked chicken meat. These authors explained these results based on the isenthalpic behavior of vacuum cooling, i.e., the sample cooling is achieved only by water evaporation from the sample itself. The small deviations from this behavior can be explained by the radiation and conduction heat transfers that occur from the walls of the autoclave to the samples during the vacuum cooling.
The cooling rates of the samples treated by the processes SCk1500s + VC and ICk1500s + VC were similar because the same rate of evacuation was applied to both processes. For these processes, the time elapsed for the temperature variation of 73.5 °C (at the samples geometric centers) was approximately 735 seconds. On the other hand, for the ICk1500s + IVC process, the time required for the same temperature drop was about 2200 seconds, which is 2.9 times longer than the cooling times observed for the SCk + VC and ICk + VC processes. Such a longer cooling time is due to the larger mass to be cooled (water + carrot samples).
The behavior of the Tair-steam during vacuum cooling is explained by the effects of radiation heat transfer from the autoclave walls to the thermocouple.
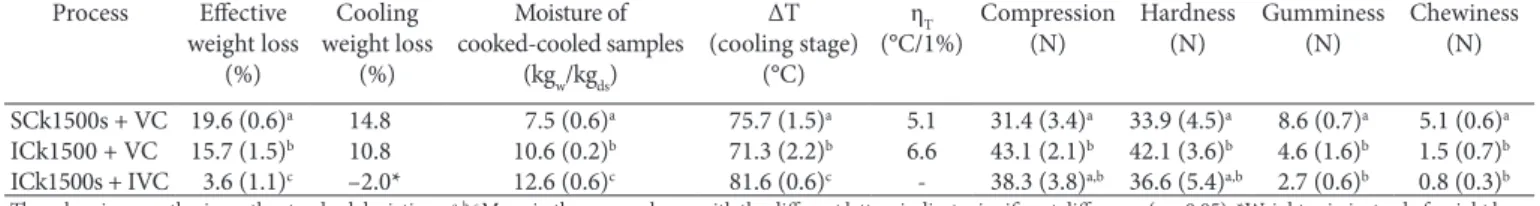
3.3 Characteristics of samples treated by the cooking and vacuum cooling integrated processes
Table 3 presents the results of the effective weight loss (with respect to the mass of the fresh sample), the weight loss cooked by different methods. The highest water losses during
cooking were observed for the samples treated by the process coded as SCk1500s and ICk1500s. Therefore, longer times and higher temperatures tend to lead to larger samples mass losses. In general, the maximum compression force observed for a relative deformation of 30%, and the TPA variables (hardness, gumminess and chewiness) decreased with the increase of time and temperature of cooking (Table 2). According to Mittal (1994), the major change caused by thermal processing is in the product texture due to the breakdown of the cellular material. Vegetables become softer when heated, in part due to the loss of turgor, but also due to complex chemical changes in the polysaccharides of cell wall matrix. The tissue cells are generally walled and cemented together by pectic substances in the middle lamella.
Only steam cooked samples (SCk1500s) and those cooked by immersion in boiling water (ICk1500s) were submitted to the integrated process of cooking-vacuum cooling, as explained before. The results of these experiments are presented in the following section.
3.2 Pressure and temperature profiles during cooking and vacuum cooling processes
Temperature and pressure profiles from the different integrated processes of cooking-vacuum cooling of carrots are shown in Figure 3 (SCk1500s + VC, SCk1500s + VC and SCk1500s + IVC). It is also shown the evolutions of the temperatures of the air-vapor mixture (Tair-steam) and of cooking water (Twater) inside the autoclave during the steps of cooking and vacuum cooling. The increase in temperature registered by the thermocouple used for measuring the temperature of the mixture air-steam inside the autoclave (Tair-steam) during the vacuum cooling step can be explained by the effects of radiation heat transfer from the autoclave walls to the thermocouple.
After the cooking process, with subsequent drainage of cooking water from the autoclave, the vacuum system was switched on causing a quick and homogeneous reduction of
Table 2. Properties of carrots subjected to different cooking processes.
Process Cooking weight loss (%)
Moisture (kgw/kgds)
Compression (N)
Hardness (N)
Gumminess (N)
Chewiness (N) Ck1200s,90 3.0 (0.7)a 11.8 (0.3)a 122.3 (13.6)a 124.6 (12.0)a 19.6 (4.6)a 11.6 (2.7)a
Ck1500s,90 4.0 (0.8)a 10.9 (0.1)b 91.3 (6.3)b 89.5 (4.3)b 14.1 (2.6)a,b 8.5 (1.9)b
Ck1800s,90 4.1 (0.5)a 10.7 (0.2)b 72.6 (5.8)c 70.4 (9.5)c 9.3 (1.5)c 6.0 (1.3)c
SCk900s 4.0 (1.5)a,b 10.5 (0.6)b 82.4 (8.3)b,c 77.5 (8.9)c 12.6 (1.6)b 7.2 (1.0)b,c
SCk1200s 5.0 (1.0)b 10.1 (0.1)b 50.1 (3.8)d 48.6 (4.5)d 7.1 (0.9)d 4.1 (0.5)d
SCk1500s 5.6 (0.7)b 9.5 (0.6)c 41.2 (10.7)e 37.4 (6.6)e 6.0 (1.1)d 3.2 (1.0)d
ICk1500s 5.5 (0.4b) 11.0 (1.0)a,b 43.3 (3.8)e 42.9 (5.5)e 9.4 (0.7)c 6.0 (0.7)c a b,c,d,eMean in the same column with the different letters indicate significant difference (p < 0,05). The values in parenthesis are the standard deviations.
Table 3. Parameters evaluated in the integrated processes of cooking and vacuum cooling.
Process Effective weight loss
(%)
Cooling weight loss
(%)
Moisture of cooked-cooled samples
(kgw/kgds)
∆T (cooling stage)
(°C)
ηT
(°C/1%)
Compression (N)
Hardness (N)
Gumminess (N)
Chewiness (N)
SCk1500s + VC 19.6 (0.6)a 14.8 7.5 (0.6)a 75.7 (1.5)a 5.1 31.4 (3.4)a 33.9 (4.5)a 8.6 (0.7)a 5.1 (0.6)a
ICk1500 + VC 15.7 (1.5)b 10.8 10.6 (0.2)b 71.3 (2.2)b 6.6 43.1 (2.1)b 42.1 (3.6)b 4.6 (1.6)b 1.5 (0.7)b
ICk1500s + IVC 3.6 (1.1)c –2.0* 12.6 (0.6)c 81.6 (0.6)c - 38.3 (3.8)a,b 36.6 (5.4)a,b 2.7 (0.6)b 0.8 (0.3)b
observed during the cooling stage, the final moisture content (after cooking and cooling), and the temperature reduction for each 1% of weight loss, ηT, expressed in °C/1%. This table also shows the values of the maximum force observed during the compression and the parameters of TPA analysis for samples of carrot submitted to vacuum cooling after cooking (SCk1500s and ICK1500s).
The three processes integrating cooking and vacuum cooling (SCk1500s + VC, ICK1500s + VC and ICK1500s + IVC) showed significant differences (p < 0.05) with respect to effective weight loss observed in the carrot samples. The process coded as SCk1500s + VC showed a greater effective mass loss (19.6%) when compared with the ICk1500s + VC and ICk1500s + IVC processes. The results presented in Table 3 show that the effective mass losses for the whole processes of cooking-vacuum cooling and during the step of vacuum cooling are smaller for the samples cooked in boiling water. This can be explained by the water that remains adhered to the samples surfaces after cooking, which reduces the effective mass loss during vacuum cooling.
In the process ICK1500s + IVC, a mass gain (water gain) of 2% was observed in the step of vacuum cooling instead of the weight loss found in the processes SCk1500s + VC and ICK1500s + VC. This mass gain during immersion vacuum cooling compensated the mass loss during cooking (ICk1500s) and is due to the water uptake by the sample after the recovery of the atmospheric pressure at the end of the vacuum cooling process. This water uptake is called vacuum impregnation and is explained by the hydrodynamic mechanism resulting from the macroscopic pressure gradients (FITO et al., 1996, LAURINDO et al., 2007, SCHMIDT; CARCIOFI; LAURINDO, 2008).
The final values of moisture content of cooked and cooled carrots presented in Table 3 show significant differences (p < 0.05) among the three integrated processes of cooking-vacuum cooling (SCk1500s + VC, ICK1500s + VC, and ICK1500s + IVC). As expected, the moisture content of samples submitted to the process ICk1500s + IVC was higher than the value found when the samples were cooled by vacuum applied after draining the cooking water.
The ηT values quantify the efficiency of the cooling process and were calculated from the temperature drop between the beginning and the end of the vacuum cooling process and from the weight loss occurred during this process. The value of ηT for the process ICk1500s + IVC was not calculated because in this case water gain was observed rather than water loss. The literature has reported that for many horticultural products, a weight loss of 1% result in 5-5.6 °C of temperature drop (SUN, 2000).
Zhang and Sun (2006b) reported results of vacuum cooling carried out with samples of 1.2 kg of sliced cooked carrots, (5 mm thick and 25-45 mm in diameter). They reported mass loss of 7.8% for a temperature reduction of 66 °C (from 70 to 4 °C), which implies a reduction of 8.5 °C for every 1% of sample water loss. It was reported that in the process of vacuum cooling used by these authors there was the addition
Figure 3. Temperature profiles for three samples of carrots during the integrated cooking and vacuum cooling processes. a) vapor cooking followed by vacuum cooling (SCk1500s + VC); b) water immersion cooking followed by the draining of the cooking water and vacuum cooling (ICk1500s + VC); and c) water immersion cooking followed by vacuum cooling with the product immerse in the cooking water (ICk1500s + IVC).
a
b
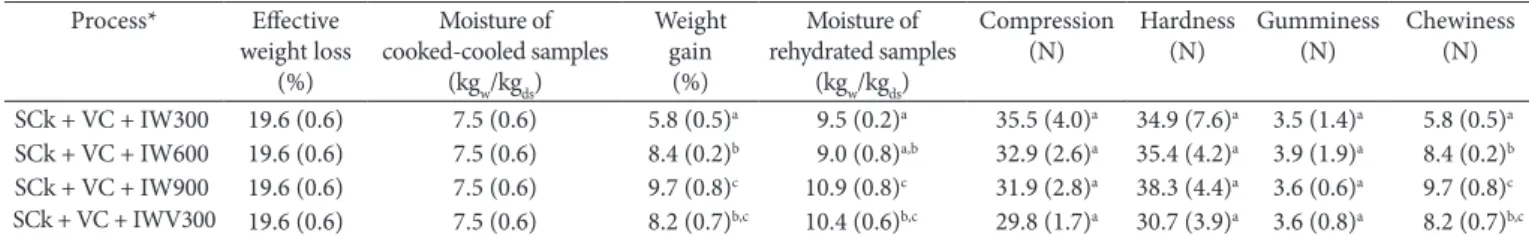
possible cross contamination) or by vacuum impregnation was studied with the goal of recovering the water evaporated during vacuum cooling. Table 5 presents the water gain by cooked-and-cooled samples after soaking in water for 300, 600 and 900 seconds and by vacuum impregnation (immersion in water under vacuum, P = 50 mbar, for 300 seconds, followed by the recovery of atmospheric pressure). The weight gain varied between 5.8 and 9.7% with respect to the mass of the samples before immersion (cooked-and-cooled samples) (Table 5). The moisture content of the samples rehydrated by the two processes varied from 9.0to 10.9 kgw.kgds–1, and it was close
to the moisture content of the samples after cooking (Table 2). It was also observed that the vacuum impregnation process increased the carrot rehydration in comparison with the simple water immersion.
The texture parameters (higher force observed during compression, hardness, gumminess, and chewiness) given in Table 5 were similar indicating no significant differences (p < 0.05) between samples submitted to both rehydration processes. It was observed that the texture parameters of rehydrated samples were not very different from those of vacuum-cooled samples (SCk1500s + VC). Thus, cooked-and-cooled samples can be easily rehydrated by soaking in small amount of water, procedure that did not change significantly their instrumental texture parameters. However, sensory analysis should be performed for supporting a decision about the need for a rehydration step.
4 Conclusions
Cooking process variables need to be carefully controlled because longer times and higher temperatures during cooking cause larger weight losses and important changes in the carrot hardness. The integrated process ICk1500s + IVC leads to longer cooling time than that of the vacuum cooling performed after the drainage of the cooking water, but it provides water gain instead of water loss. Furthermore, the weight loss occurred during vacuum cooling after drainage can be compensated by a rehydration step by immersing cooled samples in a small amount of sterile cold water. Therefore, different ways of of 100 mL of water before the cooling step in order to reduce
the effective mass loss during vacuum cooling. The authors also reported that the mass loss observed for vacuum cooling of cooked carrots without water sprinkling was around 10%. The texture parameters (higher force observed during compression, hardness, gumminess, and chewiness) observed for the cooled samples (processes SCk15600s and ICk1500s only) were similar to those found for the cooked-and-cooled samples (Tables 2 and 3). Samples cooled by vacuum were subjected to a further heat treatment because they remained in the autoclave for approximately 120 seconds during the drainage of the water before the vacuum cooling application. On the other hand, to determine the properties of cooked samples, they were removed from the autoclave immediately after the cooking process. These differences on the procedures could lead to the differences observed on the texture properties.
3.4 Simulation of weight loss during vacuum cooling of cooked carrots at different conditions
The numerical simulation based on the algorithm illustrated in Figure 2 and on the equations 5, 6, and 7 was able to predict satisfactorily the weight loss of cooked carrot samples during vacuum cooling (Table 4). For the ICk1500s + VC process, the difference between numerical and experimental results was only 2.7%. However, for the SCk1500s + VC process, the simulation underestimated by 19.6% the weight loss of mass because both heat transfer by radiation and conduction from the autoclave walls to the samples were not considered in the mathematical model. Furthermore, mass losses before and after cooling and leaching of small fragments of sample are other factors that could explain those differences.
3.5 Recovery of the lost water by immersion of the cooled samples in small volumes of sterile water
Typically, cooked carrots are used in the formulation of ready-to-eat foods or in catering services. For these purposes, the product must have good sensory properties including good texture characteristics. Therefore, product rehydration by simple immersion in a small amount of cooled sterile water (to avoid
Table 4. Experimental and simulated weight losses for samples of carrots subjected to vacuum cooling process.
Process Experimental weight loss (g.100 g–1) Simulated weight loss (g.100 g–1) Error [|(Exp-Pred)/Exp|]×100 (%)
SCk1500s + VC 14.8 11.9 19.6
ICk1500s + VC 10.8 11.1 2.7
Table 5. Influence of rehydration of cooked-and-cooled carrot samples by water immersion and by vacuum impregnation.
Process* Effective weight loss
(%)
Moisture of cooked-cooled samples
(kgw/kgds)
Weight gain
(%)
Moisture of rehydrated samples
(kgw/kgds)
Compression (N)
Hardness (N)
Gumminess (N)
Chewiness (N)
SCk + VC + IW300 19.6 (0.6) 7.5 (0.6) 5.8 (0.5)a 9.5 (0.2)a 35.5 (4.0)a 34.9 (7.6)a 3.5 (1.4)a 5.8 (0.5)a
SCk + VC + IW600 19.6 (0.6) 7.5 (0.6) 8.4 (0.2)b 9.0 (0.8)a,b 32.9 (2.6)a 35.4 (4.2)a 3.9 (1.9)a 8.4 (0.2)b
SCk + VC + IW900 19.6 (0.6) 7.5 (0.6) 9.7 (0.8)c 10.9 (0.8)c 31.9 (2.8)a 38.3 (4.4)a 3.6 (0.6)a 9.7 (0.8)c
SCk + VC + IWV300 19.6 (0.6) 7.5 (0.6) 8.2 (0.7)b,c 10.4 (0.6)b,c 29.8 (1.7)a 30.7 (3.9)a 3.6 (0.8)a 8.2 (0.7)b,c
The values in parenthesis are the standard deviations. a,b,cMean in the same column with the different letters indicate significant difference (p < 0,05). *All processes SCk, are steam
MCDONALD, K.; SUN, D-W.; KENNY, T. Comparison of the quality of cooked beef products cooled by vacuum and by conventional cooling. Lebensmittel-Wissenschaft und-Technologie, v. 33, p. 21-29, 2000.
MIGLIO, C. et al. Effects of different cooking methods on nutritional and physicochemical characteristics of selected vegetables. Journal of Agricultural and Food Chemistry, v. 56, p. 139-47, 2008. PMid:18069785. http://dx.doi.org/10.1021/jf072304b
MITTAL, G. S. Thermal softening of potatoes and carrots.
L eb ensmittel-Wiss ens chaft und-Te chnol o g i e, v. 27, p. 253-258, 1994.
PAULUS, K.; SAGUY, I. Effect of heat treatment on the quality of cooked carrots. Journal of Food Science, v. 45, p. 239-245, 1980. http://dx.doi.org/10.1111/j.1365-2621.1980.tb02585.x
REED, Z.; MCILVEEN-FARLEY, H.; STRUGNELL, C. Factors affecting consumer acceptance of chilled ready meals on the island of Ireland. International Journal of Consumer Studies, v. 27, n. 1, p. 2-10, 2003. http://dx.doi.org/10.1046/j.1470-6431.2003.00281.x SCHMIDT, F. C.; CARCIOFI, B. A. M.; LAURINDO, J. B. Efeito da
impregnação a vácuo na transferência de massa durante o processo de salga de cortes de peito de frango. Ciência e Tecnologia de Alimentos, v. 28, p. 366-372, 2008. http://dx.doi.org/10.1590/ S0101-20612008000200015
SCHMIDT, F. C.; ARAGÃO, G. M. F.; LAURINDO, J. B. Integrated cooking and vacuum cooling of chicken breast cuts in a single vessel.
Journal of Food Engineering, v. 100, p. 219-224, 2010. http://dx.doi. org/10.1016/j.jfoodeng.2010.04.002
SINGH, R. P.; HELDMAN, D. R. Introduction to food engineering. London: Academic Press, 2001.
SUN, D.-W. Experimental research on vacuum rapid cooling of vegetables. In: Advances in the refrigeration systems, food technologies and cold chain. Paris: International Institute of Refrigeration, 2000. p. 342-347
SUN, D-W.; ZHENG, L. Vacuum cooling technology for the agri-food industry: past, present and future. Journal of Food Engineering, v. 77, p. 203-214, 2006. http://dx.doi.org/10.1016/j. jfoodeng.2005.06.023
UNIVERSIDADE ESTADUAL DE CAMPINAS - UNICAMP. Brazilian table of food composition - TACO. Versão 2. 2. ed. Campinas: UNICAMP/NEPA, 2006. Disponível em: <http://www.unicamp.br/ nepa/taco/contar/taco_versao2.pdf >. Acesso em: oct. 2009.
VU, T. S. et al. Effect of preheating on thermal degradation kinetics of carrot texture. Innovative Food Science and Emerging Technologies, v. 5, p. 37-44, 2004. http://dx.doi.org/10.1016/j. ifset.2003.08.005
WANG, L.; SUN, D-W. Rapid cooling of porous and moisture foods by using vacuum cooling technology. Trends in Food Science & Technology, v. 12, p. 174-184, 2001. PMid:21299575. http://dx.doi. org/10.1016/S0924-2244(01)00077-2
ZHANG, Z.; SUN, D-W. Effects of cooling methods on the cooling efficiency and quality of cooked rice. Journal of Food Engineering, v. 77, p. 269-274, 2006a. http://dx.doi.org/10.1016/j. jfoodeng.2005.06.029
ZHANG, Z.; SUN, D-W. Effect of cooling methods on the cooling efficiencies and qualities of cooked broccoli and carrot slices.
Journal of Food Engineering, v. 77, p. 320-326, 2006b. http://dx.doi. org/10.1016/j.jfoodeng.2005.06.038
ZHENG, L.; SUN, D-W. Vacuum cooling for the food industry: a review of recent research advances. Trends in Food Science & Technology, v. 15, p. 555-568, 2004. PMid:21299575. http://dx.doi. org/10.1016/j.tifs.2004.09.002
integrating the processes of cooking and cooling can be used according to the product texture requirements. It can be said that the integrated process of cooking and vacuum cooling of carrots in a single vessel is a viable alternative for the processing of such foods, avoiding the excessive manipulation of the product and reducing the possibilities of cross contamination of cooked products.
Acknowledgement
The authors acknowledge CNPq/Brazil and CAPES/Brazil for the financial support.
References
ASSOCIATION OF OFFICIAL ANALYTICAL CHEMISTS - AOAC.
Official Methods of Analysis. 17th ed. Washington : AOAC, 2000. APATI, G. P.; FURLAN, S. A.; LAURINDO, J. B. Resfriamento a vácuo de cogumelos comestíveis Peurotus ostreatus. Brazilian Journal of Food Technology (ITAL), v. 9, n. 4, p. 1-10, 2006.
B OURNE, M. Fo o d texture and v is cosity-concept and measurement. 2nd ed. London: Academic Press, 2002.
CIVILLE, G. V.; SZCZESNIAK, A. S. Guidelines to training a texture profile panel. Journal of Texture Studies, v. 4, p. 204-223, 1973. http://dx.doi.org/10.1111/j.1745-4603.1973.tb00665.x
DESMOND, E. M. et al. Effect of rapid and conventional cooling methods on the quality of cooked ham joints. Meat Science, v. 56, p. 271-277, 2000. http://dx.doi.org/10.1016/S0309-1740(00)00052-8 DOSTÁL, M. et al. Vacuum cooling of solid foods. Journal of Food
Sciences, v. 17, p. 103-112, 1999.
DRUMMOND, L.; SUN, D.-W. Immersion vacuum cooling of cooked beef – safety and process considerations regarding beef joint size.
Meat Science, v. 80, p. 738-743, 2008. PMid:22063591. http://dx.doi. org/10.1016/j.meatsci.2008.03.014
FITO, P. et al. Coupling of Hydrodynamic Mechanism and deformation-relaxation phenomena during vacuum treatments in solid porous food-liquid systems. Journal of Food Engineering, v. 27, p. 229-240, 1996. http://dx.doi.org/10.1016/0260-8774(95)00005-4 HUBER, E.; SOARES, L. P.; LAURINDO, J. B. Vacuum cooling of
pre-cooked mussels for small scale. Alimentos e Nutrição, v. 14, n. 2, p. 165-170, 2003.
HUBER, E.; LAURINDO, J. B. Weight loss of precooked chicken breast cooled by vacuum application. Journal of Food Process Engineering, v. 28, p. 299-312, 2005. http://dx.doi.org/10.1111/ j.1745-4530.2005.00419.x
HUBER, E. et al. Vacuum Cooling of Cooked Mussels (Perna perna).
Food Science and Technology International, v. 12, p. 19-25, 2006. http://dx.doi.org/10.1177/1082013206062387
HUBER, E.; LAURINDO, J. B. Determination of mass transfer coefficients during the vacuum cooling of pre-cooked meat cuts. International Journal of Food Properties, p. 9, n. 2, p. 287-298, 2006.
LAURINDO, J. B. et al. Experimental determination of the dynamics of vacuum impregnation of apples. Journal of Food Science, v. 72, p. 470-475, 2007. PMid:17995607. http://dx.doi.org/10.1111/j.1750-3841.2007.00512.x
Nomenclature
Ck1200s90 Cooking temperature of 90 °C for 1200 seconds
Ck1500s90 Cooking temperature of 90 °C for 1500 seconds
Ck1800s90 Cooking temperature of 90 °C for 1800 seconds
SCk900s Steam cooking (100 °C) for 900 seconds
SCk1200s Steam cooking (100 °C) for 1200 seconds
SCk1500s Steam cooking (100 °C) for 1500 seconds