http://dx.doi.org/10.1590/2317-1545v39n4181021
Temperature and seed moisture content affect electrical
conductivity test in pea seeds
1Lara Bernardes da Silva Ferreira
2, Nayara Alves Fernandes
2,
Luan Costa de Aquino
2, Anderson Rodrigo da Silva
2,
Warley Marcos Nascimento
3, Érica Fernandes Leão-Araújo
2*ABSTRACT – Several factors affect the electrical conductivity test efficiency, with emphasis given to the initial water content and the temperature during imbibition. This study aimed to evaluate the effect of the initial water content of pea seeds and the temperature on the electrical conductivity test efficiency. Six lots of ‘Mikado’ pea were used, which were previously tested for initial characterization. In the first trial, based on the initial value of the samples, the seed moisture content was adjusted to 9, 11, 13 and 15% and then the seeds were submitted to the electrical conductivity test. In the second trial, the water for seed imbibition was kept for 24 hours at 10, 15, 20, 25 and 30 ºC, and after that time the seeds were added and soaked for other 24 hours at the temperatures already mentioned. It was observed that initial seed moisture content and water temperature during imbibition influenced the results of the electrical conductivity test. This test should be carried out with distilled water, previously maintained for 24 hours at 25 °C for temperature stabilization. Then, the seeds with seed moisture content between 11 and 15% should be put to soak at 25 °C, and maintained at this temperature for 24 hours.
Index terms: Pisum sativum, imbibition, exudates, vigor.
Temperatura e teor de água afetam o teste de condutividade elétrica em
sementes de ervilha
RESUMO – Vários fatores interferem na eficiência do teste de condutividade elétrica, com destaque para teor de água inicial e temperatura durante a embebição. Este trabalho objetivou avaliar o efeito do teor de água inicial das sementes de ervilha e da temperatura na eficiência do teste de condutividade elétrica. Utilizaram-se seis lotes de ervilha ‘Mikado’ que foram submetidos a testes para caracterização inicial. No primeiro ensaio, baseado na umidade inicial das amostras, foi ajustado o teor de água para 9, 11, 13 e 15% e, posteriormente, foram submetidas ao teste de condutividade elétrica. No segundo ensaio, a água para embebição das sementes foi mantida por 24 horas a 10, 15, 20, 25 e 30 °C e, após este período, adicionou-se às sementes e foram colocadas para embeber por mais 24 horas nas referidas temperaturas. Observou-se que teor de água inicial e temperatura da água durante a embebição influenciaram nos resultados do teste de condutividade elétrica. Este teste deve ser realizado com água destilada previamente mantida por 24 horas a 25 °C para estabilização da temperatura, posteriormente as sementes, com teor de água entre 11 e 15%, colocadas para embeber na temperatura de 25 °C, mantidas nesta temperatura por 24 horas.
Termos para indexação: Pisum sativum, embebição, exsudatos, vigor.
1Submitted on 06/05/2017. Accepted for publication on 08/24/2017. 2Departamento de Agronomia, Instituto Federal Goiano, 75790-000 – Urutaí, GO, Brasil.
3Embrapa Hortaliças, Caixa Postal 280, 70275-970 – Brasília, DF, Brasil. *Corresponding author <[email protected]>
Introduction
The seed is one of the most important agricultural inputs. It is responsible for bringing to the rural areas the advances of genetics and plant breeding. In addition, it guarantees the
The physiological quality of the seeds is usually evaluated by germination and vigor tests, which, in addition to inform the maximum potential of a lot, may generate data about its performance under stress conditions. According to Vieira and Krzyzanowski (1999), there are several vigor tests with potential usage for the various cultivated species. Among them, the electrical conductivity test stands out due to its simplicity, fast results and low cost.
Despite the expansion of pea crops in the country in recent years, Brazil’s share in global pea market is still inexpressive, with a variation in cultivated areas and production over the years. Thus, it is extremely important to improve the production technology and/or favor this species production in the country through incentives (Nascimento et al., 2016).
In order to supply the pea processing industry with inputs, the uniformity of the seasons and duration of flowering and seeds maturation are necessary to obtain an adequate product. Therefore, the use of vigor tests capable of detecting significant differences in physiological quality in alike germination lots is essential for the seed production program (Mielezrski and Marcos-Filho, 2012).
The electrical conductivity test is recommended to evaluate the vigor of pea seeds and it is also suggested for soybean seeds (AOSA, 2002). Studies have demonstrated the efficiency of the electrical conductivity test for peanut, corn, soybean, sesame and other horticultural, fruit and forest species (Barbosa et al., 2012b; Fessel et al., 2006; Barbosa et al., 2013; Torres et al., 2009; Alves et al., 2009; Barbosa et al., 2012a; Delazeri et al., 2016). For peas, Machado et al. (2011) demonstrated the efficiency of this test to classify the vigor of brown-seed coat
seeds (Pisum sativum subsp. arvense).
Among the factors that may influence the accuracy of the electrical conductivity test are the seed age, genotype, temperature, imbibition period and initial seed moisture content (Vieira, 1994). Among these, the influence of the initial seed moisture content is reported for species such as soybean, pea, common beans and peanut (Vieira et al., 2002; Baalbaki et al., 2009; Leão et al., 2012; Barbosa et al., 2012b). In order to compare the lots in the electrical conductivity test, it is generally recommended that the initial seed moisture content should be between 10 and 15% (Loeffler et al., 1988).
The storage temperature is another factor that influences the exudates release in the imbibition solution of the electrical conductivity test. Fessel et al. (2010) observed that the deterioration of soybean seeds at low temperatures does not seem to be directly related to the integrity loss of cell membranes, what alters the test capacity to indicate the physiological potential of the seeds.
Panobianco et al. (2007) studied the test in pea seeds
and verified that the electrical conductivity was not a good indicator of the intensity of the deterioration process in seeds stored at low temperatures. When Leão et al. (2012) evaluated the temperature during seed imbibition, it was observed that the classification of common bean seed lots was influenced by the temperature of the imbibition solution, and the electrical conductivity values raised as the temperature increased.
The aim of this study was to elucidate the effect of the initial pea seed moisture content and the imbibition temperature on the results of the electrical conductivity test, and its capacity to differentiate seed lots in terms of vigor.
Material and Methods
The study was carried out in the Laboratory of Seeds at the Instituto Federal de Educação, Ciência e Tecnologia Goiano, Urutaí Campus, Goiás, Brazil. Two trials were performed using seeds from six lots of ‘Mikado’ cultivar, 2014/15 crop, obtained from Embrapa Hortaliças, Brasília, DF. This cultivar is originally from Netherlands and has a life cycle of approximately 110 days. It is highly productive and presents great industrial qualities, such as size, good rehydration capacity and low percentage of grain discoloration (Nascimento et al., 2016).
The seeds were kept in paper bags inside cold rooms (16 ± 2 °C; 60 ± 10% Relative Humidity) for 15 days to reach hygroscopic equilibrium. Initially, the lots were submitted to the initial characterization, according to the following determinations:
Seed moisture content: determined by the oven method at
105 ± 3 °C for 24 hours. Two replications with approximately 5 grams from each lot were used. They were weighed, and the data expressed as wet basis percentage (Brasil, 2009).
Germination: four replications with 50 seeds of each lot were
distributed on rolls of paper towel moistened with the equivalent of 2.5 times the dry paper mass of deionized water. The rolls were kept in germinator at 20 °C. The evaluation was performed on the eighth day after sowing, by counting the normal, abnormal seedlings and the dead seeds, according to the criteria established by the Rules for Seed Testing (Brasil, 2009). The results were expressed in percentage of normal seedlings.
Germination first count: carried out along with the
germination test, by counting the normal seedlings on the fifth day after sowing. The results were expressed in percentage of normal seedlings.
Emergence in sand: four replications of 50 seeds of each
done daily as needed. The evaluations were carried out for 14 days, and only seedlings that presented epicotyl bigger than 1 cm were considered to determine the percentage of normal seedlings emerged.
The first trial was based on the initial seed moisture content and weight of the samples, and each lot had its seed moisture content adjusted to 9, 11, 13 and 15%. For that, it was adopted the method of soaking in humid atmosphere. The seeds were put to imbibition arranged in a single layer over a stainless steel screen suspended inside gerboxes (11 × 11 × 3.5 cm) containing 40 mL of water. The boxes were kept in a laboratory natural environment. The seed moisture content was monitored by successive weighings to determine the water gain. The final mass of the samples, corresponding to the aimed water contents, was determined with the equation adapted from Cromarty et al. (1985):
Wf = Wi (100 – Mi)/100 – Mf
Where: Wf = sample weight (g) after imbibition; Wi = sample weight (g) before imbibition; Mi = seed moisture content (%) before imbibition; Mf = aimed water content (%) after imbibition.
Samples from the six lots with four levels of seed moisture content were submitted to the electrical conductivity test. Initially, the deionized water used was maintained during 24 hours at 25 °C for temperature stabilization. Subsequently, the test was conducted in four subsamples of 50 seeds of each lot and water content. They were weighed with an accuracy of 0.001 g, placed in plastic cups containing 75 mL of deionized water for 24 hours and kept at 25 °C. After this period, the electrical conductivity of the imbibition solution was measured using a conductivity meter, and the values were expressed in μS.cm-1.g-1 of seeds.
The second trial was carried out on the six lots, based on the electrical conductivity test previously described, except that this time the water content was not adjusted (water content reached after hygroscopic equilibrium). The deionized water used for the test was maintained for 24 hours at 10, 15, 20, 25 and 30 ºC until the temperature was stabilized. Four subsamples of each lot were soaked and kept for 24 hours at 10, 15, 20, 25 and 30 ºC.
The resulting data were submitted to the analysis of variance according to a two-way model in a completely randomized design. In the first trial, the crossed factors seed lots (6) and water contents (4) were analyzed and, in the second, the crossed factors seed lots (6) and temperatures (5). In both trials, four replications were used. The model residuals were extracted and submitted to the Shapiro-Wilk normality test and to Bartlett’s homoscedasticity test. The initial water content and the imbibition temperature were studied through polynomial regression. Seed lots were compared in terms of the data of initial characterization
by means of the Tukey test at 5% of probability.
Results and Discussion
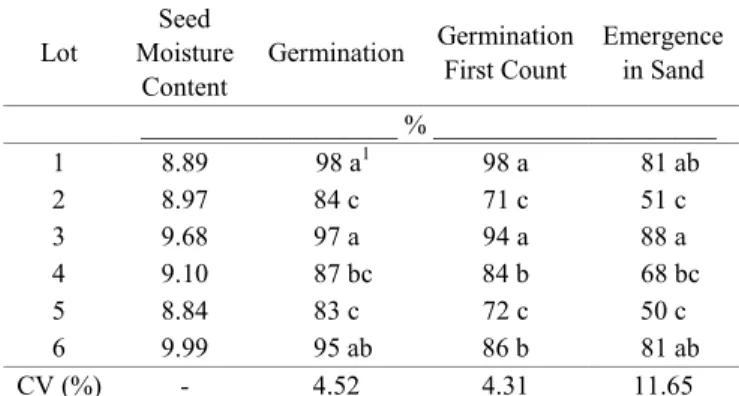
The seed moisture content of the lots, after they had reached the hygroscopic equilibrium, varied from 8.84 to 9.99% (Table 1). This little variation guarantees that the lots have the same level of metabolic activity, which allows the comparison among them (Marcos-Filho, 2015).
The germination of the six lots was above 80%, minimum standard for pea seed commercialization in Brazil (Brasil, 2013). With the germination first count test, it was possible to classify the lots in three levels of vigor: lots 3 and 1, which have high physiological potential; lots 6 and 4, classified as intermediates; and lots 2 and 5, which have low physiological potential. Emergence in sand also resulted in three levels of vigor, and it discriminated lot number 3 from lots 2 and 5 (Table 1). Thus, from the initial characterization of the lots, it may be observed that the lot 3 shows a higher physiological quality, and lots 2 and 5 have lower vigor and germination.
Little variations in seed moisture content of the pea seeds were obtained after the adjustment in relation to the predetermined values (Table 2). These small variations confirm the efficiency and reliability of the humid atmosphere method for adjusting seed moisture content, a fact already reported in other species by Ataíde et al. (2016), Marcos-Filho and Novembre (2009) and Araújo and Rosseto (2005).
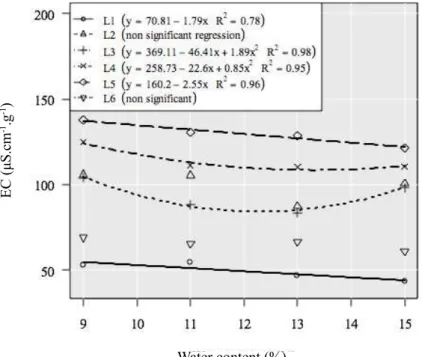
The regression analysis for the effect of the seed moisture content on the amount of leachates released in the soaking solution showed that lots 3 and 4 had a quadratic behavior. In these cases, the electrical conductivity decreased as a function of the water content until reaching a minimum of 11.7 μS.cm-1.g-1 for lot 3, and 13.3 μS.cm-1.g-1 for lot 4. Lots 1 and 5 displayed a
Table 1. Characterization of the initial quality of lots of ‘Mikado’ pea seeds.
Lot
Seed Moisture
Content
Germination Germination
First Count
Emergence in Sand ___________________ % _____________________ 1 8.89 98 a1 98 a 81 ab
2 8.97 84 c 71 c 51 c
3 9.68 97 a 94 a 88 a
4 9.10 87 bc 84 b 68 bc
5 8.84 83 c 72 c 50 c
6 9.99 95 ab 86 b 81 ab
Table 2. Seed moisture content of ‘Mikado’ pea seeds obtained after adjustments according to the desired water content.
Lot Desired seed moisture content (%)
9 11 13 15
1 * 10.17 12.44 15.06
2 * 10.50 13.86 14.86
3 * 10.94 13.24 15.80
4 * 10.76 12.41 15.14
5 * 11.07 12.80 15.98
6 * 10.94 13.24 15.09
*There was no need for adjustment. The initial seed moisture content was used (Table 1).
linear trend (Figure 1) with an inverse relation. The high values
of R2 guarantee the reliability of these models to explain the electrical conductivity results found. For lot 2, there was no adjustment of the regression model, what indicates that the electrical conductivity of the solution does not show any trend as a function of the seed moisture content. For lot 6 the initial seed moisture content did not affect (p > 0.05) the electrical conductivity results of the solution.
The electrical conductivity test is based on the amount of leachates released in the solution, what is associated with the cell membranes integrity (Binotti et al., 2008). Thus, the high electrical conductivity values found in lot 5 reinforce the high level of seed deterioration of this lot. Similar behavior may be observed for lots 2 and 4 (Figure 1; Table 1).
The electrical conductivity decreased in lots 1 and 5 as the seed moisture content increased from 9% to 15%. These results corroborate those obtained by Leão et al. (2012) for common bean seeds, in which high values of electrical conductivity were associated with lots with seed moisture contents ranging from 9 to 11%. In soybean, Vieira et al. (2002) also reported a reduction in the electrical conductivity as the seed moisture content increased from 7 to 17%. Costa et al. (2008) observed the same behavior in pea seeds, i.e., a decrease in electrical conductivity as the seed moisture content increased.
The reduced values of electrical conductivity when the seed moisture content increases may be explained by the membrane system structure. High values of water content cause reorganization of the cell membranes and consequently reduce the electrolytes release in the imbibition solution (Loeffler et al., 1988). The period for reorganization is shorter in seeds with high water content in comparison to seeds with lower water content (Barbosa et al., 2012b).
Lots 3 and 4 did not show a similar behavior, and the conductivity values started to increase again at 15% of water content. These variations between cultivars or seed lots produced in different places and/or seasons have already been reported in the literature by Vieira et al. (2002), who attributed them mainly to the characteristics of lignin content in the seed coat of each material.
There was a stabilization trend of the electrical conductivity results from 13% of water content for most lots (Figure 1). According to Marcos-Filho (2015), this must
Figure 1. Electrical conductivity of the imbibition solution of six lots of ‘Mikado’ pea seeds as a function of different levels of initial seed moisture content (9, 11, 13 and 15%).
EC (
μS.cm
-1.g -1)
have occurred because seeds with water content below 11% are more sensitive to imbibition damage. These damages are caused by the large differences between seed and substrate water potentials, and cause serious problems. In these cases, there is a rapid inflow of water, especially in more deteriorated seeds, what may cause imbibition damages that are responsible for the high amount of exudates released into the medium due to cellular ruptures.
Therefore, it is suggested that the electrical conductivity test in pea seeds should be performed with water content values adjusted between 11 and 15%, since lower values may underestimate the vigor of the lots due to the intense release of electrolytes into the medium. A similar conclusion was obtained by Barbosa et al. (2012b), who suggested the test for peanut seeds to be conducted with water content between 10 and 14%. Leão et al. (2012) suggested that the electrical conductivity test should be carried out in common bean seeds with water content between 11 and 15%.
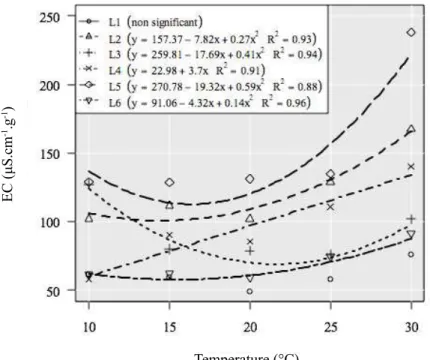
As for the temperature effect on the release of exudates in the soaking solution of the electrical conductivity test, there was a significant effect for five of the six lots, i.e., the temperature affects the test results (Figure 2). The temperature increase causes a reduction in viscosity, an increase in water kinetic energy, and an increase in ions dissociation, what results in high values of electrical conductivity (Steidle Neto et al., 2005; Marcos-Filho, 2015). These data corroborate those obtained by Loeffler et al. (1988), who verified that
differences of 5 °C in the imbibition temperature may alter the results of the electrical conductivity test. For four of these lots, the regression model adjustment was quadratic and for only one of them the best fit was linear.
In lots 2, 3, 5 and 6, the electrical conductivity decreased as the temperature increased to values close to 20 °C (Figure 2). The minimum conductivity expected in these lots is obtained at 14.5, 21.6, 16.4 and 15.4 °C, respectively. From these points on, the amount of leachates increased as the temperature raised up to 30 °C. In lot 4, there was a continuous increase in the amount of leachates in the imbibition solution as the test exposure temperature raised.
At low temperatures, there is an increase in the imbibition solution viscosity (Marcos-Filho, 2015), what may reduce ion mobility and, consequently, cause a reduction in the values obtained in the test.
The findings in this study corroborate the study of Leão et al. (2012), in which the amount of leachates in common bean seed imbibition solution was also higher when the test was carried out at 30 °C. This is related to the increase in ion mobility due to water viscosity reduction at higher temperatures (Loeffler et al., 1988).
In general, the electrical conductivity of the solution was low at lower temperatures. Reduced electrical conductivity values related to low temperatures were also obtained by Fessel et al. (2010). They studied the efficiency of the electrical conductivity to evaluate the vigor of lots stored at different
Figure 2. Electrical conductivity of the imbibition solution in different temperatures (10, 15, 20, 25 and 30 °C) for six lots of ‘Mikado’ pea seeds.
EC (
μS.cm
-1.g -1)
temperatures, and concluded that the storage of soybean seeds at 10 °C tended to stabilize the membrane integrity, what reflects in a lower exudates leaching. Similar results were obtained by Panobianco et al. (2007), who observed that, at 10 °C, the deterioration in pea seeds may not be related to membrane integrity loss, since that at this temperature there may be more repair or reorganization on it, and consequently reduced values of electrical conductivity.
From 25 °C on, there was a classification of the lots similar to that in the germination first count test. Lots 1 and 3 displayed a lower exudates leaching, and thus, a higher vigor; and lot 5 showed a lower vigor than the other ones. The temperature of 25 °C has been suggested for the electrical conductivity test in seeds, since it is easily obtained in laboratories of seed quality control (Vieira and Krzyzanowski, 1999).
Conclusions
The initial pea seed moisture content and the imbibition temperature affect the results of the electrical conductivity test. This test has to be carried out with distilled water previously maintained for 24 hours at 25 ºC for temperature stabilization. Then, the seeds with seed moisture content between 11 and 15% are to be put to imbibition at the temperature of 25 ºC during 24 hours. Such conditions or procedures allow the separation of pea lots in levels of vigor.
References
ALVES, C.Z.; SÁ, M.E. Teste de condutividade elétrica na avaliação do vigor de sementes de rúcula. Revista Brasileira de Sementes,
v.31, n.1, p.203-215, 2009. http://www.scielo.br/pdf/rbs/v31n1/ a23v31n1.pdf
AOSA - Association of Official Seed Analysts. Seed vigor testing handbook. Lincoln: AOSA, 2002. 105p. (Contribution, 32). ARAÚJO, A.E.S.; ROSSETTO, C.A.V. Influência da hidratação controlada na germinação de sementes de amendoim armazenadas.
Científica, v.33, n.2, p.199-207, 2005.
http://dx.doi.org/10.15361/1984-5529.2005v33n2p199+-+207
ATAÍDE, G.M.; LIMA E BORGES, E.E.; GONÇALVES, J.F.C.; GUIMARÃES, V.M.; FLORES, A.V. Alterações fisiológicas durante a hidratação de sementes de Dalbergia nigra ((Vell.) Fr. All. ex
Benth.). Ciência Florestal, v.26, n.2, p.615-625, 2016. http://dx.doi.
org/10.5902/1980509822761
BAALBAKI, R.Z.; ELIAS, S.G.; MARCOS-FILHO, J.; McDONALD, M.B. (Ed.). Seed vigor testing handbook. Ithaca: Association of
Official Seed Analysts, 2009. 341 p. (AOSA. Contribution, 32).
BARBOSA, R.M.; LEÃO, E.F.; CAPRIO, C.H.; VIEIRA, R.D. Teste de condutividade elétrica em sementes de maracujazeiro-amarelo. Revista Brasileira de Fruticultura, v.34, n.2, p.646-651,
2012a. http://www.scielo.br/pdf/rbf/v34n2/43.pdf
BARBOSA, R.M.; SILVA, C.B.; MEDEIROS, M.A.; CENTURION, M.A.P.C.; VIEIRA, R.D. Condutividade elétrica em função do teor de água inicial de sementes de amendoim. Ciência Rural, v.42, n.1,
p.45-51, 2012b. http://www.scielo.br/pdf/cr/v42n1/a0812cr4615.pdf BARBOSA, R.M.; VIEIRA, B.G.T.L.; FERRAUDO, A.S.; CORÁ, J.E.; VIEIRA, R.D. Discrimination of soybean seed lots by multivariate exploratory techniques. Journal of Seed Science, v.35,
n.3, p.302-310, 2013. http://www.scielo.br/pdf/jss/v35n3/05.pdf BINOTTI, F.F.S.; HAGA, K.I.; CARDOSO, E.D.; ALVES. C.Z.; SÁ, M.E.; ARF, O. Efeito do período de envelhecimento acelerado no teste de condutividade elétrica e na qualidade fisiológica de sementes de feijão. Acta Scientiarum. Agronomy, v.30, n.2,
p.247-254, 2008. http://periodicos.uem.br/ojs/index.php/ActaSciAgron/ article/view/1736/1023.
BRASIL. Ministério da Agricultura, Pecuária e Abastecimento.
Regras para análise de sementes. Ministério da Agricultura, Pecuária
e Abastecimento. Secretaria de Defesa Agropecuária. Brasília: MAPA/ACS, 2009. 395p. http://www.agricultura.gov.br/arq_editor/ file/2946_regras_analise__sementes.pdf
BRASIL. Ministério da Agricultura, Pecuária e Abastecimento.
Instrução Normativa nº 45, de 17 de setembro de 2013. Diário Oficial
da União, Brasília, DF. http://www.lex.com.br/legis_24861657_ INSTRUCAO_NORMATIVA_N_45_DE_17_DE_SETEMBRO_ DE_2013.aspx . Accessed on: Jan 26th, 2017.
COSTA, C.J.; VILLELA, F.A.; BERTONCELLO, M.R.; TILLMANN, M.A.A.; MENEZES, N.L. Pré-hidratação de sementes de ervilha e sua interferência na avaliação do potencial fisiológico. Revista Brasileira de Sementes, v.30, n.1, p.198-207, 2008. http://www.scielo.br/scielo.
phpscript=sci_arttext&pid=S010131222008000100025&lng=pt CROMARTY, A.S.; ELLIS, R.H.; ROBERTS, E.H. Design of seed storage facilities for genetic conservation. Rome: IPGRI, 1985. 100p. DELAZERI, P.; GARLET, J.; SOUZA, G.F. Teste de condutividade elétrica em lotes de sementes de Schinus molle L. Floresta e Ambiente, v.23, n.3, p.413-417, 2016. http://www.scielo.br/pdf/
floram/v23n3/2179-8087-floram-2179-8087142615.pdf
FESSEL, S.A.; PANOBIANCO, M.; SOUZA, C.R.; VIEIRA, R.D. Teste de condutividade elétrica em sementes de soja armazenadas sob diferentes temperaturas. Bragantia, v.69, n.1, p.207- 214, 2010.
http://hdl.handle.net/11449/3507
FESSEL, S.A.; VIEIRA, R.D.; CRUZ, M.C.P.; PAULA, R.C.; PANOBIANCO, M. Electrical conductivity testing of corn seeds as influenced by temperature and period of storage. Pesquisa Agropecuária Brasileira, v.41, n.10, p.1551-1559, 2006. http://www.scielo.br/scielo.
php?pid=S0100-204X2006001000013&script=sci_arttext
LEÃO, E.F.; BARBOSA, R.M.; SANTOS, J.F.; VIEIRA, R.D. Soaking solution temperature, moisture content and electrical conductivity of common bean seeds. Seed Technology, v.34, n.2,
LOEFFLER, T.M.; TEKRONY, D.M.; EGLI, D.B. The bulk conductivity test as an indicator of soybean seed quality. Journal of Seed Technology, v.12, n.1, p.37-53, 1988.https://www.jstor.org/
stable/23432694?seq=1#page_scan_tab_contents
MACHADO, C.G.; MARTINS, C.C.; SANTANA, D.G.; CRUZ, S.C.S.; OLIVEIRA, S.S.C. Adequação do teste de condutividade elétrica para sementes de Pisum sativum subsp. Arvense. Ciência Rural, v.41, n.6, p.988-995, 2011. http://www.scielo.br/pdf/cr/
v41n6/a0211cr4312.pdf
MARCOS-FILHO, J. Fisiologia de sementes de plantas cultivadas.
2ed. Londrina: ABRATES, 2015.660p.
MARCOS-FILHO, J.; NOVEMBRE, A.D.L.C. Avaliação do potencial fisiológico de sementes de hortaliças. In: NASCIMENTO, W.M. (Ed.). Tecnologia de sementes de hortaliças. Brasília: Embrapa Hortaliças, 2009. p.185- 243.
MIELEZRSKI, F.; MARCOS-FILHO, J. Potencial fisiológico de sementes armazenadas e desempenho de plantas de ervilha. Revista Brasileira de Sementes, v.34, n.4 p.665-677, 2012. http://www.
scielo.br/pdf/rbs/v34n4/19.pdf
NASCIMENTO, W.M.; SILVA, P.P.; FREITAS, R.A.; BOITEUX, L. Ervilha. In: NASCIMENTO, W.M. (ED.) Hortaliças Leguminosas. 1ed. Brasília: Embrapa, 2016. v.1, p.17-57.
PANOBIANCO, M.; VIEIRA, R.D.; PERECIN, D. Electrical conductivity as an indicator of pea seed aging of stored at different temperatures. Scientia Agrícola, v.64, n.2, p.119-124, 2007. http://www.
scielo.br/scielo.php?pid=S0103-90162007000200003&script=sci_arttext
STEIDLE NETO, A.J.; ZOLNIER, S.; MAROUELLI, W.A.; CARRIJO, O.A.; MARTINEZ, H.E.P. Avaliação de um circuito eletrônico para medição da condutividade elétrica de soluções nutritivas. Engenharia Agrícola, v.25, n. 2, p.427-435, 2005.http://
dx.doi.org/10.1590/S0100-69162005000200016
TORRES, S.B.; MEDEIROS, M.A.; TOSTA, M. S.; COSTA, G.M. M. Teste de condutividade elétrica em sementes de gergelim. Revista Brasileira de Sementes, v.31, n.3, p.70-77, 2009. http://www.scielo.
br/pdf/rbs/v31n3/a08v31n3.pdf
VIEIRA, R.D. Teste de condutividade elétrica. In: VIEIRA, R.D.; CARVALHO, N.M. (Ed.). Testes de vigor em sementes. Jaboticabal:
FUNEP, 1994. p.103-132.
VIEIRA, R.D.; KRZYZANOWSKI, F.C. Teste de condutividade elétrica. In: KRZYZANOWSKI, F.C.; VIEIRA, R.D.; FRANÇA-NETO, J.B. (eds). Vigor de sementes: conceitos e testes. Londrina:
ABRATES, 1999. p.4.1-4.26.
VIEIRA, R.D.; PENARIOL, A.L.; PERECIN, D.; PANOBIANCO, M. Condutividade elétrica e teor de água inicial das sementes de soja. Pesquisa Agropecuária Brasileira, v.37, n.9, p.1333-1338,