Proceedings of the ASME 2014 12th Biennial Conference on Engineering Systems Design and Analysis ESDA2014 June 25-27, 2014, Copenhagen, Denmark
ESDA2014-20487
EXPERIMENTAL STUDY OF THE INTERFERENCE IN AIR CURTAINS DUE TO THE
PARALLEL TRANSFER IN FRONT OF REFRIGERATED DISPLAY CASES
S. M. NascimentoEletrofrio Refrigeração Ltda Curitiba, Brazil
G. G. Heidinger Eletrofrio Refrigeração Ltda
Curitiba, Brazil
P. D. Gaspar University of Beira Interior
Covilhã, Portugal
P. D. Silva
University of Beira Interior Covilhã, Portugal
ABSTRACT
Refrigerated display cases used to expose perishable food for sale in convenience stores and supermarkets are subject to human interference. Clients and repositories transit in front of display cases and frequently remove or place food products on the shelves depending on sales volume. This movement is part of the trade, although it has consequences on the display case performance. Each interference drags or breaks the air curtain resulting in the modification of air flow and promoting the ambient air thermal entrainment that consequently change the equipment's working conditions and increase 2% to 5% its energy consumption. This experimental study quantifies the air temperature increase and the energy consumption increase when there is an interference drag due to people inside the store passing parallel to the frontal opening of the display case. The tests were performed using a robotic mannequin that systematically transfers around the display case (5 minutes lap during 24 hours) and parallel to the frontal opening of the refrigerated display case with a translation velocity of 0.6 m/s. The results show that the products temperature increases 16% and the energy consumption increases 4.6% due to the air movement generated by the robotic mannequin transfer. These results are part of a more complex evaluation of the air curtain interference by humans to be used in the development of new products on an industrial scale.
NOMENCLATURE
b
air curtain width
(m)
g
Gravitational accelerations
(m/s
2)
Gr
Grashof number
(-)
H
Air curtain height
(m)
i
enthalpy
(J/kg)
𝑚̇
Mass flow rate
(kg/h)
𝑄̇
Thermal power
(W)
Re
Reynolds number
(-)
Ri
Richardson number
(-)
RH
Relative humidity
(%)
T
Temperature
(ºC)
u
Velocity
(m/s)
V
Airflow rate
(m
3/h)
X
Dimensionless temperature
(-)
Abbreviation
CFD
Computational fluid Dynamics
DAG
Discharge Air Grille
Subscripts
amb
ambient
DAG
Discharge air grille
ET
Experimental test
HX
Heat exchanger
IB
Insulating body
PAC
Primary Air
RAG
Return air grille
SAC
Secondary Air Curtain
SH
Shelve
sim
simulator
tot
total
INTRODUCTION
Since ancient times, man has the need and the will of obtaining cooling ways that make the temperature of foods products to reach a value below the environmental temperature
in order to preserve them for longer periods of time. The perishable food products, from production to the final consumer, are preserved and channelled through the system named as cold chain. According to Rigot (1991), the cold chain can be described by five main links: Cold in the production stage; Cold during storage, Refrigerated transportation; Cold in the distribution stage; and Home cooling. The fourth link in the cold chain, which is the subject of this paper, is commonly referred as commercial refrigeration by being placed at the trade level. ASHRAE (2010) indicates that the percentage of energy consumed in a typical supermarket due to the refrigeration systems reaches 50%. This energy is consumed by compressors, refrigerated display cabinets, walk-ins and condensers. Among the refrigerated display cabinets installed in a supermarket, those that consumes more energy are of the vertical and open type. According to Faramarzi (1999), ASHRAE (2010) and Gaspar et
al. (2011), the thermal load due to ambient air infiltration to a
vertical open refrigerated display cabinet (ORDC) corresponds respectively from 67% to 81% of the total thermal load, depending on the ambient air conditions. This condition results from the low efficiency of the air curtain which forms an aerothermodynamics barrier between the internal and external environments of the equipment.
The work developed by various researchers has focused, for this type of equipment, in qualifying and quantifying the perceptible thermo-physical properties of the jet that provides a cold air curtain. Hayes & Stoecker (1969) developed a correlation that describes the ability of the air curtain to provide a proper separation between environments. The correlation is given by a dimensionless parameter named as deflection modulus, Dm, which is the ratio between the air curtain momentum and the modulus of the transverse forces caused by temperature difference between the contiguous environments. Faramarzi (1999) determined the relative weight of the total cooling load components for ORDC, composed by thermal loads from infiltration, radiation, conduction, product pull-down cooling, devices (lights and fans), defrost and anti-sweat heaters, and product respiration. According to EN-ISO 23953 (2005), the total thermal cooling load can be determined by eq. (1).
𝑄̇𝑡𝑜𝑡= 𝑚̇𝑟𝑒𝑓∙ ∆𝑖 (1)
Chen et al. (2005, 2009, 2011) developed studies using Computational Fluid Dynamics (CFD) codes to evaluate the thermo-physical parameters of the air curtain in ORDC. The performance of air curtain was evaluated by the following dimensionless numbers/parameters: Reynolds number, Grashof number, Richardson number and dimensionless temperature, given by eq. (2) to eq. (5) respectively, for different aspect ratios (height/width) of the air curtain.
𝑅𝑒 = (𝑢∙𝑏 𝜈)𝐷𝐴𝐺 (2) 𝐺𝑟 =𝑔𝜉(𝑇𝑎𝑚𝑏 − 𝑇𝐷𝐴𝐺)𝐻3 𝜈𝐷𝐴𝐺2 (3) 𝑅𝑖 = 𝐺𝑟 𝑅𝑒2 (4) 𝑋𝑗= 𝑇𝑅𝐴𝐺−𝑇𝐷𝐴𝐺 𝑇𝐴𝑚𝑏−𝑇𝐷𝐴𝐺 (5)
The results provided the following conclusions: (1) for a given Grashof number, there is a critical value of the Richardson number for optimal thermal sealing ability of the air curtain, which means that the value of the Reynolds number decreases by reducing the height/width ratio; (2) the range of values for the Richardson number increases reducing the height/width ratio; (3) for a minimum infiltration rate, the Richardson number decreases reducing the height/width ratio; (4) the volumetric infiltration rate decreases reducing the height/width ratio. Thus it can be stated that air curtains with small height/width ratio provide a good thermal performance. Navaz et al. (2005) developed further studies using Digital Particle Image Velocimetry (DPIV), focusing mainly in studying the effectiveness of the air curtain and maintaining the temperature of food products to a predetermined value. The results indicate that the Reynolds number has direct effect on the ambient air entrainment into the refrigerated equipment due to its role in the turbulence development. According to Navaz et al. (2005), the best range of values for the Reynolds number in the discharge air grille (DAG) is about 3200-3400. In that study, the authors defined the Thermal Entrainment Factor, TEF, to quantify the thermal entrainment of the air curtain with the ambient air, varying 0 < TEF < 1. The analysis to the correlation shows that as closer to 0 is TEF, lower is the thermal entrainment with the ambient air. The correlation described by Navaz et al. (2005) does not take into account the air flow through the perforated back panel (PBP). Yu et al. (2009) developed the TEF equation considering this air flow component. The new correlation is given by eq. (6) to eq. (8) including the dimensionless temperature given by eq. (5).
𝑇𝐸𝐹 = (1 − 𝛽)𝑋𝑗− 𝛽𝑋𝑗𝑋𝑃𝐵𝑃 (6) 𝛽 = 𝑚̇𝑃𝐵𝑃 𝑚̇𝑃𝐵𝑃 + 𝑚̇𝐷𝐴𝐺 (7) 𝑋𝑃𝐵𝑃 = 𝑇𝑃𝐵𝑃 − 𝑇𝐷𝐴𝐺 𝑇𝐴𝑚𝑏 − 𝑇𝐷𝐴𝐺 (8)
The results obtained by Yu et al. (2009) show a good approximation for TEF and temperature value at the return air grille (RAG) with deviations of 0.9% and 0.1 °C respectively. These deviations indicate that the correlation has a good approximation at the engineering level and can be applied in the design of vertical ORDC. Gaspar et al. (2009, 2010, 2011) evaluated the stability of the air curtain for climatic classes n.º 1, n.º 2 and n.º 3 according to EN-ISO 23953 (2005) and other classes beyond the standard. The evaluation was made by experimental testing and numerically using CFD models. The
results showed that the ORDC performance strongly depends on the ambient air conditions such as temperature, humidity, velocity and direction of ambient air flow in relation to the ORDC's frontal opening. These authors showed that (1) the cooling load increases with the air temperature and relative humidity of the external environment, (2) the increase of the ambient air velocity increases more significantly the power consumption of the ORDC than the airflow direction change from parallel to perpendicular in relation the frontal opening of the ORDC, (3) the magnitude of deflection modulus Dm related with minimum momentum required to maintain a stable air curtain is between 0.12 and 0.25; (4) the cooling load due to air infiltration is 78% to 81%, which is a range closer to the values obtained by Faramarzi (1999), and (5) TEF is not constant along the equipment length for parallel air flow. Furthermore, the TEF value increases when the ambient air flow goes from parallel to perpendicular, being the worst case for θamb = 45º. In the case study, TEF = 0.25, 0.32, 0.30 for θamb = 0º, 45º, 90º respectively. Laguerre et al. (2012) developed a simplified analytical model based on heat transfer equations to determine the values of air and product temperatures at various locations of an ORDC. The heat gain by radiation is more significant for products located on the front (top and bottom) and the heat gain by air infiltration is more significant for the products located in the rear (front and rear). Cao et al. (2010, 2011) developed a new strategy for conception and optimization in the air curtains design for vertical ORDC. The strategy is based on the heat transfer model between two fluids (two-fluid of cooling loss - CLTF) developed based on a Support Vector Machine (SVM) algorithm. Mousset and Libsig (2011) developed the correlation described by eq. (9) that quantifies, for any ambient air condition, the cooling load increment relatively to the cooling load in the climate class n.º 3 (25°C/60%RH) of ISO23953 (2005).
Φ24 (𝐶𝐿𝐴𝑆𝑆𝑥)= Φ24 (𝐶𝐿𝐴𝑆𝑆3)
𝐸𝑛𝑡ℎ𝑎𝑙𝑝𝑦(𝐶𝐿𝐴𝑆𝑆𝑥)
𝐸𝑛𝑡ℎ𝑎𝑙𝑝𝑦(𝐶𝐿𝐴𝑆𝑆3) (9)
Where,
Φ
24 (𝐶𝐿𝐴𝑆𝑆𝑥) [W] is the heat extraction rate in the ISO climate class x while theΦ
24 (𝐶𝐿𝐴𝑆𝑆3) [W] is the heat Extraction Rate in the ISO climate class n.º 3. Similarly,Enthalpy(CLASS x) [kJ/kg] is the enthalpy of the humid air
calculated with the temperature and humidity of the class x and
Enthalpy(CLASS 3) [kJ/kg] is the enthalpy of the humid air
calculated with the temperature (25°C) and humidity (60%RH) of the climate class n.º 3.
This paper presents the results of an experimental study that quantifies the increase of products temperature and energy consumption when there is an interference drag due to people inside the store passing parallel to the frontal opening of the display case. The tests were performed using a robotic mannequin that systematically transfers around the display case (5 minutes lap during 24 hours) and parallel to the frontal opening of the refrigerated display case with a translation velocity of 0,6 m/s. The results show that the products temperature increases 16% and the energy consumption increases 2% to 5% due to the air movement generated by the
robotic mannequin transfer. These results are part of a more complex evaluation of the air curtain interference by humans to be used in the development of new products on an industrial scale.
EXPERIMENTAL STUDY
Experimental facility and equipment
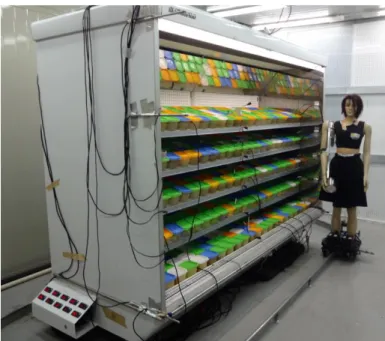
The vertical ORDC provided by Eletrofrio Refrigeration LTDA - Brazil has 2.5x1.1x2.1 m3. As shown in Figure 1, it comprises:
(1) an insulating body (IB) surrounding all the equipment; (2) tube and fins heat exchanger (HX);
(3) discharge air grille (DAG); (4) return air grille (RAG);
(5) perforated back panel (PBP) and; (6)shelves (SH).
The temperature of the refrigerated compartment is provided by the cold air mass flow that exits DAG and PBP and returns to RAG to be cooled again in the HX. The air flow exiting DAG forms an air curtain which protects the inner refrigerated compartment. Note that this equipment has a primary air curtain (PAC) and a secondary air curtain (SAC) in order to promote a more effective aerothermodynamics sealing.
Figure 1. Vertical open refrigerated display cabinet.
The device has four fans with 53 W each to supply a flow rate of 0.4 m3/s to DAG and PBP. The air, before reaching the DAG, passes through an evaporator with dimensions 2.20x0.13x0.35 m3 constituted by 222 fins and three rows of tubes in the air flow direction and 8 rows of tubes perpendicular to it. The DAG has a total width, b, of 140 mm, which is equally distributed to form the PAC (bPAC = 70 mm) and SAC (bSAC = 70 mm). This equipment is used to display products with temperature class M1 (-1 °C to +5 °C). It was installed a remote mechanical system with a compressor Octagon 2DC-3.2 and water condenser. The measuring instruments were selected in order to obtain reliable measurements of the relevant physical properties variation collected every minute during the experimental test.
The experimental tests (ET) followed EN ISO 23953 (2005) and were performed in a climatic chamber designed in accordance as shown in Figure 2.
Figure 2. Climatic chamber (A=0.98m; B=1m; C=0.65m;
X=2m;Y=1.85m).
Figure 3 shows the middle section of the ORDC. Air temperature and humidity sensors Super MT 530 were placer near DAG and RAG and in the ambient air. Temperature sensors type PT1000 were placed in the test packages (product simulators). A Coriolis flowmeter MASSFLO 2100 DI 6 was installed at the liquid refrigerant line. Table 1 shows the experimental techniques and probes/experimental measuring devices used to collect the relevant physical properties.
Figure 3. Sensors positioning (Temp. sensors: ⚫; Temp. and humidity sensors: ⚫)
Table 1. Experimental techniques and measuring probes/devices.
Experimental
technique Model Range Accu.
Thermometry MT 530 Super PT 1000 -40 to +80°C -10 to 70°C ± 0.3°C ± 1.5°C Hygrometry MT 530 Super 20 to 85% ± 5% Anemometry HTA 4200 0.3 to 34 m/s ± 1% Flowmetry MASSFLO2100 0 to 1000 kg/h 0.1% Barometry AKS 32 0 to 200 psig ± 0.3% Robotic mannequin
A robot: MARIA (Mannequin for Automatic Replication of the Interference in the Air curtain / Manequim Automatizado
para Reprodução das Interferências na cortina de Ar) was
designed and constructed for the experimental study (see Figure 3). The robot was programmed to move in front of display case during 24h with a time period of 5 min, with a translation velocity of 0.6 m/s. This velocity value was obtained with field analysis and corresponds to the average velocity of people transferring inside a supermarket when they are in front of ORDC in the butchery sector.
Experimental testing procedure
Experimental tests were performed with and without the translation movement of MARIA in order to obtain experimental data that allow the comparison of the display case performance with and without interference of the air curtain due to the systematic transfer of MARIA. Figure 4 shows the layout of the experimental testing procedure. Tests were performed under the same climate condition and air velocity in the test room.
RESULTS ANALYSIS AND DISCUSSION
The experimental results of both case studies (with and without interference) were analyzed and compared based on 24h data of air temperature and relative humidity in the DAG and RAG. Additionally, the thermal load obtained in both case studies was also compared.
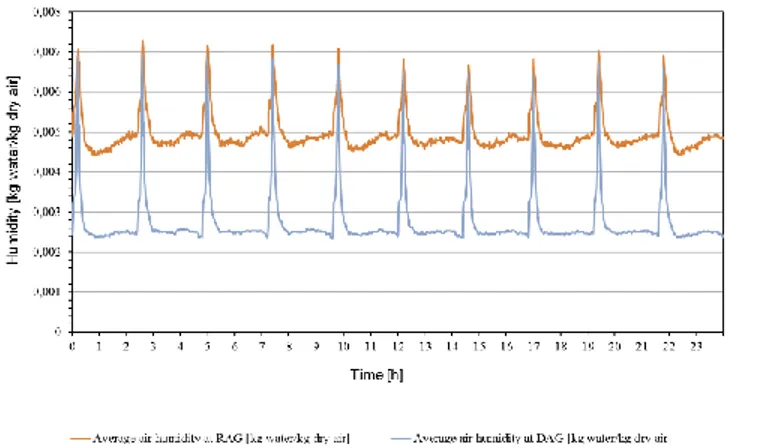
Figure 5 and Figure 6 shown respectively the 24h data of air temperature and (absolute) humidity in the DAG and RAG for the experimental testing without MARIA transferring around the ORDC, Figure 7 and Figure 8 shows respectively the evolution of the air temperature and humidity considering the translational movement of MARIA parallel to the frontal opening of the ORDC, but against the direction of air flow from the test room.
Figure 5. Air temperature at DAG and RAG for the case study without the interfering translational movement of MARIA.
Figure 6. Air humidity at DAG and RAG for the case study without the interfering translational movement of MARIA.
In Figure 5, the effect of the period of defrost on the air temperature and humidity is shown. Since the evaporator defrost system is a heating coil placed inside the evaporator fins, when the system operates (set to 2h30m intervals), the air temperature and humidity at DAG increase in large amount. After the defrost system stop, the refrigeration system starts up and takes
approximately 30 minute to return air temperature and humidity to the proper values for the products conservation.
MARIA transfers around the ORDC during the all testing period (refrigeration and defrost cycles). The objective of the experimental testing is to evaluate the increase of air temperature and humidity at DAG, RAG and conservation zone after 24h. During this period, the refrigerant flow and the enthalpies difference were measured/calculated. Thus, the influence on thermal performance of the parallel transfer in front of the ORDC and consequent interference of the air curtain can be quantified.
Figure 7. Air temperature at DAG and RAG for the case study with the interfering translational movement of MARIA.
Figure 8. Air humidity at DAG and RAG for the case study with the interfering translational movement of MARIA.
The values of air temperature and humidity at RAG show a small increase at end of the test period due to the translational movement of MARIA. The values of air temperature and humidity at DAG maintained approximately constant during the test period because the heat exchanger absorbs the heat gain of the air curtain due to external interferences.
The thermal load was measured based on the refrigerant flow and enthalpies difference. The latter energy parameter had a slight increase, from 4575 [kcal/h] to 4785 [kcal/h], which equates to 4.6% increase that now can be quantified as due to perturbations, disturbances or interference with the air curtain of open display cases.
CONCLUSION
This paper describes the performance results of an ORDC when subjected to external disturbances on the air curtain. With the robotic mannequin developed for this purpose, MARIA (Mannequin for Automatic Replication of the Interference in the Air curtain / Manequim Automatizado para Reprodução das
Interferências na cortina de Ar), was possible to simulate
systematically the movement of customers inside the store and quantify the increase of air temperature and thermal load due to this disturbance. It has been observed experimentally that the air temperature and humidity at RAG have a slight increase, approximately 0.2 °C and 0.4 gwater/kgdry air. Thus, the air enthalpy is higher than in the case study without MARIA moving around the display case.
At supermarkets, there are several models of display cases, and all are subject to external interference due to customers transfer. This study allow to quantify for this condition, a thermal load increase of approximately 4.6%, which is for the model in study represents an increase of 210 [kcal/h].
REFERENCES
[1] ASHRAE. 2010, “ASHRAE Handbook: Refrigeration”, ASHRAE, Inc.
[2] Cao, Z., Gu, B. Mills, G., Han, H. 2010, A novel strategy for predicting the performance of apen vertical refrigerated display cabinets based on the MTF model and ASVM algorithm, Int. J. of Refrigeration 33(7), 1413-1424. [3] Cao, Z., Gu, B. Mills, G., Han, H. 2010, Application of an effective strategy for optimizing the design of air curtains for open vertical refrigerated display case, Int. Journal of
Thermal Sciences 49(6), 976-983.
[4] Cao, Z., Gu, G., Han, H. 2011, A novel optimization strategy for the design of air curtains for open vertical refrigerated display cases, Applied Thermal Engineering 31(16), pp. 3098–3105.
[5] Chen, Y., Yuan, X.-L. 2005, Simulation of a cavity insulated by a vertical single band cold air curtain, Energy
Conversion and Management 46(11-12), 1745-1756.
[6] Chen, Y. 2009, Parametric evaluation of refrigerated air curtains for thermal insulation, International Journal of
Thermal Sciences 48(10), 1988-1996.
[7] Chen, Y., Xia, D.H. 2011, The flow characteristics analyses of refrigerated air curtains in multi-deck display cabinets, International Congress of Refrigeration), 23rd ed., Pregue, Czech Republic.
[8] Faramarzi, R. 1999, Efficient display case refrigeration,
ASHRAE Journal 41(11), 46–52.
[9] Foster, A.M., Madge, M., Evans, J.A. (2005), The use of CFD to improve the performance of a chilled multi-deck retail display cabinet, International Journal of Refrigeration, 28(5), 698–705.
[10] Gaspar, P.D., Gonçalves, L.C.C., Vogeli, A. 2009, Dependency of air curtain performance on discharge air velocity (grille and back panel) in open refrigerated display cabinets, ASME International Mechanical Engineering
Congress and Exposition, Lake Buena Vista, Florida, U.S.A.
[11] Gaspar, P.D., Gonçalves, L.C.C., Ge, X. 2010, CFD parametric study of ambient air velocity magnitude influence in thermal behaviour of open refrigerated display cabinets,
European Conference on Computational Fluid Dynamics,
5rd ed., Lisbon, Portugal
[12] Gaspar, P.D., Gonçalves, L.C.C., Ge, X. 2010, Influence of ambient air velocity orientation in thermal behaviour of open refrigerated display cabinets, ASME 2010 10th Biennial
Conference on Engineering Systems Desing and Analysis,
Istanbul, Turkey, July.
[13] Gaspar, P.D., Gonçalves, L.C.C., Pitarma, R.A. 2011, Experimental analysis of the thermal entrainment factor of air curtains in vertical open display cabinets for different ambient air conditions, Applied Thermal Engineering 31(5), 961–969.
[14] Gaspar, P.D., Gonçalves, L.C.C., Pitarma, R.A. 2011, Análise Experimental da estabilidade de cortinas de ar de equipamentos de refrigeração para diferentes condições do ar ambiente, International Conference on Engineering
UBI2011 -28-30 Nov 2011 - Universidade of Beira Interior -
Covilhã, Portugal.
[15] Hayes, F.C., Stoecker, W.F. 1969, Design data for air curtains, ASHRAE Transactions 75(2), 68-180.
[16]Laguerre, O., Hoang, M.H., Flick, D. 2012, Heat transfer modelling in a refrigerated display cabinet: the influence of operating conditions, Journal of Food Engineering 108(2), 353-364.
[17] Navaz, H.K., Henderson, B.S., Faramarzi, R., Pourmovahed, A., Taugwalder F. 2005, Jet entrainment rate in air curtain of open refrigerated display cases, International
Journal of Refrigeration 28(2), 267–275.
[18] Rigot, G. 1991, Meubles et Vitrines Frigorifiques, PYC DITION, París, France, 340p.
[19] Yu, K., Ding, G., Chen, T. 2009, A correlation model of thermal entrainment factor for air curtain in a vertical open display cabinet, Applied Thermal Engineering 29(14-15), 2904–2913.