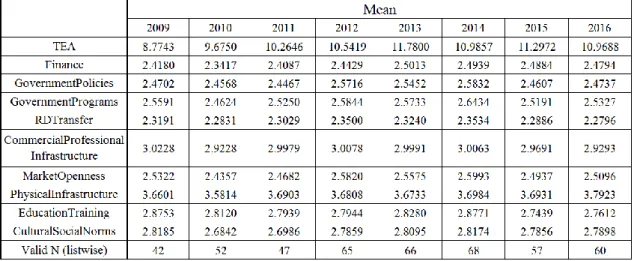
Institutional environment and total entrepreneurial activity: the comparison on nations
Texto
Imagem

Documentos relacionados
Nessa perspectiva, uma das formas de abordagem da Acessibilidade informacional é, portanto, o estudo dos fatores e das melhores práticas que a favorecem. Do ponto de vista do núcleo
Unanswered Questions and Research Needs A major unanswered question for the developing world is how to balance the use of very limited resources between efforts
If the wider definition of the environment is used, ‘*the overall available epidemiological data strongly suggest that a vast majority of cancers, approximately
Em muitos planos: na forma, claramente assumida e explicitada em diploma legal - a Resolução do Conselho de Ministros n.o 10/85, de 31 de Janeiro - quan- do,
Sumário: 1 Notas introdutórias – 2 O paradigma do Estado moderno e o Di reito fundado em uma racionalidade cientificista – 3 O positivismo jurídico da Escola
“Se filosofar é descobrir o sentido primordial do ser, não se filosofa afastando-se da condição humana; é necessário, ao contrário, aprofundar-se nela”. Ambas carregam no seu
Espera-se que existam diferenças de género no autoconceito e nas diferentes dimensões do mesmo constructo; que os níveis de autoconceito, o tipo de vinculação e
Essa associação depende ainda da quantidade de formação obtida, sendo que, no modelo linear estimado por OLS, em média e mantendo tudo o resto constante, a diferença no valor
