2012/2013
Mariana da Silva Beirão Carrapatoso
Age responses to exercise training
in older adults
Mestrado Integrado em Medicina
Área: Fisiologia
Trabalho efetuado sob a Orientação de:
Doutor Pedro Alexandre Gomes Santiago de Figueiredo
E sob a Coorientação de:
Doutor Tiago Alexandre Henriques Coelho
Trabalho organizado de acordo com as normas da revista
European Journal of Applied Physiology
Mariana da Silva Beirão Carrapatoso
Age responses to exercise training in older adults
Dl
pORTO
Projeto de Opção do 60 ano - DECLARAÇÃO DE INTEGRIDADE!
FMUP
!
FACULDADE DE MEDICINAUNIVERSIDADEDOPORTO
j"
UNIDADE CURRICULAR
PROJETO DE opçÃO
DISSERTAÇÁO I MONOGRAFIA
i_= W; 7 =
Eu, Mariana da Silva Beirão carrapatoso, abaixo assinado, nO mecanográfico 070801081, estudante do
60 ano do Mestrado Integrado em Medicina, na Faculdade de Medicina da Universidade do Porto, declaro ter atuado com absoluta integridade na elaboração deste projeto de opção.
Neste sentido, confirmo que NÃO incorri em plágio (ato pelo qual um indivíduo, mesmo por omissão, assume a autoria de um determinado trabalho intelectual, ou partes dele). Mais declaro que todas as
frases que retirei de trabalhos anteriores pertencentes a outros autores, foram referenciadas, ou
redigidas com novas palavras, tendo colocado, neste caso, a citação da fonte bibliográfica.
[JJPORTO
Projeto de Opção do 60 ano - DECLARAÇÃODEREPRODUÇÃO!FMUPIFACULDADE DE MEDICINA UNIVERSIDADE DO PORTO SL&i J .JU ~ UNIDADE CURRICULAR PROJETO DE o sçso DISSERTAÇAo~ I ••ONOGRAFIA -""".~-~
Nome: Mariana da Silva Beirão Carrapatoso
Email: [email protected]
Título da Dissertação:
Age responses to exerci se training in older adults
Orientador:
Doutor Pedro Alexandre Gomes Santiago de Figueiredo
Coorientador:
Doutor Tiago Alexandre Henriques Coelho
Ano de conclusão: 2013
Designação da área do projeto: Fisiologia
Faculdade de Medicina da Universidade do Porto, 20/03/2013
É autorizada a reprodução integral desta Dissertação para efeitos de investigação e de divulgação
1
Age responses to exercise training in older adults
Mariana Carrapatoso1, Elisa A Marques2,3, Joana Carvalho2, Jorge Mota2, Tiago Henriques-Coelho1, Pedro Figueiredo3,4
1 Faculty of Medicine, University of Porto, Porto, Portugal
Al. Prof. Hernâni Monteiro, 4200 - 319 Porto, Portugal
2Research Centre in Physical Activity, Health and Leisure (CIAFEL), Faculty of Sport, University of
Porto, Porto, Portugal
Rua Dr. Plácido Costa, 91, 4200 - 450 Porto, Portugal.
3 Higher Education Institute of Maia, Maia, Portugal.
Av. Carlos Oliveira Campos, 4475 - 690 Avioso S. Pedro, Maia, Portugal
4 Centre of Research, Education, Innovation and Intervention in Sport, Faculty of Sport, University of
Porto.
Rua Dr. Plácido Costa, 91, 4200 - 450 Porto, Portugal.
Corresponding author: Mariana Carrapatoso [email protected]
2
Abstract
Purpose: The purpose of the present study was to evaluate how age affects the responses on
body composition, strength and dynamic balance to a 32-week multicomponent training in older adults.
Methods: 126 subjects were stratified in two age groups, the young-old group (YO, 60 – 70
years old) and the old group (O, ≥71 years old) and were randomly assigned to an exercise (EG) and a control group (CG). The EG completed a 32-week progressive multicomponent training (3 sessions of 50 minutes per week). Body composition, isokinetic lower limb strength, and agility / dynamic balance were assessed before and after training. Three-way ANOVA with repeated measures was used to determine trial (baseline, 32 weeks), training group (control, exercise) and age group (YO, O) effects on the variables.
Results: No group differences were observed in baseline values, with the exception of the 8
foot Up and Go (UG) and trunk fat mass (FM). After the 32 weeks, the YOEG decreased appendicular (11.84 ± 2.87 to 11.42 ± 2.75 kg), total FM (25.85 ± 6.50 to 25.05 ± 6.41 kg), improved total fat-free mass (42.25 ± 8.82 to 42.61 ± 8.89 kg) and right knee extension peak torque (140.00 ± 42.50 to 149.53 ± 42.44 %). Both YOEG and OEG showed a significant improvement in UG test score, and increased appendicular lean mass and knee flexion peak torque. The OCG increased the trunk FM (9.91 ± 3.88 to 10.52 ± 3.52 kg) and decreased total
BMC (19.21 ± 4.83 to 18.73 ± 4.84 kg) and BMD (1.03 ± 0.14 to 1.01 ± 0.14 g cm-2) after 32
weeks.
Conclusion: This study showed that 32 weeks of multicomponent training can produce
significant changes in dynamic balance and in body composition- and strength-related variables and the rate of response was influenced by age, as the YOEG showed higher and better adaptations compared to the OEG.
Key words
3
Introduction
The demographics of world are set to change, with more elderly living in developing countries. The World Health Organization (WHO) points out that the percentage of the world population aged 60 years and over will double (11% - 22%), from 2000 to 2050 (WHO 2012). In the same period, it is likely that the total number of people over 60 years old will increase from 605 million to 2 billion (WHO 2012). This growth is more evident in people in their eighties, whose number is expected to have almost quadrupled to 395 million (WHO 2012). In fact, the U.S. Census Bureau states that life expectancy at birth overcomes 80 years old in 11 countries (Kinsella and He 2009). Although this numbers of increased longevity confirm the success of improved global heath, they pose many challenges (Kinsella and He 2009). In particular, from a public heath point of view, delaying physical frailty is of great importance and one of the major goals of heath providers and gerontology researchers (Rikly and Jones 1999).
Aging is associated with important changes in muscle strength, body composition and physical function (Witham and Avenell 2010; Doherty 2003; Baumgartner et al. 1995). It is well established that muscle strength declines as age increases after the 30 decade (Doherty 2003). Studies have revealed that it reaches a peak value at around the third decade, followed by a steady state and a decline after age 50 (Lindle et al. 1997; Hurley 1995; Lauretani et al. 2003). Lang et al. (2010) reviewed the findings of cross-sectional studies comparing young (20-40 years) and old (70-80 years) healthy adults and describes declines of 20 to 40% in the maximum knee extensor (torque in the elderly. Superior losses, of at least 50%, occurred for those in their eighties (Doherty 2003). Furthermore, this age-related decline was maintained when elderly subjects of different ages (60-79 and over 80 years old) were compared, having the older group showed a reduction of 15% in muscle strength (Ko et al. 2012). Also, a longitudinal study reported that 10 years after the first evaluation, subjects showed a decline in isokinetic strength of knee extensors and flexors of respectively, 14% and 16% per decade for both genders (Hughes et al. 2001).
Moreover, body composition changes occur over aging (Baumgartner et al. 1995). There is a progressive rise in fat mass (FM) and decrease of fat-free mass (FFM) from the age of 20 to 70 years; afterwards both follow a decreasing trend (Mathus-Vliegen 2012; Kyle et al. 2001; Johannsen et al. 2008). The distribution of FM and FFM is modified to a central pattern, with the reduction of the peripheral mass (Mathus-Vliegen 2012). Lower limb muscle mass undergoes a steady decline with onset at 45 years old (Janssen et al. 2000; Kyle et al. 2001). There is also a decrease in the amount of bone tissue with aging, which results in bone weakness and increased risk of fractures (Marques et al. 2012).
4
Indeed, studies demonstrate that lower limb muscle strength, FM and LM influence the walking performance of elderly people (Marques et al. 2011a; Visser et al. 2005). Muscle mass and strength loss are regarded as one of the main factors that contribute to disability, loss of mobility and falls in older people (Lauretani et al. 2003; Lang et al. 2010; Baumgartner et al.
1998). It was observed thatmen and women in the eighth decade of life that are in the lowest
quartile of knee extension muscle strength were 2.64 and 2.15 times more prone to develop mobility limitations compared to those in the highest quartile (Visser et al. 2005). Actually, around the eighties, strength level often reaches a level below the necessary to perform everyday activities (Rikli 2000) and a sedentary lifestyle is thought to play an important role (Janssen et al. 2000; Doherty 2003; Vandervoort 2002).
It is recognized that physical activity has positive influences on maintaining older people functional capacities, on the reduction of the age-related disease risk and on the enhancing of daily quality of life (Stewart 2005; Chodzko-Zajko et al. 2009; Baker et al. 2009; Cress et al. 1999; Paterson and Warburton 2010; Carvalho et al. 2009). The American College of Sports Medicine recommends a multicomponent training program, with aerobic, strength and flexibility exercises, in order to improve and maintain physical function in older adults (Chodzko-Zajko et al. 2009). The positive adaptation on bone density, muscle mass, muscle strength, functional fitness and weight loss of this combined training programs have been reported (Mathus-Vliegen 2012; Carvalho et al. 2009; Marques et al. 2011b; Marques et al. 2012). Also, it has been shown that multicomponent training programs produce improvements on functional fitness of older adults of different ages (Puggaard 2003; Toraman and Sahin 2004). However, although it is recommended to maintain physical activity throughout life, it is known that people become more sedentary with aging (Johannsen et al. 2008; Corder et al. 2009).
With the increasing of the population’s lifespan and the knowledge of the importance of physical activity in later years, it is important to identify effective programs for older adults. However, little information is available about the optimum prescriptions for different age populations (Rikli 2000; Washburn 2000; Hughes et al. 2011; Rikli and Jones 2012). Therefore, the main purpose of this study was to evaluate how age affects the responses of body composition, isokinetic lower limb strength, and agility/ dynamic balance, to a 32 weeks multicomponent training program, analyzing different age groups (young old, YO – 60 - 70 years old and old, O – ≥71 years old).
5
Materials and Methods
Participants and experimental design
Participants were recruited through advertisements in the Porto area newspapers for participation in this university-based study. The eligible participants pool were restricted to older adults with the following characteristics: aged ≥ 60 years, white, community-dwelling status, not engaged in structured exercise training programs, free of hormone therapy use for at least 2 years, lack of use of any medication and nutritional supplements known to affect bone metabolism (such as diuretics, corticosteroids, anticonvulsants, immunosuppressive medications, non-steroidal anti-inflammatory drugs, asthma medications with corticosteroids, vitamin D, and calcium), and lack of diagnosed or self-reported cardiovascular, pulmonary, metabolic, renal, hepatic or orthopedic medical conditions.
On the initial screening visit, a total of 139 volunteers (mean age 69.2 ± 5.7) received a complete explanation of the purpose, risks, and procedures of the investigation. After signing a written consent form, the past medical history and current medications of the participants were determined. Eight subjects were excluded due to medical reasons (three used medication known to affect bone metabolism and five had musculoskeletal disorders that contra-indicate participation in exercise testing) and five were excluded due to current involvement in water-based exercise activities. Eligible participants were stratified by their age group. There were 83 subjects in the YO group (between 60 – 70 years) and 43 subjects in the O group (between 71 – 83 years).
Participants’ characteristics are listed in Table 1. This study was conducted according to the guidelines laid down in the Declaration of Helsinki and all procedures involving human participants were approved by the institutional Review Board.
Measurements
The same evaluator on each test, at the faculty facilities, performed all measurements. All test stations were organized in a circuit and the same conditions were maintained for each test.
Bone and Body Composition
Dual-energy X-ray absorptiometry (DXA; QDR 4500A; Hologic, Bedford, MA) was used to
measure total bone mineral content (BMC, kg), total bone mineral density (BMD, g cm-2), total
lean mass (LM, kg), fat mass (FM, kg), and FM (%) through whole-body scans as described previously (Marques et al. 2011b). Appendicular skeletal LM and FM were generated as the
6
sum of LM and FM in arms and legs and were determined by the region of interest (ROI) program.
Height and body mass were recorded using a portable stadiometer and balance weighing scales, respectively. BMI was calculated as body mass (kilograms) divided by height (meters) squared and categorized according to established cut points of <25, 25–30, and ≥30 (WHO
2000); obesity was considered as BMI ≥30 kg m-2.
Muscle strength
The dynamic concentric muscle strength of the right lower limb, namely knee flexion (KF) and extension (KE) muscle groups, was measured on an isokinetic dynamometer (Biodex System 4 Pro; Biodex, Shirley, NY). Strength measurements were carried out in accordance with the
manufacturer’s instructions for KE/KF at 60 s-1
(1.05 rad s-1) as described elsewhere (Marques
et al. 2011b). Peak torque, represented as a percentage normalized to body weight, was used for the statistical analyses. The coefficient of variation was 5.1% and 5.5% for KE and KF repeat measurements, respectively (conducted with the same machine by the same examiners).
Agility/dynamic balance
Agility/dynamic balance was measured using the 8-foot Up and Go (UG) test. The score corresponds to the shortest time to rise from a seated position, walk 2.44 m (8 foot), turn, and return to the seated position, measured to the nearest one-tenth of a second.
Exercise intervention
The exercise training group completed a 32-week progressive multicomponent training consisting of three sessions per week (non-consecutive days). Each exercise session lasted approximately 50 minutes. Training workouts consisted of a five-minute warm-up that included stretching, warm-up exercises, 25 minutes of aerobic exercise that mainly consisted of walking but also included stepping and dancing, 15 minutes of muscular endurance exercises performed concentrically and eccentrically, involving squats, hip flexors, extensors, and abductors; knee flexors and extensors and upper body exercises performed using elastic bands and dumbbells; and a 5-minute cool-down. In the first month, the intensity of the aerobic exercises was
gradually increased from 50-60% to 70-80% of the HRReserve, where a subject´s maximum heart
rate (i.e. HRmax = 208 – 0.7 age) was calculated as suggested by (Tanaka et al. 2001) or from a
rating of perceived exertion (RPE) of 4-6 to 7-8. In order to make sure that the subjects were exercising at the targeted intensity, Polar Heart Rate Monitors (Polar Team System, Finland)
7
were worn during each exercise session. For strength exercises repetitions were increased from eight to 15 and the number of sets increased to three; the working load also increased to achieve the target intensity of 7-8 on the RPE scale. When an individual RPE was under the rating of seven for two consecutive sessions, the subject was instructed to increase the load so that he/she could perform two sets of 12-15 reps at an appropriate RPE. Each session was led by two research assistants and supervised by the coordinator and senior researcher.
Statistical analysis
All data are reported in means ± SD. Statistical analyses were performed using SPSS (version 20.0; SPSS, Inc. Chicago, IL). Descriptive statistics were computed for the dependent variables. Independent sample T-test was used to compare training age groups at baseline variables. Three-way ANOVA with repeated measures were used to determine exercise group (EG, CG), age group (YO, O), and trial (baseline, 32 weeks) effects on agility, and muscle strength-, bone-, body composition-related variables. When ANOVA revealed significant interaction (trial x group, trial x age, trial x age x group), Bonferroni post hoc tests were performed to determine differences between initial and final values in each group.
8
Results
All the 126 participants completed the 32 weeks of the study, having the 63 participants in the exercise group performed 96 sessions of training (maximum attendance). No exercise or assessment-related adverse effects were reported.
The characteristics of the study participants are listed in Table 1. Regarding obesity classification, the higher proportion of participants was overweight (BMI between 25 and 30 kg
m-2). A significant difference of age between the YO and the O groups was confirmed.
However, the average age of YO groups (exercise vs control), as well as O groups (exercise vs control) did not differ significantly. The YO group and O group did not present any other significant differences, with the exception of the percentage of female subjects, which was higher in the YO group.
Also, at baseline, no significant differences were identified among the groups in the tests performed, with the exception of the UG test and trunk FM. The YOEG was faster than the YOCG in the UG (p < 0.001), whereas the OEG had higher trunk FM than the OCG (p = 0.033).
Bone and Body Composition
Significant age x group x time interactions were found on total BMC (p = 0.002) and BMD (p = 0.002), as show in table 2. Indeed, different responses were noticed in the different groups over time. Also, it should be highlighted that both total BMC (p < 0.001) and BMD (p < 0.001) results decreased significantly with time in the OCG, while the YOCG did not show significant changes.
On all variables of FM measured there were significant group x time interactions (p = 0.006 for appendicular FM, p = 0.003 for trunk FM and p < 0.001 for total FM) and age main effects (p = 0.046 for appendicular FM, p = 0.015 for trunk FM and p = 0.023 for total FM). The YOEG group showed a significant reduction of appendicular and total FM (p < 0.001), whereas the OCG significantly increased trunk FM (p = 0.034).
A significant age x group x time interaction was found on appendicular LM (p = 0.024). Both YOEG (p = 0.011) and OEG (p < 0.001) showed a significant improvement on the LM content, but no significant modifications were observed on the control groups.
For total FFM, a significant group x training interaction was found (p = 0.029). Only the YOEG showed a significant increase in the results after the training (p = 0.040). No significant interactions or main effects were observed on trunk FFM, total FM and BMI.
9
Muscle strength
The results of maximal KF and KE torques at 60 s-1 for the right lower limb and the adjustment
for body weight are shown in table 3. There were significant group x time interactions on KF torque of the right leg at 60 s-1 (p < 0.001). Accordingly, different responses were observed in the exercise and in the control groups over time, particularly significant increases in both YOEG (p < 0.001) and OEG (p = 0.047), in contrast with non-significant decreases of YOCG and OCG. Both group (p = 0.034) and age (p = 0.045) main effects were observed on KF torque adjusted to body weight. Also, a significant time main effect was found on KE torque adjusted to body weight (p = 0.019). KE torque adjusted to body weight (p = 0.024) showed improvements with training in the YO group. Moreover, neither YOCG nor OCG demonstrated any significant changes in all strength tests following the 32 weeks period.
Agility/dynamic balance
Significant group x training interactions were found of the UG test (p < 0.001), as listed on table 4. Only the exercise groups significantly decreased the time of performance after the 32 weeks (p < 0.001 for both). The post-training results of the YOEG and OEG were significantly shorter than the control groups (p < 0.001 for both). Also, there was a significant main effect of age (p < 0.001).
10
Discussion
This study aimed to understand how age interferes with the response to a multicomponent training program on body composition, isokinetic lower limb strength, agility and dynamic balance. The results confirmed that there are differences in the outcomes after training for subjects in the 60-70 years old range when compared to over 70 years old. The YOEG showed a decrease in the appendicular and total FM and an improvement of total FFM and KE peak torque, whereas no significant changes were observed in the OEG. However, there were variables in which age seem to have less interference, such as the UG test, appendicular LM and KF peak torque, since both YOEG and OEG showed significant increases. Another important finding was the gain of trunk FM and decrease of total BMC and BMD seen on OCG after the 32 weeks of the study.
Previous studies have related the role of endurance training on FM reduction among the elderly (Solberg et al. 2011; Strasser et al. 2009; Mathus-Vliegen 2012), but no data about the age influence could be found. The results show that the training program led to a decrease of appendicular and total FM of the YOEG. It could be hypothesized that the 32 weeks of the study were not sufficient to show significant effects on O participants. The age-associated reduction of metabolism and endocrine changes that favor the obese state are more evident as aging occurs (Witham and Avenell 2010). Moreover, the lack of a marked endurance component of the training and the absence of a nutritional intervention seem to have compromised a greater effect in both age groups. It has shown that the combination of diet and exercise is more effective than exercise alone in the FM reduction of older adults (Villareal et al. 2011; Witham and Avenell 2010). Also, the addition of physical activity is thought to decrease the skeletal muscle fat infiltration that occurs with aging, consequently improving muscle quality (Witham and Avenell 2010), which corroborates the present results of a reduction of appendicular FM. However, although it is recognized that a high FM is related to an increased risk of disabilities (Visser et al. 1998), there is evidence that appendicular FM can exhibit an independent protective effect on BMD, so reductions should be managed carefully.
Lower limb muscle strength is one of the most important determinants of good physical performance in old adults (Lauretani et al. 2003; Fried and Guralnik 1997). The results showed that only the YOEG improved KE muscle strength, but both age groups were able to improve KF. Although there is previous evidence that strength training could increase muscle strength in nonagenarians (Fiatarone et al. 1990), in this study, age effect seems to be important on the KE outcome, which might be related to different levels of intensity and duration of the training program. In fact, the comparison of different types of exercise revealed that strength training is the most effective in producing muscle strength increases in elderly (Solberg et al. 2011;
11
Volkers et al. 2012). These results might also be linked to the loss of appendicular FM observed in the YOEG, as described above, since one important morphologic aspect of the muscle aging is the infiltration of lipids within the fibers (Lang et al. 2010).
Other important findings of the present study were the significant decreases of total BMC and BMD and the increase of trunk FM, as well as the trend to decrease KE muscle strength values, seen on OCG, after the 32 weeks of the study. Regarding bone mass, these findings are in accordance with previous data which documented that age is an important predictor of BMD in older adults (Marques et al. 2012). Although it has been reported that osteogenic responsiveness to mechanical loading declines with age (Lanyon and Skerry 2001), the present results seem to show that exercise counterbalanced the age-related declines, since in contrast to the OCG, the OEG tended to increase total BMC and maintained BMD outcomes. Concerning the trunk FM gain observed, it does not follow the previous reports pointing out that after the age of 70 years old, FM had a tendency to decrease (Mathus-Vliegen 2012). In spite of having significantly higher values of trunk FM at baseline, the OEG showed a downward trend, so once again it could be said that exercise has opposed the aging effects. Also, exercise demonstrated a tendency to counterbalance age effects on KE muscle strength, in agreement to the previous reports that highlighted the importance of physical activity throughout a person’s lifetime (Volkers et al. 2012).
Although cross-sectional and longitudinal studies have shown differences through aging on body composition, bone mass, muscle strength and functional fitness, there is a gap in the literature regarding the effects of exercise in old adults through decades. As far as we know, only Toraman and Sahin (2004) have evaluated the effects of a multicomponent training on men and women of two different age groups’ functional fitness. They found out significant increases in all the tests used in both young and older subjects of the training group, as well as better outcomes in exercise subjects than the ones in the control group with the same age. However, the responses to training were similar in both age groups. This was not observed for the majority of the variables measured in the current study. One possible reason for this difference is the fact functional fitness tests are more likely to be influenced by repetition than DXA and Biodex assessments, so the post-training results of Toraman and Sahin (2004) could have been increased partially by the subjects improved knowledge of the test. The results of the single functional fitness test used in the present study are in line with what was reported by Toraman and Sahin (2004), since it was demonstrated that both exercise groups were able to improve the performance in the UG test. This test evaluates the integration of power, speed, agility and dynamic balance, reflects activities of the everyday life, such as getting up quickly to answer the door and is also a good predictor of recurrent falling (Rikly and Jones 1999). Thus, it could be said that the multicomponent training showed a positive effect on the improvement of the
12
physical capacities required to an independent living and also counterbalanced the aging-related declines. Also, the results were consistent with previous findings that agility and dynamic balance of older adults can be improved by multicomponent training (Nelson et al. 2004; Carvalho et al. 2009), but the current results add that not only the 60-70 old adults but also the ones over 70 years old can improve these parameters.
It has been suggested that exercise programs for the elderly were more beneficial to the people with a lower function at baseline, given that greater improvements were observed after the training period, whereas little advantages were achieved by older adults with an initial high function (Solberg et al. 2011; Meuleman et al. 2000). However, this study showed that improvements occurred mostly in the YOEG, which had better results in the majority of the variables measured at baseline and at the end of the study. So it might be proposed that other factors can contribute to the more effectiveness of the training, such as younger age. The same study reported positive influences on body composition and muscle strength after training programs of three types, namely traditional and functional strength trainings and endurance training (Solberg et al. 2011). Thus, further studies concerning the most effective training program for older people in different decades should be conducted. The oldest subjects are of special concern, as the age-related frailty makes them more prone to injuries and so exercises need to be better adapted to the physiologic aging process.
Attention should also be paid to the reasons for the low rate of older people that enroll training programs, but even more to the small amount of moderate physical activity performed in daily life, as people in their nineties are thought to spend 96 % of the day in sedentary or low intensity activities (Johannsen et al. 2008). Advice from health professionals and the development of simple, safe and attractive local programs are an important part of the solution.
Finally, this study has some limitations that should be comment. There are other factors that can influence the response to training besides age, such as nutrition, genetics, motivation, previous physical activity. No gender division was performed, but a recent meta-analysis related that men and women do not seem to differ in the relation between physical activity and muscle strength (Volkers et al. 2012). In addition, the percentage of female participants was higher in the YO than in the O group, in contrast with the described increase of women proportion with age in the older population (Kinsella and He 2009). In addition, the small sample size (especially in the O groups) and the health status of the subjects may not allow this study to be extended to all older adults, with different comorbilities.
13
Conclusions
In summary, this study showed that the response to the 32 weeks of multicomponent training was influenced by age. Only the YOEG showed significant changes in the appendicular and total FM, total FFM and KE peak torque after the exercise. It was also demonstrated losses in bone mass and muscle strength, as well as an increase of trunk FM during the 32 weeks of the study only in the OCG (≥71 years old), which may have been counterbalanced by the exercise program.
This study strengthens the idea that physical activity needs to be adapted to the physiologic ageing process, as it can effectively contribute to the goal of preserving a good quality of life until later years. The understanding of the responses to exercise will help to design individualized training programs to prevent disability and loss of independence. Further studies with older people of different ages need to be performed.
Acknowledgements
This research was funded by the Portuguese Foundation of Science and Technology (FTC), grant Pest-OE/SAU/UI0617/2011.
Conflict of interests
14
References
Baker J, Meisner BA, Logan AJ, Kungl AM, Weir P (2009) Physical activity and successful aging in Canadian older adults. J Aging Phys Act 17 (2):223-235
Baumgartner RN, Koehler KM, Gallagher D, Romero L, Heymsfield SB, Ross RR, Garry PJ, Lindeman RD (1998) Epidemiology of sarcopenia among the elderly in New Mexico. Am J Epidemiol 147 (8):755-763
Baumgartner RN, Stauber PM, McHugh D, Koehler KM, Garry PJ (1995) Cross-sectional age differences in body composition in persons 60+ years of age. J Gerontol A Biol Sci Med Sci 50 (6):M307-316
Carvalho MJ, Marques E, Mota J (2009) Training and detraining effects on functional fitness after a multicomponent training in older women. Gerontology 55 (1):41-48. doi:10.1159/000140681
Chodzko-Zajko WJ, Proctor DN, Fiatarone Singh MA, Minson CT, Nigg CR, Salem GJ, Skinner JS (2009) American College of Sports Medicine position stand. Exercise and physical activity for older adults. Med Sci Sports Exerc 41 (7):1510-1530. doi:10.1249/MSS.0b013e3181a0c95c
Corder K, Ogilvie D, van Sluijs EM (2009) Invited commentary: Physical activity over the life course--whose behavior changes, when, and why? Am J Epidemiol 170 (9):1078-1081.doi: 10.1093/aje/kwp273
Cress ME, Buchner DM, Questad KA, Esselman PC, deLateur BJ, Schwartz RS (1999) Exercise: effects on physical functional performance in independent older adults. J Gerontol A Biol Sci Med Sci 54 (5):M242-248
Doherty TJ (2003) Invited Review: Aging and sarcopenia. J Appl Physiol 95 (4):1717-1727. doi:10.1152/japplphysiol.00347.2003
Fiatarone MA, Marks EC, Ryan ND, Meredith CN, Lipsitz LA, Evans WJ (1990) High-intensity strength training in nonagenarians. Effects on skeletal muscle. JAMA 263 (22):3029-3034
Fried LP, Guralnik JM (1997) Disability in older adults: evidence regarding significance, etiology, and risk. J Am Geriatr Soc 45 (1):92-100
Hughes SL, Leith KH, Marquez DX, Moni G, Nguyen HQ, Desai P, Jones DL (2011) Physical activity and older adults: expert consensus for a new research agenda. Gerontologist 51 (6):822-832. doi:10.1093/geront/gnr106
Hughes VA, Frontera WR, Wood M, Evans WJ, Dallal GE, Roubenoff R, Fiatarone Singh MA (2001) Longitudinal muscle strength changes in older adults: influence of muscle mass, physical activity, and health. J Gerontol A Biol Sci Med Sci 56 (5):B209-217
Hurley BF (1995) Age, gender, and muscular strength. J Gerontol A Biol Sci Med Sci 50 Spec No:41-44. doi:10.1093/gerona/50A.Special_Issue.41
Janssen I, Heymsfield SB, Wang ZM, Ross R (2000) Skeletal muscle mass and distribution in 468 men and women aged 18-88 yr. J Appl Physiol 89 (1):81-88
Johannsen DL, DeLany JP, Frisard MI, Welsch MA, Rowley CK, Fang X, Jazwinski SM, Ravussin E, Louisiana Healthy Aging S (2008) Physical activity in aging: comparison among young, aged, and nonagenarian individuals. J Appl Physiol 105 (2):495-501. doi:10.1152/japplphysiol.90450.2008
Kinsella K, He W (2009) An Aging World: 2008. US Government Printing Office, Washington, DC
Ko SU, Stenholm S, Metter EJ, Ferrucci L (2012) Age-associated gait patterns and the role of lower extremity strength - results from the Baltimore Longitudinal Study of Aging. Arch Gerontol 55 (2):474-479. doi:10.1016/j.archger.2012.04.004
15
Kyle UG, Genton L, Hans D, Karsegard VL, Michel JP, Slosman DO, Pichard C (2001) Total body mass, fat mass, fat-free mass, and skeletal muscle in older people: cross-sectional differences in 60-year-old persons. J Am Geriatr Soc 49 (12):1633-1640
Lang T, Streeper T, Cawthon P, Baldwin K, Taaffe DR, Harris TB (2010) Sarcopenia: etiology, clinical consequences, intervention, and assessment. Osteoporos Int 21 (4):543-559. doi:10.1007/s00198-009-1059-y
Lauretani F, Russo CR, Bandinelli S, Bartali B, Cavazzini C, Di Iorio A, Corsi AM, Rantanen T, Guralnik JM, Ferrucci L (2003) Age-associated changes in skeletal muscles and their effect on mobility: an operational diagnosis of sarcopenia. J Appl Physiol 95 (5):1851-1860. doi:10.1152/japplphysiol.00246.2003
Lindle RS, Metter EJ, Lynch NA, Fleg JL, Fozard JL, Tobin J, Roy TA, Hurley BF (1997) Age and gender comparisons of muscle strength in 654 women and men aged 20-93 yr. J Appl Physiol 83 (5):1581-1587
Marques E, Carvalho J, Pizarro A, Wanderlay F, Mota J (2011a) The influence of physical activity, body composition, and lower extremity strength on walking ability. Motor Control 15 (4):494-506
Marques EA, Mota J, Carvalho J (2012) Exercise effects on bone mineral density in older adults: a meta-analysis of randomized controlled trials. Age 34 (6):1493-1515. doi:10.1007/s11357-011-9311-8
Marques EA, Mota J, Machado L, Sousa F, Coelho M, Moreira P, Carvalho J (2011b) Multicomponent training program with weight-bearing exercises elicits favorable bone density, muscle strength, and balance adaptations in older women. Calcif Tissue Int 88 (2):117-129. doi:10.1007/s00223-010-9437-1
Mathus-Vliegen EM (2012) Prevalence, pathophysiology, health consequences and treatment options of obesity in the elderly: a guideline. Obes Facts 5 (3):460-483. doi:10.1159/000341193
Meuleman JR, Brechue WF, Kubilis PS, Lowenthal DT (2000) Exercise training in the debilitated aged: strength and functional outcomes. Arch Phys Med Rehabil 81 (3):312-318
Nelson ME, Layne JE, Bernstein MJ, Nuernberger A, Castaneda C, Kaliton D, Hausdorff J, Judge JO, Buchner DM, Roubenoff R, Fiatarone Singh MA (2004) The effects of multidimensional home-based exercise on functional performance in elderly people. J Gerontol A Biol Sci Med Sci 59 (2):154-160
Paterson DH, Warburton DE (2010) Physical activity and functional limitations in older adults: a systematic review related to Canada's Physical Activity Guidelines. Int J Behav Nutr Phys Act 7:38. doi:10.1186/1479-5868-7-38
Puggaard L (2003) Effects of training on functional performance in 65, 75 and 85 year-old women: experiences deriving from community based studies in Odense, Denmark. Scand J Med Sci Sports 13(1):70-76
Rikli RE (2000) Reliability, validity, and methodological issues in assessing physical activity in older adults. Res Q Exerc Sport 71(2 Suppl):S89-96
Rikli RE, Jones CJ (2012) Development and Validation of Criterion-Referenced Clinically Relevant Fitness Standards for Maintaining Physical Independence in Later Years. Gerontologist. 53(2):255-67 doi:10.1093/geront/gns071
Rikly RE, Jones CJ (1999) Development and Validation of a Functional Fitness Test for Community-Residing Older Adults. JAPA 7:129-161
Solberg PA, Kvamme NH, Raastad T, Ommundsen Y, Tomten SE, Halvari H, Loland NW, Hallén J (2011) Effects of different types of exercise on muscle mass, strength, function and well-being in elderly. European Journal of Sport Science 13 (1):112-125. doi:10.1080/17461391.2011.617391
Stewart KJ (2005) Physical activity and aging. Ann N Y Acad Sci 1055:193-206. doi:10.1196/annals.1323.029
16
Strasser B, Keinrad M, Haber P, Schobersberger W (2009) Efficacy of systematic endurance and resistance training on muscle strength and endurance performance in elderly adults--a randomized controlled trial. Wien Klin Wochenschr 121 (23-24):757-764. doi:10.1007/s00508-009-1273-9
Tanaka H, Monahan KD, Seals DR (2001) Age-predicted maximal heart rate revisited. J Am Coll Cardiol 37 (1):153-156
Toraman F, Sahin G (2004) Age responses to multicomponent training programme in older adults. Disabil Rehabil 22;26(8):448-54 doi:10.1080/096382803100001663012
Vandervoort AA (2002) Aging of the human neuromuscular system. Muscle Nerve 25 (1):17-25 Villareal DT, Chode S, Parimi N, Sinacore DR, Hilton T, Armamento-Villareal R, Napoli N, Qualls C, Shah K (2011) Weight loss, exercise, or both and physical function in obese older adults. N Engl J Med 364 (13):1218-1229. doi:10.1056/NEJMoa1008234
Visser M, Goodpaster BH, Kritchevsky SB, Newman AB, Nevitt M, Rubin SM, Simonsick EM, Harris TB (2005) Muscle mass, muscle strength, and muscle fat infiltration as predictors of incident mobility limitations in well-functioning older persons. J Gerontol A Biol Sci Med Sci 60(3):324-333
Visser M, Langlois J, Guralnik JM, Cauley JA, Kronmal RA, Robbins J, Williamson JD, Harris TB (1998) High body fatness, but not low fat-free mass, predicts disability in older men and women: the Cardiovascular Health Study. Am J Clin Nutr 68 (3):584-590
Volkers KM, de Kieviet JF, Wittingen HP, Scherder EJ (2012) Lower limb muscle strength (LLMS): why sedentary life should never start? A review. Arch Gerontol Geriatr 54 (3):399-414. doi:10.1016/j.archger.2011.04.018
Washburn RA (2000) Assessment of physical activity in older adults. RQES 71 (2 Suppl):S79-88
WHO (2012) Ageing and Life Course. Interesting facts about ageing.
http://www.who.int/ageing/about/facts/en/index.html Accessed 15 March 2013
WHO (2000) Obesity: Preventing and Managing the Global Epidemic. Report of a WHO consultation. World Health Organization Technical Report Series 894:i-xii, 1-253 Witham MD, Avenell A (2010) Interventions to achieve long-term weight loss in obese older
people: a systematic review and meta-analysis. Age Ageing 39 (2):176-184. doi:10.1093/ageing/afp251
17
Tables
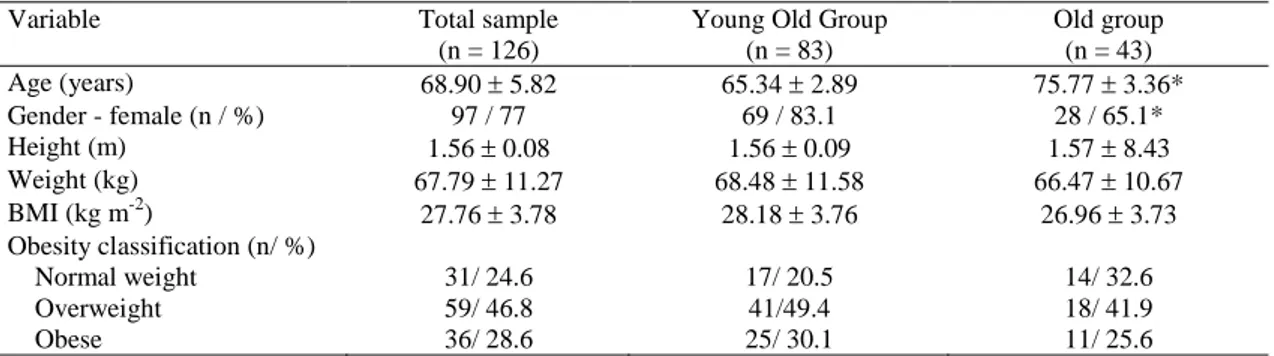
Table 1 Baseline characteristics of the study subjects (mean standard deviation)
Variable Total sample
(n = 126)
Young Old Group (n = 83) Old group (n = 43) Age (years) 68.90 5.82 65.34 2.89 75.77 3.36* Gender - female (n / %) 97 / 77 69 / 83.1 28 / 65.1* Height (m) 1.56 0.08 1.56 0.09 1.57 8.43 Weight (kg) 67.79 11.27 68.48 11.58 66.47 10.67 BMI (kg m-2) 27.76 3.78 28.18 3.76 26.96 3.73 Obesity classification (n/ %) Normal weight 31/ 24.6 17/ 20.5 14/ 32.6 Overweight 59/ 46.8 41/49.4 18/ 41.9 Obese 36/ 28.6 25/ 30.1 11/ 25.6
18
Table 2 Pre- and post-training results (mean ± standard deviation) of body composition
Exercise group (n = 63) Control group (n = 63)
Young old group (n = 42) Old group (n = 21) Young old group (n = 41) Old group (n = 22)
Variables Pre-training Post-training Pre-training Post-training Pre-training Post-training Pre-training Post-training P
(group) P (age) P (time) P (G x T) P (G x A) P (A x T) P (A x G x T) BMI (kg m-2) 28.06 ± 4.18 27.25 ± 5.44* 27.75 ± 3.71 27.75 ± 3.65 28.29 ± 3.33 28.36 ± 3.23 26.20 ± 3.66 26.30 ± 3.69 0.563 0.169 0.471 0.284 0.132 0.357 0.401 BMC total (kg) 18.06 ± 3.65 18.06 ± 3.70 18.28 ± 3.66 18.45 ± 3.56 18.07 ± 3.72 18.10 ± 3.62 19.21 ± 4.83 18.73 ± 4.84* 0.667 0.416 0.193 0.004 0.691 0.111 0.002 BMD total (g cm-2) 1.03 ± 0.09 1.02 ± 0.09 1.02 ± 0.11 1.02 ± 0.10 1.02 ± 0.10 1.02 ± 0.10 1.03 ± 0.14 1.01 ± 0.14* 0.866 0.964 0.044 0.050 0.981 0.151 0.002 Appendicular FM (kg) 11.84 ± 2.87 11.42 ± 2.75* 11.05 ± 2.99 10.91 ± 3.08 12.25 ± 2.66 12.22 ± 2.73 10.63 ± 3.30 10.77 ± 3.29 0.764 0.046 0.075 0.006 0.420 0.067 0.635 Trunk FM (kg) 13.05 ± 3.99 12.66 ± 4.01 12.40 ± 3.75 11.99 ± 3.64 12.94 ± 3.55 13.05 ± 3.61 9.91 ± 3.88c 10.52 ± 3.52* 0.189 0.015 0.873 0.003 0.129 0.334 0.304 Total FM (kg) 25.85 ± 6.50 25.05 ± 6.41* 24.41 ± 5.87 23.94 ± 6.09 26.17 ± 5.81 26.24 ± 5.92 22.06 ± 6.03 22.38 ± 6.20 0.601 0.023 0.084 0.001 0.240 0.255 0.876 Appendicular LM (kg) 16.80 ± 4.14 17.05 ± 4.26* 16.74 ± 3.57 17.26 ± 3.54* 16.97 ± 4.22 16.99 ± 3.94 17.48 ± 3.52 17.23 ± 3.57 0.783 0.762 0.025 <0.001 0.839 0.966 0.024 Trunk LM (kg) 20.66 ± 4.21 20.73 ± 41.85 21.00 ± 4.00 20.90 ± 3.51 20.79 ± 3.98 20.77 ± 3.81 21.18 ± 4.38 21.12 ± 4.40 0.851 0.682 0.781 0.861 0.942 0.499 0.669 Total LM (kg) 40.44 ± 8.52 40.83 ± 8.55 40.80 ± 7.43 40.72 ± 8.64 40.87 ± 8.36 40.85 ± 7.90 41.95 ± 8.36 41.88 ± 8.62 0.659 0.705 0.702 0.493 0.766 0.363 0.456 Trunk FFM (kg) 21.10 ± 4.29 21.19 ± 4.28 21.44 ± 4.07 21.34 ± 3.58 21.23 ± 4.05 21.23 ± 3.87 21.62 ± 4.46 21.55 ± 4.48 0.856 0.698 0.832 0.891 0.945 0.401 0.704 Total FFM (kg) 42.25 ± 8.82 42.61 ± 8.89* 42.63 ± 7.72 43.12 ± 7.56 42.65 ± 8.64 42.66 ± 8.13 43.87 ± 8.71 43.76 ± 8.98 0.716 0.615 0.078 0.029 0.824 0.991 0.566 Total FM (%) 37.61 ± 6.67 46.44 ± 62.92 36.36 ± 6.06 35.58 ± 6.17 38.05 ± 6.33 38.03 ± 6.29 33.43 ± 7.03 33.82 ± 7.51 0.390 0.157 0.531 0.568 0.824 0.494 0.457
G - group, A- age, T - training, BMI - body mass index, BMC - bone mineral content, BMD - bone mineral density, FM - fat mass, LM - lean mass, FFM - fat-free mass.
c Significant difference between pre-training OEG and OCG.
19
Table 3 Pre- and post-training results (mean ± standard deviation) of lower limb muscle strength
Exercise group (n = 63) Control group (n = 63)
Young old group (n = 42) Old group (n = 21) Young old group (n = 41) Old group (n = 22)
Variable Pre-training Post-training Pre-training Post-training Pre-training Post-training Pre-training Post-training P
(group) P (age) P (time) P (G x T) P (G x A) P (A x T) P (A x G x T) KE PT R (N.m) 94.32 ± 32.63 100.31 ± 33.55* 90.56 ± 27.99 92.20 ± 27.12 88.49 ± 40.52 88.03 ± 36.79 76.24 ± 23.80 82.26 ± 19.68 0.073 0.205 0.071 0.775 0.794 0.770 0.138 KE PT/BW R (%) 140.00 ± 42.50 149.53 ± 42.44* 128.70 ± 41.30 138.14 ± 35.95 129.92 ± 44.71 131.15 ± 43.47b 117.46 ± 34.89 121.32 ± 28.43 0.053 0.123 0.019 0.174 0.989 0.803 0.789 KF PT R (N.m) 49.27 ± 19.51 54.11 ± 18.82* 43.99 ± 18.60 47.43 ± 18.41* 45.95 ± 18.85 44.81 ± 18.39 40.14 ± 18.54 37.48 ± 19.45 0.059 0.072 0.134 <0.001 0.932 0.328 0.963 KF PT/BW R (%) 73.53 ± 23.42 77.44 ± 26.02 65.10 ± 22.96 69.72 ± 23.73 65.81 ± 22.52 67.97 ± 27.79 59.56 ± 24.58 54.66 ± 26.16 0.034 0.045 0.335 0.062 0.847 0.292 0.198
G - group, A - age, T - training, KE - knee extension, KF - knee flexion, PT - peak torque, BW - body weight, R60 - right lower limb at 60 s-1.
b Significant difference between post-training YOEG and YOCG groups.
20
Table 4 Pre- and post-training results (mean ± standard deviation) of agility/dynamic balance
Exercise group (n = 63) Control group (n = 63)
Young old group (n = 42) Old group (n = 21) Young old group (n = 41) Old group (n = 22)
Variable Pre-training Post-training Pre-training Post-training Pre-training Post-training Pre-training Post-training P (group) P (age) P (time) P (G x T) P (G x A) P (A x T) P (A x G x T)
8ft UG (s) 5.05 ± 0.64 4.61 ± 0.61* 5.96 ± 1.11 5.22 ± 0.85* 5.65 ± 0.79a 5.63 ± 0.91b 6.32 ± 0.96 6.22 ± 0.97d <0.001 <0.001 <0.001 <0.001 0.657 0.057 0.306
G - group, A - age, T - training, 8 ft UG – 8 foot Up and Go test
a Significant difference between pre-training YOEG and YOCG. b Significant difference between post-training YOEG and YOCG. d Significant difference between post-training OEG and OCG.
26/02/13 European Journal of Applied Physiology – incl. option to publish open access
www.springer.com/biomed/human+physiology/journal/421?print_view=true&detailsPage=pltci_1060521 1/11
Biomedical Sciences - Human Physiology | European Journal of Applied Physiology – incl. option to publish open access
Editors-in-Chief: H. Westerblad; K.R. Westerterp ISSN: 1439-6319 (print version)
ISSN: 1439-6327 (electronic version) Journal no. 421
Instructions for Review Authors (pdf, 50 kB)
Instructions for Authors of Letters to the Editor (pdf, 26 kB)
European Journal of Applied Physiology
Instructions for Authors
TYPES OF PAPERS
The journal publishes Original Articles, Editorials, Invited Reviews, Letters to the Editor, Replies, and Topical Issues.
Review authors find specific guidelines on the link below.
Authors of Letters to the Editor find specific guidelines on the link below.
Article Requirements
To facilitate rapid publication manuscripts should be prepared carefully in accordance with the following requirements.
The Conflict of interest is mandatory for all articles types.
Original articles and Invited Reviews should be composed as follows. Title page (numbered as page 1)
Abstract (except for Editorials, Letters to the Editor and Replies) Introduction
Keywords
Methods (also Technique or Case histories) Results
Discussion (comments and comparison with other published results) Conclusions
26/02/13 European Journal of Applied Physiology – incl. option to publish open access www.springer.com/biomed/human+physiology/journal/421?print_view=true&detailsPage=pltci_1060521 2/11 Acknowledgements Conflict of interest References Abbreviations Tables Legends Illustrations
• Contributions that are part of a Special Issue must include the following footnote on the title page:
"This article is published as part of the Special Issue on [title of the Special Issue]"
MANUSCRIPT SUBMISSION
Manuscript Submission
Submission of a manuscript implies: that the work described has not been published before; that it is not under consideration for publication anywhere else; that its publication has been approved by all co-authors, if any, as well as by the responsible authorities – tacitly or explicitly – at the institute where the work has been carried out. The publisher will not be held legally responsible should there be any claims for compensation.
Permissions
Authors wishing to include figures, tables, or text passages that have already been published elsewhere are required to obtain permission from the copyright owner(s) for both the print and online format and to include evidence that such permission has been granted when
submitting their papers. Any material received without such evidence will be assumed to originate from the authors.
Online Submission
Authors should submit their manuscripts online. Electronic submission substantially reduces the editorial processing and reviewing times and shortens overall publication times. Please follow the hyperlink “Submit online” on the right and upload all of your manuscript files following the instructions given on the screen.
TITLE PAGE
Title Page
The title page should include: The name(s) of the author(s) A concise and informative title
The affiliation(s) and address(es) of the author(s)
The e-mail address, telephone and fax numbers of the corresponding author Abstract
Please provide a structured abstract of 150 to 250 words which should be divided into the following sections:
Purpose (stating the main purposes and research question) Methods
26/02/13 European Journal of Applied Physiology – incl. option to publish open access
www.springer.com/biomed/human+physiology/journal/421?print_view=true&detailsPage=pltci_1060521 3/11
LaTeX macro package (zip, 182 kB)
Conclusions Keywords
Please provide 4 to 6 keywords which can be used for indexing purposes. Specific remarks on Abstract
The sections should describe briefly and concisely the background and aim/hypothesis of the investigation, the most important methods, the major results and the conclusions drawn. Major results should be presented quantitatively where appropriate, and changes reported must be expected to be statistically significant (e.g. write "endurance time increased from a ± b to c ± d min" and not "endurance time increased (P ‹ 0.01)"). The conclusion should highlight the physiological significance of the study and not be a repetition of the results. The abstract should not contain any undefined abbreviations and references may not be cited.
TEXT
Text Formatting
Manuscripts should be submitted in Word.
Use a normal, plain font (e.g., 10-point Times Roman) for text. Use italics for emphasis.
Use the automatic page numbering function to number the pages. Do not use field functions.
Use tab stops or other commands for indents, not the space bar. Use the table function, not spreadsheets, to make tables. Use the equation editor or MathType for equations.
Save your file in docx format (Word 2007 or higher) or doc format (older Word versions).
Manuscripts with mathematical content can also be submitted in LaTeX.
Headings
Please use no more than three levels of displayed headings. Abbreviations
Abbreviations should be defined at first mention and used consistently thereafter. Footnotes
Footnotes can be used to give additional information, which may include the citation of a reference included in the reference list. They should not consist solely of a reference citation, and they should never include the bibliographic details of a reference. They should also not contain any figures or tables.
Footnotes to the text are numbered consecutively; those to tables should be indicated by superscript lower-case letters (or asterisks for significance values and other statistical data). Footnotes to the title or the authors of the article are not given reference symbols.
Always use footnotes instead of endnotes. Acknowledgments
Acknowledgments of people, grants, funds, etc. should be placed in a separate section before the reference list. The names of funding organizations should be written in full.
26/02/13 European Journal of Applied Physiology – incl. option to publish open access
www.springer.com/biomed/human+physiology/journal/421?print_view=true&detailsPage=pltci_1060521 4/11
SPECIFIC REMARKS
Abbreviations
While authors are encouraged to use abbreviations when appropriate, these should be used
sparingly and should conform to the convention of the subject area, e.g. for cardiovascular physiology, thermo-physiology and respiratory physiology.
Result section
The text in the Results section should be written in a way so that it can be understood by
physiologically interested scientists who are not specialists in the particular field of the investigation. Excessive usage of field-specific abbreviations should be avoided. The outcome of statistical analysis should be reported in the text only when it was used to test a specified hypothesis. Detailed
descriptions of aspects such as subjects involved in the study, including statistical analyses, are better presented in tables. Authors are encouraged to include as figures original records obtained during experiments, and not simply group-mean responses; for instance, representative original records can often be used to illustrate complex differences between groups.
Conclusions section
Authors should provide concise conclusions to their work and are encouraged to put their results into a wider physiological context. The conclusions must not just be a repetition of the results.
SCIENTIFIC STYLE
Please always use internationally accepted signs and symbols for units, SI units.
REFERENCES
Citation
Cite references in the text by name and year in parentheses. Some examples: Negotiation research spans many disciplines (Thompson 1990).
This result was later contradicted by Becker and Seligman (1996).
This effect has been widely studied (Abbott 1991; Barakat et al. 1995; Kelso and Smith 1998; Medvec et al. 1999).
Reference list
The list of references should only include works that are cited in the text and that have been published or accepted for publication. Personal communications and unpublished works should only be
mentioned in the text. Do not use footnotes or endnotes as a substitute for a reference list. Reference list entries should be alphabetized by the last names of the first author of each work.
Journal article
Gamelin FX, Baquet G, Berthoin S, Thevenet D, Nourry C, Nottin S, Bosquet L (2009) Effect of high intensity intermittent training on heart rate variability in prepubescent children. Eur J Appl Physiol 105:731-738. doi: 10.1007/s00421-008-0955-8
Ideally, the names of all authors should be provided, but the usage of “et al” in long author lists will also be accepted:
Smith J, Jones M Jr, Houghton L et al (1999) Future of health insurance. N Engl J Med 965:325–329
Article by DOI
Slifka MK, Whitton JL (2000) Clinical implications of dysregulated cytokine production. J Mol Med. doi:10.1007/s001090000086
26/02/13 European Journal of Applied Physiology – incl. option to publish open access
www.springer.com/biomed/human+physiology/journal/421?print_view=true&detailsPage=pltci_1060521 5/11
EndNote style (zip, 3 kB)
South J, Blass B (2001) The future of modern genomics. Blackwell, London Book chapter
Brown B, Aaron M (2001) The politics of nature. In: Smith J (ed) The rise of modern genomics, 3rd edn. Wiley, New York, pp 230-257
Online document
Cartwright J (2007) Big stars have weather too. IOP Publishing PhysicsWeb. http://physicsweb.org/articles/news/11/6/16/1. Accessed 26 June 2007 Dissertation
Trent JW (1975) Experimental acute renal failure. Dissertation, University of California
Always use the standard abbreviation of a journal’s name according to the ISSN List of Title Word Abbreviations, see
www.issn.org/2-22661-LTWA-online.php
For authors using EndNote, Springer provides an output style that supports the formatting of in-text citations and reference list.
TABLES
All tables are to be numbered using Arabic numerals.
Tables should always be cited in text in consecutive numerical order.
For each table, please supply a table caption (title) explaining the components of the table.
Identify any previously published material by giving the original source in the form of a reference at the end of the table caption.
Footnotes to tables should be indicated by superscript lower-case letters (or asterisks for significance values and other statistical data) and included beneath the table body.
ARTWORK AND ILLUSTRATIONS GUIDELINES
For the best quality final product, it is highly recommended that you submit all of your artwork – photographs, line drawings, etc. – in an electronic format. Your art will then be produced to the highest standards with the greatest accuracy to detail. The published work will directly reflect the quality of the artwork provided.
Electronic Figure Submission Supply all figures electronically.
Indicate what graphics program was used to create the artwork.
For vector graphics, the preferred format is EPS; for halftones, please use TIFF format. MS Office files are also acceptable.
Vector graphics containing fonts must have the fonts embedded in the files. Name your figure files with "Fig" and the figure number, e.g., Fig1.eps. Line Art
26/02/13 European Journal of Applied Physiology – incl. option to publish open access
www.springer.com/biomed/human+physiology/journal/421?print_view=true&detailsPage=pltci_1060521 6/11
Definition: Black and white graphic with no shading.
Do not use faint lines and/or lettering and check that all lines and lettering within the figures are legible at final size.
All lines should be at least 0.1 mm (0.3 pt) wide.
Scanned line drawings and line drawings in bitmap format should have a minimum resolution of 1200 dpi.
Vector graphics containing fonts must have the fonts embedded in the files. Halftone Art
Definition: Photographs, drawings, or paintings with fine shading, etc.
If any magnification is used in the photographs, indicate this by using scale bars within the figures themselves.
Halftones should have a minimum resolution of 300 dpi.
26/02/13 European Journal of Applied Physiology – incl. option to publish open access
www.springer.com/biomed/human+physiology/journal/421?print_view=true&detailsPage=pltci_1060521 7/11
Definition: a combination of halftone and line art, e.g., halftones containing line drawing, extensive lettering, color diagrams, etc.
Combination artwork should have a minimum resolution of 600 dpi. Color Art
Color art is free of charge for online publication.
If black and white will be shown in the print version, make sure that the main information will still be visible. Many colors are not distinguishable from one another when converted to black and white. A simple way to check this is to make a xerographic copy to see if the necessary distinctions between the different colors are still apparent.
If the figures will be printed in black and white, do not refer to color in the captions. Color illustrations should be submitted as RGB (8 bits per channel).
Figure Lettering
To add lettering, it is best to use Helvetica or Arial (sans serif fonts).
Keep lettering consistently sized throughout your final-sized artwork, usually about 2–3 mm (8–12 pt).
Variance of type size within an illustration should be minimal, e.g., do not use 8-pt type on an axis and 20-pt type for the axis label.
Avoid effects such as shading, outline letters, etc. Do not include titles or captions within your illustrations. Figure Numbering
All figures are to be numbered using Arabic numerals.
Figures should always be cited in text in consecutive numerical order. Figure parts should be denoted by lowercase letters (a, b, c, etc.).
If an appendix appears in your article and it contains one or more figures, continue the consecutive numbering of the main text. Do not number the appendix figures,
26/02/13 European Journal of Applied Physiology – incl. option to publish open access
www.springer.com/biomed/human+physiology/journal/421?print_view=true&detailsPage=pltci_1060521 8/11
"A1, A2, A3, etc." Figures in online appendices (Electronic Supplementary Material) should, however, be numbered separately.
Figure Captions
Each figure should have a concise caption describing accurately what the figure depicts. Include the captions in the text file of the manuscript, not in the figure file. Figure captions begin with the term Fig. in bold type, followed by the figure number, also in bold type.
No punctuation is to be included after the number, nor is any punctuation to be placed at the end of the caption.
Identify all elements found in the figure in the figure caption; and use boxes, circles, etc., as coordinate points in graphs.
Identify previously published material by giving the original source in the form of a reference citation at the end of the figure caption.
Figure Placement and Size
When preparing your figures, size figures to fit in the column width.
For most journals the figures should be 39 mm, 84 mm, 129 mm, or 174 mm wide and not higher than 234 mm.
For books and book-sized journals, the figures should be 80 mm or 122 mm wide and not higher than 198 mm.
Permissions
If you include figures that have already been published elsewhere, you must obtain
permission from the copyright owner(s) for both the print and online format. Please be aware that some publishers do not grant electronic rights for free and that Springer will not be able to refund any costs that may have occurred to receive these permissions. In such cases,
material from other sources should be used. Accessibility
In order to give people of all abilities and disabilities access to the content of your figures, please make sure that
All figures have descriptive captions (blind users could then use a text-to-speech software or a text-to-Braille hardware)
Patterns are used instead of or in addition to colors for conveying information (color-blind users would then be able to distinguish the visual elements) Any figure lettering has a contrast ratio of at least 4.5:1
ELECTRONIC SUPPLEMENTARY MATERIAL
Springer accepts electronic multimedia files (animations, movies, audio, etc.) and other
supplementary files to be published online along with an article or a book chapter. This feature can add dimension to the author's article, as certain information cannot be printed or is more convenient in electronic form.
Submission
Supply all supplementary material in standard file formats.
Please include in each file the following information: article title, journal name, author names; affiliation and e-mail address of the corresponding author.
To accommodate user downloads, please keep in mind that larger-sized files may require very long download times and that some users may experience other problems during
26/02/13 European Journal of Applied Physiology – incl. option to publish open access
www.springer.com/biomed/human+physiology/journal/421?print_view=true&detailsPage=pltci_1060521 9/11
downloading.
Audio, Video, and Animations
Always use MPEG-1 (.mpg) format. Text and Presentations
Submit your material in PDF format; .doc or .ppt files are not suitable for long-term viability. A collection of figures may also be combined in a PDF file.
Spreadsheets
Spreadsheets should be converted to PDF if no interaction with the data is intended. If the readers should be encouraged to make their own calculations, spreadsheets should be submitted as .xls files (MS Excel).
Specialized Formats
Specialized format such as .pdb (chemical), .wrl (VRML), .nb (Mathematica notebook), and .tex can also be supplied.
Collecting Multiple Files
It is possible to collect multiple files in a .zip or .gz file. Numbering
If supplying any supplementary material, the text must make specific mention of the material as a citation, similar to that of figures and tables.
Refer to the supplementary files as “Online Resource”, e.g., "... as shown in the animation (Online Resource 3)", “... additional data are given in Online Resource 4”.
Name the files consecutively, e.g. “ESM_3.mpg”, “ESM_4.pdf”. Captions
For each supplementary material, please supply a concise caption describing the content of the file.
Processing of supplementary files
Electronic supplementary material will be published as received from the author without any conversion, editing, or reformatting.
Accessibility
In order to give people of all abilities and disabilities access to the content of your supplementary files, please make sure that
The manuscript contains a descriptive caption for each supplementary material
Video files do not contain anything that flashes more than three times per second (so that users prone to seizures caused by such effects are not put at risk)
INTEGRITY OF RESEARCH AND REPORTING
Ethical standards
Manuscripts submitted for publication must contain a declaration that the experiments comply with the current laws of the country in which they were performed. Please include this note in a separate section before the reference list.
26/02/13 European Journal of Applied Physiology – incl. option to publish open access
www.springer.com/biomed/human+physiology/journal/421?print_view=true&detailsPage=pltci_1060521 10/11
Authors must indicate whether or not they have a financial relationship with the organization that sponsored the research. This note should be added in a separate section before the reference list.
If no conflict exists, authors should state: The authors declare that they have no conflict of interest.
DOES SPRINGER PROVIDE ENGLISH LANGUAGE SUPPORT?
Manuscripts that are accepted for publication will be checked by our copyeditors for spelling and formal style. This may not be sufficient if English is not your native language and substantial editing would be required. In that case, you may want to have your manuscript edited by a native speaker prior to submission. A clear and concise language will help editors and reviewers concentrate on the scientific content of your paper and thus smooth the peer review process.
The following editing service provides language editing for scientific articles in all areas Springer publishes in.
Use of an editing service is neither a requirement nor a guarantee of acceptance for publication. Please contact the editing service directly to make arrangements for editing and payment. For Authors from China
文章在投稿前进行专业的语言润色将对作者的投稿进程有所帮助。作者可自愿选择使用Springer推荐的编 辑服务,使用与否并不作为判断文章是否被录用的依据。提高文章的语言质量将有助于审稿人理解文章的 内容,通过对学术内容的判断来决定文章的取舍,而不会因为语言问题导致直接退稿。作者需自行联系 Springer推荐的编辑服务公司,协商编辑事宜。
理文编辑
For Authors from Japan
ジャーナルに論文を投稿する前に、ネイティブ・スピーカーによる英文校閲を希望されている方には、Edanz社
をご紹介しています。サービス内容、料金および申込方法など、日本語による詳しい説明はエダンズグループ ジャパン株式会社の下記サイトをご覧ください。
エダンズ グループ ジャパン
For Authors from Korea
영어 논문 투고에 앞서 원어민에게 영문 교정을 받고자 하시는 분들께 Edanz 회사를 소개해 드립니다. 서 비스 내용, 가격 및
신청 방법 등에 대한 자세한 사항은 저희 Edanz Editing Global 웹사이트를 참조해 주시면 감사하겠습니 다.
Edanz Editing Global
AFTER ACCEPTANCE
Upon acceptance of your article you will receive a link to the special Author Query Application at Springer’s web page where you can sign the Copyright Transfer Statement online and indicate whether you wish to order OpenChoice, offprints, or printing of figures in color. Once the Author Query Application has been completed, your article will be processed and you will receive the proofs.
Open Choice
In addition to the normal publication process (whereby an article is submitted to the journal and access to that article is granted to customers who have purchased a subscription), Springer provides an alternative publishing option: Springer Open Choice. A Springer Open Choice article receives all the benefits of a regular subscription-based article, but in addition