Repositório ISCTE-IUL
Deposited in Repositório ISCTE-IUL:
2019-03-08
Deposited version:
Post-print
Peer-review status of attached file:
Peer-reviewed
Citation for published item:
Ramalho, J. J. S., Rita, R. M. S. & da Silva, J. V. (2018). The impact of family ownership on capital structure of firms: exploring the role of zero-leverage, size, location and the global financial crisis. International Small Business Journal. 36 (5), 574-604
Further information on publisher's website:
10.1177/0266242617753050
Publisher's copyright statement:
This is the peer reviewed version of the following article: Ramalho, J. J. S., Rita, R. M. S. & da Silva, J. V. (2018). The impact of family ownership on capital structure of firms: exploring the role of zero-leverage, size, location and the global financial crisis. International Small Business Journal. 36 (5), 574-604, which has been published in final form at https://dx.doi.org/10.1177/0266242617753050. This article may be used for non-commercial purposes in accordance with the Publisher's Terms and Conditions for self-archiving.
Use policy
Creative Commons CC BY 4.0
The full-text may be used and/or reproduced, and given to third parties in any format or medium, without prior permission or charge, for personal research or study, educational, or not-for-profit purposes provided that:
• a full bibliographic reference is made to the original source • a link is made to the metadata record in the Repository • the full-text is not changed in any way
The full-text must not be sold in any format or medium without the formal permission of the copyright holders.
Serviços de Informação e Documentação, Instituto Universitário de Lisboa (ISCTE-IUL) Av. das Forças Armadas, Edifício II, 1649-026 Lisboa Portugal
The Impact of the Global Financial Crisis, Firm Size and Location on
Family Firm Capital Structure
Joaquim J.S. Ramalho
Department of Economics and Business Research Unit (BRU-IUL), Instituto Universitário de Lisboa (ISCTE-IUL),
Address: Avenida das Forças Armadas, 1649-026 Lisboa, Portugal Email: [email protected]; Telephone: +351 217650595
Rui M.S. Rita
School of Business Science, Setúbal Polytechnic Institute
Address: Campus do IPS – Estefanilha, 2910 503 Setúbal, Portugal Email: [email protected]; Telephone: +351 265709300
Jacinto Vidigal da Silva
Department of Management and CEFAGE, University of Évora
Address: Largo dos Colegiais 2, 7004-516 Évora, Portugal Email: [email protected]; Telephone: +351 266740800
Abstract
In this article we investigate the influence of family ownership on firm leverage across different sub-groups of family and non-family firms. In addition, we examine the influence of firm size, geographical location and the 2008 global financial crisis on the capital structure of family firms. In both cases, we study the probability of firms using debt and, conditional on its use, the proportion of debt issued. We find that family ownership affects both decisions positively, namely when the firm is large or located in a metropolitan area. For small firms located outside metropolitan areas there is no clear family ownership effect. We also find the 2008 crisis had a substantial, but diversified, impact on family firm leverage. On the one hand, all family firms were more prone to use debt after 2008; on the other, the proportion of debt held by levered family firms decreased for micro and small firms, but increased for large firms. Overall, the crisis effects on family firm leverage seem to be the result of both supply- and demand-side factors, with the former particularly affecting the availability of debt to micro and small firms.
Keywords: family firms, capital structure, zero leverage, firm size, geographical location,
1. Introduction
Due to the great heterogeneity of firms with a family influence, there is no consensual definition of a family firm.1 However, irrespective of the definition adopted, it is clear that family firms are the most prevalent form of business organisation, with it being estimated that in most countries around the world between 70 and 95% of all firms are family-owned (European Family Businesses, 2012). Family firms employ 50–80% of the workforce in the private sector, contribute to non-governmental GDP between a minimum of 60% and a maximum of 90%, and 85% of all business start-ups are started with family money (European Family Businesses, 2012). Family firms are clearly important for economic growth (Carsrud and Cucculelli, 2014; Memili et al., 2015) and also for regional and local development (Basco, 2015; Block and Spiegel, 2013).
Given their relevance, the ability of family firms to be successful is essential for economic development. Some suggest that family firms have unique characteristics which, in some circumstances, provide potential advantages over non-family firms in terms of performance and competitiveness (Anderson and Reeb, 2003a; Hoffmann et al., 2016), survival and longevity (Miller et al., 2008; Revilla et al., 2016), entrepreneurial activities (Aldrich and Cliff, 2003; Carsrud and Cucculelli, 2014) and output innovation (Duran et al., 2016; Matzler et al., 2015). Nevertheless, it seems that one of the main challenges faced by family businesses is access to funding (Michiels and Molly, 2017). As family firms are also often skeptical about the deployment of external funding (Croce and Martí, 2016; Koropp et al., 2014), they may end up with a capital structure that is not the most appropriate for stimulating firm growth and sustainability. Therefore, an important research priority is to investigate family firm financing behaviour and whether it differs from that of non-family firms due to its specific characteristics.2
There are many studies on the impact of family ownership on firm financing decisions, namely on their debt-equity mix. However, so far, the evidence provided is mixed, as the following examples illustrate: (i) Agrawal and Nagarajan (1990) found that all-equity listed USA firms exhibit more extensive family involvement than levered firms. McConaughy et al. (2001) observed more conservative levels of debt in large family firms in the USA; (ii) Coleman and Carsky (1999) found virtually no differences between family-owned and non-family-owned small US businesses in the usage of various credit products. Anderson and Reeb (2003b) reported that S&P 500 family firms use similar levels of debt to non-family firms; and (iii) King and Santor (2008) showed that Canadian publicly listed family firms
display higher financial leverage than their non-family counterparts. Schmid (2013) found a similar result for several countries in East Asia and Western Europe. These conflicting findings may be due to a variety of reasons, such as the use of different definitions of family firms. The different economic and institutional contexts of the firms analysed in each study for example, different countries, different time frames, and the focus on particular groups of firms for example, small or large firms, are other possible explanations for divergent results. Thus, the findings described in the literature as universal for family firms may actually be valid only for specific family businesses in particular settings.
Another limitation is that recent developments in the general capital structure literature have not yet been applied to family firm studies. For example, we are not aware of a single study focussing on family firms that allows the determinants of the probability of using debt to be different from those that explain the amount of debt issued (Cook et al., 2008; Ramalho and Silva, 2009). Moreover, the analysis of the capital structure decisions of family firms is never conditioned on the geographical location of firms inside a country (Arena and Dewally, 2012; John et al., 2011). Finally, the so-called fractional regression models that take into account the proportional nature of the leverage ratios usually employed as dependent variables in capital structure econometric models (Chauhan and Huseynov, 2017; Ramalho and Silva, 2009, 2013) have never been applied in the context of family firms.
The main aim of this article is to provide further insights into the effects of family ownership on capital structure and also, of firm size, geographical location and the 2008 global financial crisis on the capital structure of family firms. Similarly to most previous studies, we use a single definition of family firm, considering a firm to be family-owned when one individual or a family owns at least 50% of the capital and at least one family member is present in the governing body. We also use data for a single country, Portugal, where family businesses account for 70% to 80% of the business sector, around two thirds of GNP and 50% of employment (European Commission, 2008). However, in order to overcome most of the limitations identified above, our approach differs from previous empirical studies on family business finance in a number of ways.
The first major difference concerns the dataset used, which comprises family and non-family firms of all sizes. The sample is partitioned into micro, small and large firms, which allows us to investigate whether the effect of family ownership on firm capital structure differs across these size-based groups of firms. As far as we know, this issue has not been directly investigated as most previous studies focused either on small (Basco, 2014; Memili et al., 2015) or large family firms (Keasey et al, 2015; Croci et al., 2011), which means that the
effects of family ownership and firm size on capital structure decisions may not have been properly disentangled yet. Indeed, family-owned firms have distinct characteristics and aims, such as overlapping roles between family membership and management (Dana and Smyrnos, 2010; Revilla et al., 2016) and succession priorities (Helin and Jabri, 2016; Lefebvre and Lefebvre, 2016), differentiating them from non-family firms, irrespective of dimension.
A second difference between this article and previous approaches is that we investigate the zero-leverage behaviour common to many firms but not studied in the literature on the financing decisions of family-owned firms. Some (Ramalho and Silva, 2009; Strebulaev and Yang, 2013) have recently argued that zero-leverage behaviour is a persistent phenomenon; as such, the factors determining whether a firm uses debt may be different from those that determine how much is actually used by firms who do use debt. We investigate whether zero-leverage is also common behaviour in family-owned firms by estimating separately the influence of family ownership on both the participation - to use debt or not - and amount - if using debt, how much to use - decisions.
There is some evidence in the financial literature that firm access to different financial options varies greatly depending on where the firm is located in terms of urban or rural areas, and how far it is from a major metropolitan area (Arena and Dewally, 2012; John et al., 2011). Most of these analyses focus on small firms (Agostino et al., 2011; Iturralde et al., 2010), but we lack studies on the effect of firm location on family firm capital structure. This is somewhat surprising, since several papers discuss how location affects many other economic characteristics of family firms (Backman and Palmberg, 2015; Bird and Wennberg, 2014; Block and Spiegel, 2013). Consequently, we use a sample comprising family and non-family firms from different regions and analyse whether the family ownership effect on financial leverage changes across different geographical locations, which is the third major contribution of this study.
Because our sample relates to the period 2006-2012, covering pre- and post-crisis years, we are also able to examine how the recent global financial crisis affected the capital structure and financing decisions of family and non-family firms. There are several studies analysing the effects of financial crises on capital structure decisions, including the 2008 crisis (Cowling et al., 2012; Dang et al., 2014; McGuinness and Hogan, 2016; Van Hoang et al., 2017; Vermoesen et al., 2013), but, to the best of our knowledge, only a few focused on the impact of this recent crisis on the financing decisions of family firms (Arrondo-García et al., 2016; Crespí and Martín-Oliver, 2015; D'Aurizio et al., 2015). Thus, providing further evidence on how family and non-family firm access to funding changed during the recent global financial
crisis is our fourth major contribution. Given that Portugal was one of the countries in the European Union most affected by the recent global financial crisis, with a severe impact upon the banking sector, the main provider of external funds for Portuguese non-financial firms, our data is appropriate for such an analysis.
Our final major contribution concerns the econometric methodology employed. We use random-effects binary choice models (Wooldridge, 2010) to explain the probability of a firm using debt and linearized random-effects fractional regression models (Ramalho et al., 2017) to explain the proportion of debt held by levered firms. This econometric methodology suits the panel structure of the data and, unlike linear regression models, takes into account the bounded, proportional nature of the leverage ratio we use in the fractional regression models as dependent variable. While ‘two-part’ (binary + fractional) regression models have already been used in the capital structure literature (Cook et al., 2008; Ramalho and Silva, 2009), to our knowledge, this is their first application in a panel data context and to family firms.
The article is organised as follows. Section 2 applies the most common capital structure theories to the specific context of family-owned firms and formulates the empirical hypotheses about their financing behaviour. Section 3 describes the sample and performs a preliminary analysis of the impact of family ownership on financial leverage. Section 4 discusses the econometric methodology used and presents the main empirical results obtained. Section 5 concludes.
2. Family Ownership and Capital Structure: Theory and Empirical Hypotheses
Throughout this section, accompanying the theoretical discussion, we present a number of empirical hypotheses. Some of those hypotheses concern the behaviour of family and non-family firms, representing conjectures about the influence of the non-family ownership factor on firm capital structure, both in general terms and for particular groups of firms. The other empirical hypotheses focus on the effects of firm size, zero-debt policies, geographical location and the 2008 crisis on the financial leverage of family firms.
2.1. The Classical Capital Structure Theories in the Context of Family Firms
Pecking order theory (Myers, 1984; Myers and Majluf, 1984) is one of the most popular capital structure theories. According to this theory, firms tend to adopt a perfect hierarchical order of financing: first, they use internal resources and then, if external financing is required, they prefer debt to outside equity. In general, this behaviour is explained in terms of
information asymmetries between managers and potential outside financiers, which limit access to external finance. In the context of family businesses, the same reasoning obviously applies and, in fact, it has been found that for these firms, due to greater potential for expropriation, the cost of external finance is more sensitive to informational opacity (Chen et al., 2014; Ma et al., 2017). In addition, specific demand-side issues related to the characteristics of family businesses may be put forward to reinforce the importance of pecking-order theory in this particular framework. This occurs as one of the distinctive features of family firms is that managers are often owners; this suggests they have a greater ability to modify a firm’s asset portfolio to use benefits and channel funds to themselves, and the family (Ramalho and Silva, 2009; Roger and Schatt, 2016). Therefore, to preserve this situation, the financing decisions of owner-managers are frequently driven by the desire to minimise interference in their businesses and avoid the discipline inherent to the use of external funds (Koropp et al., 2014). Moreover, succession is one of the main concerns in family firms (Brenes et al., 2011). Thus, family firms tend to be more conservative and seek less external finance, even if that means the loss of growth opportunities, to prevent dilution of family control and avoid jeopardising future generations (Blanco-Mazagatos et al., 2007). Hence, retained earnings and personal savings are preferred financing sources and, if internal funds are required, debt is preferred to outside equity given lower levels of intrusion and erosion of control and decision-making power.
Agency costs theory (Jensen and Meckling, 1976) states that the optimal capital structure of each firm depends on the value of debt that mitigates conflicts between stockholders and managers, on the one hand, and stockholders and debtholders, on the other. In the specific context of family firms, the former type of agency cost is expected to be minimal, since concentrated ownership and owner-management naturally aligns owner-manager interests concerning growth opportunities and risk. Therefore, the incentives to issue debt as a means of reducing the free cash at manager disposal are much less important for family firms. In contrast, that same close alignment of management and shareholder interests, and the consequent added flexibility of changing the asset base and greater opportunity to consume perquisites, exacerbates the debtholder-shareholder conflict in family firms. This arises from parental altruism and self-control problems (Schulze et al., 2001), implying higher monitoring costs. Hence, more stringent lending conditions, such as a higher interest rate (Lin et al., 2011) or more collateral requirements (Steijvers and Voordeckers, 2009), may be imposed by lenders on family firms. Clearly, combining both types of agency costs, family firms are expected to use less external finance than their non-family counterparts. However, this
negative effect of family control on the use of debt may be attenuated by other characteristics of family firms and family shareholders such as undiversified portfolios, concern about firm and family reputation, longer investment horizons, and succession. If these are recognised by the lender, they may reduce monitoring costs and contribute to more favourable lending conditions. Indeed, debt holders may view family ownership as protective of their interests by ensuring continuity and stability. Crespí and Martín-Oliver (2015) provides evidence that family ownership is associated with greater availability of credit and Anderson et al. (2003) and Ma et al. (2017) find a lower cost of debt financing for family firms.
Regarding trade-off theory, its central aspect is that firms set a target level for their debt-equity ratio that balances the tax advantages of additional debt (Modigliani and Miller, 1958) against the costs of possible financial distress and bankruptcy originated by excessive debt (Kraus and Litzenberger, 1973). It is suggested that family firms use resources more efficiently (Lee, 2006; Maury, 2006), which may include the development of strategies based on debt usage aimed at reducing the tax burden. However, Chen et al. (2010) find that family firms are less tax aggressive than their non-family counterparts. Moreover, the costs of insolvency tend to be higher for family firms because of the greater involvement of family owners in their businesses (Blanco-Mazagatos et al., 2007). Indeed, loss of esteem, self-employment and personal assets are particularly relevant issues for family firms. Overall, trade-off theory suggests that ceteris paribus family firms may have a different optimal capital structure, but it is not clear whether the specificities of family firms will lead them to use more or less external finance.
In this article, first, we are interested in investigating whether there is a relationship between family ownership and debt usage, irrespective of its sign. Based on the previous arguments, a positive, negative or no relationship are all plausible situations. There is no particular reason to think a priori that in Portugal some of the arguments make more sense than others. Thus, the first hypothesis that we test is generic and may be formulated as follows:
Hypothesis 1: “Family ownership is a relevant factor in determining firm financing
decisions.”
Our second hypothesis is also generic and regards the stability of the relationship between family ownership and capital structure across different groups of firms. Most previous empirical studies on family firm capital structure focused on particular size-based groups of
firms. Moreover, they did not consider the recent global crisis, ignored the potential effects of the firm’s geographical location and treated levered and unlevered firms in a similar way. As such, they were unable to separate the effects of all these factors on capital structure choices. In contrast, we allow the influence of family ownership to change across the four cited factors and test the following hypothesis:
Hypothesis 2: “The influence of family ownership on firm financing decisions is stable
across: (a) micro/small/large firms; (b) levered/unlevered firms; (c) geographical locations; and (d) before/after the 2008 global financial crisis.”
2.2. Firm Size and Zero Leverage
Classical capital structure theories predict a positive relationship between debt usage and firm size. For instance, pecking-order theory predicts that larger firms find it easier to raise debt as informational asymmetries are less severe (Myers, 1984). Agency problems between managers and debt holders can be more serious due to the closely knit nature of small firms, implying greater monitoring costs (Michaelas et al., 1999). According to trade-off theory, as larger firms tend to be more diversified, their probability of bankruptcy is relatively lower (Warner, 1977). However, classical capital structure theories were originally developed for large, quoted companies. As argued by Scherr and Hulburt (2001), smaller firms are not simply larger firms scaled down: they differ, among other things, in taxability, flexibility, economies of scale, financial market access and ownership. Therefore, specific theories have been developed to explain the capital structure decisions of small firms.
Most of the theories focusing on small firms are also based on asymmetric information (Berger and Udell, 1998) and agency cost (Michaelas et al., 1999) arguments, concluding that they are more serious in the context of small businesses. As a consequence, due to the aggravated cost and lower availability of credit, the greater reliance of small firms on internal funds and other sources of finance (loans from friends and relatives, credit cards, supplier credit, leases, customer financing) is deemed to be externally imposed (Fraser et al., 2015; Manolova et al., 2014). It has also been noted that the decision of smaller firms of using less external funds may be driven by choice rather than by necessity (Coleman et al., 2016).
A problem with the literature on small business finance is that small firms are typically associated with family firms and therefore, the behaviour of the former is often explained using arguments that apply to the latter, but not to small non-family firms. Indeed, the family
ownership argument is commonly the main factor used to explain the aggravated agency problems of smaller firms (Michaelas et al., 1999) and small firm owner preference for internal finance (Ramalho and Silva, 2009). However, the majority of small firms are family businesses, but many have diverse ownership, as empirical studies using datasets comprising family and non-family small firms illustrate (Memili et al., 2015). Moreover, the proportion of large firms controlled by families is also relevant. For instance, Chen et al. (2014) report that 35.4% and 45.67% of the companies listed in the S&P 500 and S&P 1500 indices are family businesses.
Similarly, it has been relatively common to explain the financial behaviour of family businesses using arguments that apply directly to small firms, but not to family firms. For instance, when the analysis is restricted to a sample of small firms, it is often argued that ‘family firms have limited sources of external financial capital because (…) their size normally does not justify bond issues’ (Sirmon and Hitt, 2003, p. 343). However, this is a direct consequence of the dimension of the firm and not of its ownership, and so cannot be generalised to any type of family firm. Therefore, it is important to control for firm size to investigate what is the actual effect of family ownership on capital structure, as we do by allowing that effect to change across micro, small and large firms (see Hypothesis 2a above).
It has been noted that the conjectured positive effect of firm size on leverage actually becomes negative when unlevered firms are excluded from the analysis. In particular, Kurshev and Strebulaev (2007), Ramalho and Silva (2009) and Strebulaev and Yang (2013) found that while larger firms are more likely to have some debt, conditional on debt issuance, larger firms are typically less leveraged. Moreover, Strebulaev and Yang (2013) provided evidence that zero-leverage behaviour is an important and persistent phenomenon. Overall, these findings suggest that firm size may affect decisions on whether to issue debt and the amount of that debt in inverse ways: on the one hand, it influences positively the probability of a firm having debt; on the other, it negatively affects the relative amount of debt issued by levered firms.
Clearly, none of the above capital structure theories can explain this double effect of firm size on leverage. In theoretical terms, a possible explanation based on the costs of external financing was outlined by Kurshev and Strebulaev (2007). First they argued that as smaller firms are more affected, in relative terms, by the existence of fixed costs in debt issuance, they opt more frequently for no leverage and have longer intervals between re-financing. This explains the positive effect of firm size on the debt participation decision. Second, smaller
firms choose higher leverage at the moment of refinancing to compensate for less frequent rebalancing, which explains the negative effect of firm size on the debt amount decision.
Kurshev and Strebulaev’s (2007) ‘two-part theory’ relies exclusively on firm size: smaller firms are more affected by the existence of fixed costs in debt issuance. Because this is true irrespective of a firm being family-owned or not, we conjecture that the theory applies to all types of firms. Therefore, in addition to investigating whether the family ownership effect is stable across levered and unlevered firms (see Hypothesis 2b), we also test the following hypothesis:
Hypothesis 3: “Firm size affects: (a) positively, the probability of family firms using debt;
and (b) negatively, the proportion of debt issued by levered family firms.”
2.3. Geographical Location
It has been argued that capital structure may also depend on geographical location. Degryse and Ongena (2005) find that increasing distance between the borrower and alternative lenders significantly relaxes price competition and results in substantially higher borrowing costs for the firm. John et al. (2011) show that remotely located firms have higher information asymmetry levels for outside investors and, hence, a higher likelihood of pre-committing to a higher proportion of debt and dividends to mitigate managerial agency conflicts. Arena and Dewally (2012) argue that firms in rural areas have a cost disadvantage in credit markets, facing higher debt yield spreads, but are more likely to rely on relationship banking, repeatedly borrowing from the same banks. In fact, relationship banking (Han et al., 2017; Hasan et al., 2017) seems to be particularly important in less-urbanized areas, where interactions between loan officers and firm managers tend to be more frequent and fruitful, leading to the collection of better soft information. The main benefit of building close ties between firms and creditors is that the availability of financing increases (Petersen and Rajan, 1994).
There is also some evidence that geographical location affects family and non-family firms in distinct ways. According to Bird and Wennberg (2014) and Backman and Palmberg (2015), family firms generally appear to have strong local roots, being more locally embedded in the region due to their historical, social and cultural connections. Therefore, family firms are able to leverage personal relationships to a greater extent and establish more durable relationships with their regional communities. This offers them a competitive advantage to
create, develop and allocate resources. This advantage is particularly important in rural regions, often characterised by resource scarcity and where, as discussed above, funding is often based on relationship banking. In contrast, in urban contexts, firms are more exposed to the anonymity of densely-populated areas and hence, their local connections tend to be much less important for their performance. Indeed, in this distinct social context, stakeholders tend to benefit firms that prioritise economic and market-oriented goals, irrespective of their relevance for the region.
To the best of our knowledge, previous research has considered only the overall effect of geographical location on debt and has not distinguished between family and non-family firms. For example, considering both levered and unlevered firms, Arena and Dewally (2012) found that firms in small cities carry longer term debt than in more densely populated areas, while John et al., (2011) found that a central location has a negative relation with total, and long-term, leverage. In addition to testing whether leverage between family and non-family firms differs across geographical locations (see Hypothesis 2c), we conjecture that geographical location may influence family firms differently regarding the probability of using debt, and the amount of debt issued. In particular, we hypothesise that the relationship banking that seems to be more favourable to firms located in non-metropolitan areas will significantly increase the likelihood of family firms using debt by partially compensating for their higher informational opacity. However, because the increased use of soft information is not expected to substantially reduce the higher debt yield spreads expected in non-metropolitan areas, we conjecture that levered family firms in metropolitan areas hold a higher proportion of debt in their capital structure. Thus, we formulate the following hypothesis:
Hypothesis 4: “Relative to firms located in less urbanised areas, family firms in densely
populated areas: (a) are less prone to use debt; and (b) conditional on having debt, use it in a higher proportion.”
2.4. The Global Financial Crisis
There is a substantial literature on the economic consequences of financial crises. In general, any financial crisis reduces the capacity of firms to self-finance and access to bank credit and new equity (Lemmon and Roberts, 2010; Chava and Purnanandam, 2011), often leading to debt crises (Levy-Yeyate and Panniza, 2011; Furceri and Zdzienicka, 2012).
The 2008 U.S. subprime crisis was transformed into a sovereign debt crisis in 2010 in several European countries, including Portugal, which had to apply for a bail-out programme in 2011. There are already various studies on the consequences of the crisis initiated in 2008 on leverage decisions. Most suggest that small firms were particularly affected by the crisis. For example, Cowling et al. (2012) concluded that lending institutions appear to have used firm size as their primary lending criterion, with micro-business in particular being restricted regarding access to capital. Vermoesen et al. (2013) found that, in Belgium, the reduction in the credit supply originated by the global financial crisis had a greater impact on small firm investment due to their lower financing capacity. Dang et al. (2014) presented evidence that this crisis had a greater impact on the financing policies of firms with more debt, less size and greater information asymmetry. Finally, Van Hoang et al. (2017) reported that the external leverage of French micro-enterprises was reduced during the crisis.
The literature on the effects of the 2008 financial crisis on family firm leverage is more sparse, with only two studies comparing the capital structure of family and non-family firms over the crisis period. Both D'Aurizio et al. (2015), for Italy, and Crespí and Martín-Oliver (2015), for Spain, found that credit to family firms contracted less sharply than that to non-family firms. We test whether the non-family ownership effect on leverage remained stable over the crisis years, as conjectured in Hypothesis 2d. In addition, we posit that the global financial crisis may have had a double effect on family firm capital structure. Given the associated economic crisis, the internal resources generated by firms are expected to have diminished, which may have, for the first time, forced some to resort to debt. Conversely, the reduction in the credit supply originated by the global financial crisis is expected to have reduced the amount of debt held by firms, especially smaller firms. Thus, we formulate the following hypothesis:
Hypothesis 5: “The 2008 global financial crisis: (a) positively affected the probability of
family firms using debt, especially in the case of small firms; and (b) decreased the proportion of debt used by levered family firms, especially in the case of small firms.”
3. Data and Descriptive Statistics
3.1. Sample
The dataset was taken from the SABI database3, from which some information was extracted about balance sheets, income statements, shareholders and other characteristics of
Portuguese non-financial firms for the period 2006 to 2012. Firms with non-positive equity, sales or assets were discarded from the analysis as well as firms that were created in 2004 or later. Only firms without missing data for the whole seven year period were considered. The final sample contains 9220 firms and 64540 observations.
There is no consensus in the empirical literature about how a family firm should be defined, but, typically, criteria related to firm management, ownership and/or control have been used; see González et al. (2013). The information available on SABI, which includes the types of shareholders, the names of each shareholder and respective number of shares held and the names of those on the board of directors and management of each firm, allows us to consider those three perspectives. Thus, we classify as a family firm all firms that meet the following three criteria: (i) are included by SABI in the shareholder category of ‘one or more known individuals or families’; (ii) the named individual or families control more than 50% of the capital; and (iii) the individual or at least one family member is on the board of directors or in management posts. As a result of this definition, our sample comprises 4752 family firms and 4468 non-family firms. In the family firms, family members possess on average 88% of the capital and the average number of owners, managers and managers/owners is, respectively, 3.5, 3.7 and 1.4.
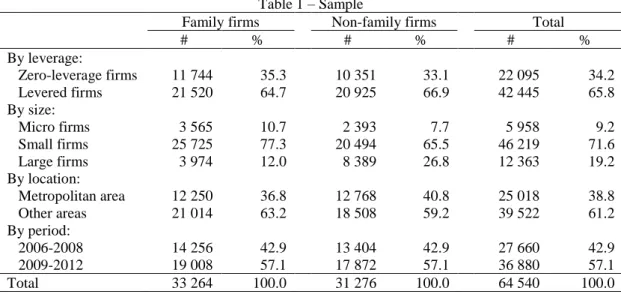
To clarify the effect of the size factor on financial leverage, the sample was divided into three size-based groups (micro, small and large firms) according to the criteria defined by the European Commission (Recommendation 2003/361/EC), which was independently applied in each year.4 Thus, a firm was classified as micro (small) in each year if it reported a number of employees under 10 (50) and annual turnover or total assets no greater than 2 (10) million euros. Otherwise, it was classified as a large firm. In each year, our sample comprises 629 - 1150 micro firms, 6400 - 6805 small firms and 1670 - 1824 large firms. Overall, 5958 observations are relative to micro firms, 46219 to small firms and 12363 to large firms; see Table 1, which contains the breakdown of the sample by size and other factors. Most firms are classified as micro or small (80.8%), particularly in the case of family firms (88.0%). Nevertheless, around 32.1% of large firms are family-owned and about 43.9% of micro and small firms are classified as non-family firms, so this sample is sufficiently diversified to allow us to analyse the separate effects of family ownership and firm size on capital structure choices.
To study the effect of geographical location on financial leverage, we partitioned the sample into two groups, classifying the firm as being in a metropolitan area or not. In particular, we consider as being located in a metropolitan area all firms in the functional regions of Lisbon and Oporto, which include not only the municipalities with the same names, but also their suburb municipalities that share a common market for labour, housing and household and company services. Similar definitions have been used in corporate finance studies using USA (Arena and Dewally, 2012; John et al., 2011), French (Boubaker et al, 2015) or Swedish (Backman and Palmberg, 2015) data. Our sample comprises 3574 firms located in a metropolitan area (38.8%) and 5646 outside (61.2%). Non-family firms are predominant in the former area, while family firms are more common in the latter.
The sample includes 27660 observations relative to the pre-crisis period (2006-2008) and 36880 to the years 2009-2012. Given that firms in general display reasonably fast debt adjustments toward some target leverage5, the collected sample will also allow us to estimate the effects of the recent global financial crisis on financial leverage. Similar time spans for studying the effects on capital structure of this financial crisis were considered inter alia by Arrondo-García et al. (2016), 2006-2011, Dang et al. (2014), 2002-2012, McGuinness and Hogan (2016), 2003-2011, and Vermoesen et al. (2013), 2006-2009.
As a summary measure of financing decisions, the ratio of long-term debt - debt with a maturity of more than one year - to long-term capital assets - defined as the sum of long-term debt and equity - is used. This measure of leverage was chosen because we are interested in the firm’s active capital structure choices, while a non-trivial portion of short-term liabilities may simply reflect daily business arrangements rather than financial considerations. See Welch (2011) for an explanation of why the denominator of leverage ratios in capital structure studies should be the sum of financial debt and equity rather than total assets, and Anderson et al. (2003) and Schmid (2013) for examples of analyses of long-term debt. As the sample contains mainly unquoted firms, the ratio was calculated based on book values. The sample contains a large proportion of unlevered firms (34.2%), which are present in similar proportions in both family and non-family firms.
3.2. Explanatory Variables
All econometric models estimated in Section 4 include as control variables several factors that are expected to influence financial leverage decisions. Size, measured by the natural logarithm of assets; Profitability, the ratio between earnings before interest and taxes and total
assets; Tangibility, the proportion of fixed assets in total assets; Growth, the yearly percentage change in total sales; Age, the number of years since the foundation of the firm; Liquidity, the sum of cash and marketable securities, divided by total assets; and eight industry dummies: Manufacturing Non Equipment; Manufacturing Equipment; Firm Services; Agriculture and Mining; Construction, Sales; Transportation; and Accommodation. Some of these variables are expected to have a positive impact on leverage ratios (Profitability, in the case of trade-off and agency costs theories; Growth, in pecking-order theory; Age, in agency costs theory; Liquidity, in trade-off theory; and Tangibility and Size, in all cases). Others are expected to have a negative effect (Growth, in trade-off and agency costs theories; Liquidity, in pecking-order and agency costs theories; and Profitability and Age, in pecking-pecking-order theory). See inter
alia Ramalho and Silva (2009) and the surveys by Prasade et al. (2005) and Frank and Goyal
(2008) for a detailed explanation of all these possible effects.
Given the focus of this paper, all estimated regression models also include the dummy variables Micro, Small, Metropolitan and 2009-2012, which equal one if the firm, respectively: can be classified as micro; can be classified as small; is located in a metropolitan area; is observed in the period 2009-2012.6 Otherwise, the value of each dummy variable is set to zero. In addition, some models also include the dummy variable Family and interactions between some dummy variables.
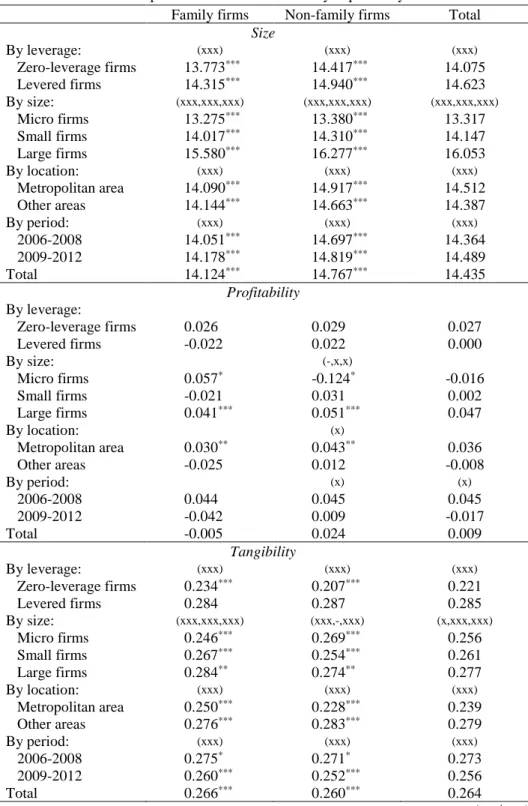
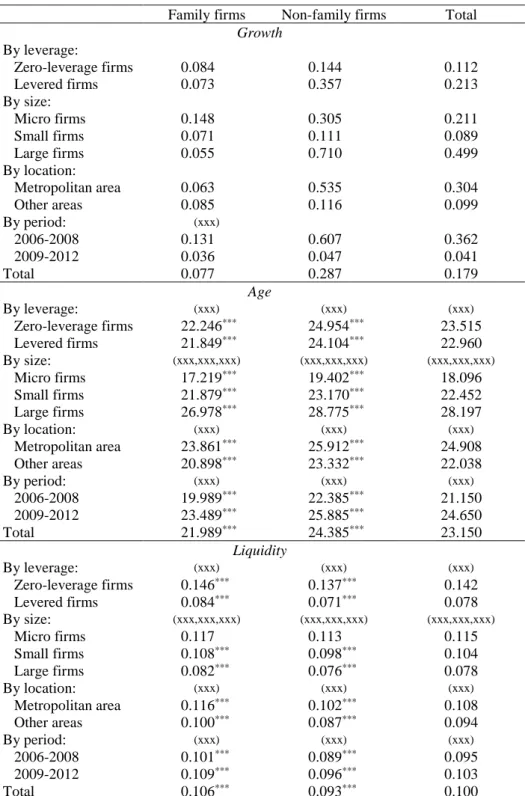
Table 2 reports the average values of the continuous explanatory variables and the results of t tests for the significance of the differences between several pairs of groups. Reflecting the empirical hypotheses formulated in Section 2, we perform two types of comparisons. On the one hand, we compare family and non-family firm average values across several dimensions, using stars to denote significant differences. On the other hand, we test whether zero-leverage, firm size, geographical location and the 2008 crisis produce significant differences, denoted by x’s, in the average values of the control variables inside the group of family firms - we also report results for non-family firms and all firms.
Table 2 about here
We find that most groups do not significantly differ in terms of profitability and growth, but differ systematically in terms of the other variables. Non-family firms have on average greater size and maturity, while family-owned firms present a higher level of liquidity and asset tangibility. Both family and non-family firms with zero-leverage ratios are smaller and older than the corresponding levered firms and have a smaller proportion of tangible assets
and greater liquidity. There are also significant differences between micro, small and large firms – larger firms have more tangible assets and are older and less liquid; across geographical locations - firms in metropolitan areas are larger, older and more liquid and have less tangible assets; and over time - after 2008, firms became less profitable, have a lower proportion of tangible assets and increased their size and liquidity. These differences across different groups of firms emphasise the importance of using regression analysis to study the effect of family ownership on capital structure choices.
3.3. The Impact of Family Ownership and Other Factors on Financial Leverage: A Preliminary Analysis
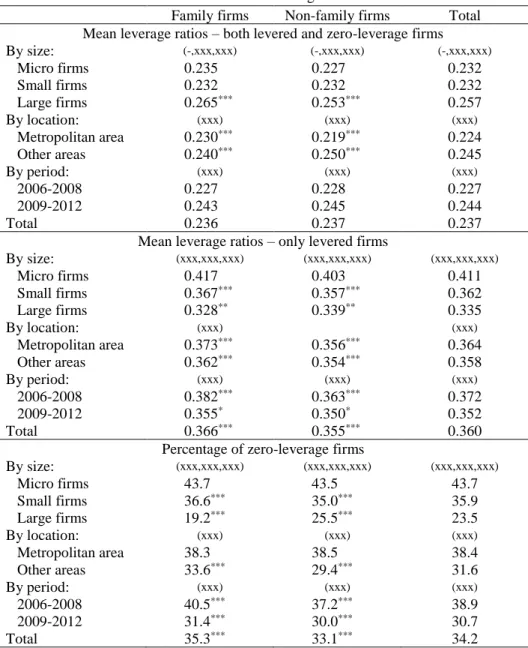
Table 3 presents the mean leverage ratio and the percentage of zero-leverage firms for different groups of firms and the results of t tests for the significance of the differences between those ratios or percentages for several pairs of groups. The analysis relative to mean leverage ratios is performed both for the whole sample and the sub-sample of levered firms.
Table 3 about here
Considering overall mean leverage ratios, we find no significant differences between family (0.236) and non-family (0.237) firms. However, these values are the final result of two distinct decisions: whether to use debt and how much debt to use. Interestingly, when we analyse each decision separately, we find significant differences between family and non-family firms: while non-non-family firms are significantly more prone to use debt - 66.9% versus 64.7% - levered family firms use on average more debt than their non-family counterparts - 0.366 versus 0.355. Similarly, when the analysis is restricted to specific sub-groups of family and non-family firms, the differences tend to be more relevant in the two-part scenario rather than in the overall case. Moreover, in general, the family ownership effect identified above seems to be valid for most sub-groups. The main exceptions are large firms, where the effect is opposite, and micro firms, where there are no significant differences between family and non-family businesses in both leverage decisions. Thus, this preliminary analysis supports
Hypothesis 1, since the differences between family and non-family firms are significant in
most cases, but not to Hypothesis 2, since the family ownership effect changes across size-based groups and levered / unlevered firms.
For all firms, it appears there is a strong size effect. However, like the family ownership factor, the size effect is not uniform across capital structure decisions. A significantly higher proportion of smaller firms are unlevered (positive size effect); however, conditional on the use of debt, the greatest leverage ratios are displayed by small firms (negative size effect). Therefore, the results in Table 2 support Hypothesis 3.
Regarding location, the differences between the leverage choices of firms in different geographical areas are significant in almost all cases. Family firms in metropolitan areas are significantly less prone to use debt but, when levered, exhibit higher mean leverage ratios than those located in other areas. Hence, Hypothesis 4 is also supported by these preliminary results.
The 2008 financial crisis significantly changed the mean leverage and the propensity to use debt in all types of firms. In all cases, the mean leverage ratios increased after the beginning of the crisis, which is a direct consequence of the significantly higher proportion of firms that used debt in 2009-2012. Indeed, when unlevered firms are excluded, mean leverage ratios become significantly lower after 2008. Therefore, it seems that after 2008 a larger number of firms resorted to debt, but in relatively smaller amounts, as predicted by
Hypothesis 5.
We find that in all dimensions of this study, the effect of each factor on the probability of using debt is the opposite of the effect on the mean leverage ratios of levered firms. The propensity to use debt is significantly higher for family firms, large firms, non-metropolitan firms and after the 2008 crisis. Yet, a higher proportion of debt is used by non-family firms, smaller firms, metropolitan firms and before the 2008 crisis. These conflicting results support recent studies (Ramalho and Silva, 2009; Strebulaev and Yang, 2013) suggesting that it is important to consider separately the decisions on whether to use debt and, conditional on the use of debt, how much to use.
4. Econometric Analysis
The relationships suggested by Table 3 may be due, at least partially, to other factors mentioned in the literature as being determinants of capital structure, such as the control variables described in Section 3.2. Moreover, we did not control simultaneously for firm size, firm location and the 2008 crisis. This section uses regression techniques to investigate whether, once all those factors are controlled for, the preliminary relationships discussed in
the previous section remain significant in explaining both the probability of a firm using debt and, conditional on the former decision, the amount of debt to use.
4.1. Econometric Models
We are interested in a discrete explanation of both the probability of a firm using debt and the relative amount of debt used by levered firms. Therefore, we use two different econometric models: for the former decision, binary choice models; for the latter decision, fractional regression models. In both cases, as we are mainly interested in the effects of mostly time-invariant dummy variables and we want to take into account the panel structure of the data, we consider only random-effects models. The other most common alternative panel data models either do not allow for time-constant explanatory variables (fixed-effects models) or do not allow for firm-specific effects, producing in general inconsistent estimators of regression coefficients in nonlinear models such as the binary models that we consider, even when those effects are uncorrelated with the explanatory variables of the models (pooled models).
Let y be the ratio of long-term debt to long-term capital assets, 0 ≤ y < 1, and z be a binary indicator that takes the values of unity and zero for levered and unlevered firms, respectively. Then:
𝑧 = {1 for 0 < 𝑦 < 1 0 for 𝑦 = 0
Random-effects binary choice models for the probability of observing a levered firm are given by:
𝑃𝑟(𝑧𝑖𝑡 = 1 | 𝑥𝑖𝑡, 𝛽) = 𝐺(𝑥𝑖𝑡𝛽 + 𝛼𝑖), 𝛼𝑖~𝑁(0, 𝜎𝛼2),
where 𝐺(∙) is a distribution function, 𝑥𝑖𝑡 is the vector of explanatory variables observed for firm 𝑖 in year t, 𝛽 is the vector of the parameters of interest and 𝜎𝛼2 is the variance of the firm-specific effects 𝛼𝑖, which are assumed to be normally distributed. This model isestimated by maximum likelihood.
Fractional regression models were first proposed by Papke and Wooldridge (1996) and further developed by Ramalho et al. (2011) and, for the case of panel data, by Ramalho et al. (2017). These models are specific for responses bounded in the unit interval, such as the leverage ratio considered in this study. Unlike the linear regression model, fractional regression models guarantee that the predicted values of the dependent variable lie between 0 and 1 and, thus, respect the proportional nature of leverage ratios. For some applications of
(cross-sectional) fractional regression models in the empirical capital structure literature, see Ramalho and Silva (2009, 2013) and Chauhan and Huseynov (2017).
The random-effects model proposed by Ramalho et al. (2017) is given by: 𝐸(𝑦𝑖𝑡|𝑥𝑖𝑡) = 𝐺(𝑥𝑖𝑡𝜃 + 𝛼𝑖),
where 𝐺(∙) is some nonlinear function satisfying 0 < 𝐺(∙) < 1 and, as such, may have the same specification as in binary regression models. Unlike the binary case, there are no simple methods to estimate directly this model. However, because we use fractional regression models to explain the mean debt issued by levered firms, estimation is performed based only on the sub-sample of firms that use debt. Thus, no boundary values are observed for 𝑦𝑖𝑡 and, see Ramalho et al. (2017), the following linearized random-effects model may be estimated:
𝐸[𝐻(𝑦𝑖𝑡)|𝑥𝑖𝑡] = 𝑥𝑖𝑡𝜃 + 𝛼𝑖, where 𝐻(∙) = 𝐺(∙)−1.
There are several alternative specifications for 𝐺(∙) and hence, 𝐻(∙). As shown by Ramalho et al. (2011), the most distinct results are obtained when we contrast symmetric specifications (logit, probit) with asymmetric ones (loglog, complementary loglog). Therefore, for both binary and fractional regression models, two alternative model specifications were considered to assess the robustness of our results: a logit specification, where 𝐺(𝑤) = 𝑒𝑤
(1+𝑒𝑤) and, hence, 𝐻(𝑦𝑖𝑡) = 𝑙𝑜𝑔
𝑦𝑖𝑡
1−𝑦𝑖𝑡; and a cloglog specification,
where 𝐺(𝑤) = 1 − 𝑒−𝑒𝑤 and, hence, 𝐻(𝑦𝑖𝑡) = 𝑙𝑜𝑔[−𝑙𝑜𝑔(1 − 𝑦𝑖𝑡)].
The suitability of each specification is assessed using a RESET test, which, in addition to being powerful against incorrect specification of 𝐺(𝑤) and 𝐻(𝑦𝑖𝑡), is able to detect a wide range of misspecifications, including omission of relevant (correlated or not with the included regressors) covariates. Thus, the RESET test also provides an indirect way of testing whether the unobserved firm-specific effects are correlated with the explanatory variables (fixed effects) or not (random effects) and is used instead of the more traditional Hausman test, which is not applicable in the binary panel data framework. See Ramalho and Ramalho (2012) for an analysis of the RESET test in the context of binary response models.
To test the stability of the regression coefficients across two groups of firms, we used a Chow-type test. See Ramalho and Silva (2013, Appendix A) for details on the application of this test in the framework of this study.
4.2.1. General Findings
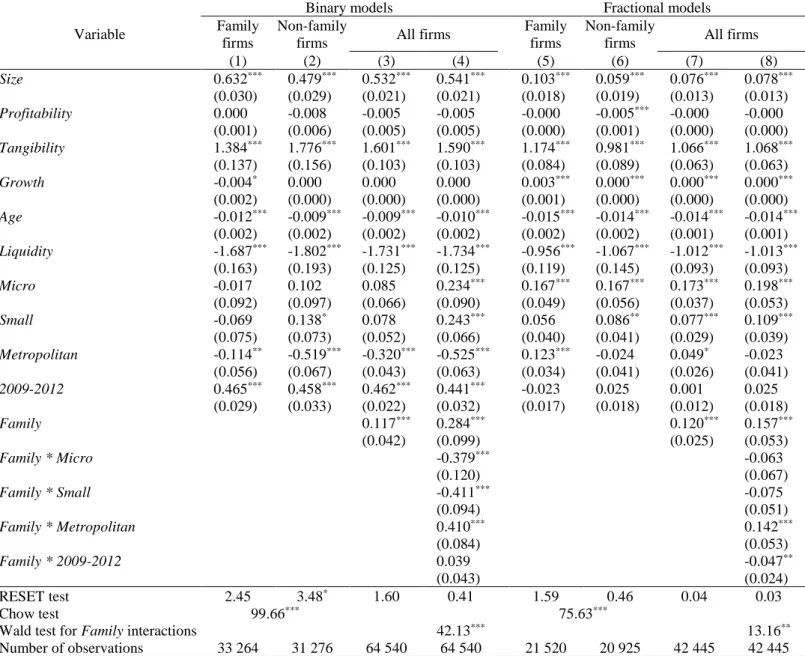
Table 4 reports the results obtained for cloglog random effects binary and fractional regression models.7 In each case, we estimated four alternative models. Models (1) and (5) were estimated using the sample of family firms, models (2) and (6) are based on the sub-sample of non-family firms, and models (3)-(4) and (7)-(8) consider the whole sub-sample, distinguishing between family and non-family firms by using only the dummy variable Family (models 3 and 7) or also their interactions with the other dummy variables (models 4 and 8). The RESET test only rejects the null hypothesis of correct specification of the estimated models in one case, and only at the 10% significance level, which means we can be reasonably confident that sound econometric models, from a statistical point of view, are used.
Table 4 about here
Regarding the classical, continuous explanatory variables, the eight models make identical predictions for the sign and statistical significance of their effects on leverage in most cases, suggesting that pecking-order theory provides a reasonable explanation of the capital structure decisions of Portuguese firms. Indeed, the effects on leverage of the control variables Size (+), Tangibility (+), Age (-) and Liquidity (-) are consistent, in both binary and fractional models, with pecking-order theory. As informational asymmetries between managers and outside investors are typically less severe for larger firms, these firms generally have better access to the debt market (Myers, 1984). Firms with a larger proportion of tangible assets may find it easier to issue debt, since it is easier for the lender to establish the value of this kind of asset in informationally opaque firms (Ramalho and Silva, 2009). Assuming that firms prefer internal sources of finance, as pecking-order theory states, both older firms, which tend to accumulate retained earnings (Petersen and Rajan, 1994), and more liquid firms (Myers and Majluf, 1984) are expected to require less debt. Moreover, the findings relative to Growth and Profitability do not entirely corroborate pecking-order theory but do not contradict it: the predicted positive effect found for Growth is only significant for levered firms, while Profitability is relevant in only one of the eight models.
Based on the regression coefficients estimated in models (1), (2), (5) and (6), it seems that most explanatory variables have similar effects, in terms of sign and significance, on family and non-family firm financial leverage. However, the null hypothesis of no significant differences between all regression coefficients is clearly rejected by the Chow test for both binary and fractional regression models. Thus, the joint impact of the explanatory variables on capital structure is different for family and non-family firms, which suggests there is indeed a family ownership influence on a firm’s debt leverage. Hence, a single regression model, not accounting for different ownership structures, would not describe in an appropriate way the capital structure choices of both family and non-family firms.
To capture the general effect of family ownership, models (3) and (6) consider all firms, but add the Family dummy variable to the set of explanatory variables. The results show that family ownership has a significant, positive effect in both binary and fractional models. Therefore, on average, even after controlling for many of their observed differences, family firms tend to have significantly more debt than non-family firms: not only are family firms more prone to use debt, but levered family firms also have a higher proportion of debt in their capital structure. These findings, together with the results of the Chow tests, fully support
Hypothesis 1. They also corroborate previous findings by inter alia King and Santor (2008)
and Schmid (2013) about the positive effect of family ownership on a firm’s capital structure. Note that in the preliminary analysis carried out in Section 3.3, we found the opposite result that levered non-family firms use more debt than their family counterparts. This shows that not appropriately controlling for firm characteristics may substantially bias the conclusions and inform contradictory results found in earlier studies.
The positive effect found for the family ownership factor provides support for theories that claim family firms have a capacity for higher leverage due to the greater continuity and stability of their organisational structure. This is implied by factors such as concern with family reputation and longer investment horizons and may lead to more favourable lending conditions; see inter alia Anderson at al. (2003) and Crespí and Martín-Oliver (2015). The more efficient management of resources that characterises many family firms (Andersen and Reeb, 2003a; Maury, 2006) is another factor that may explain the positive impact of family ownership on financial leverage.
Models (3) and (6) assume that the effect of family ownership does not differ across sub-groups of family and non-family firms. In models (4) and (8) we allow that effect to change across size-based groups, geographical location and time periods by adding interaction terms between those factors and Family. Examining the significance of the regression coefficients of
the new variables, and the result of the Wald test for their joint significance, we conclude that the family ownership effect is not uniform across groups. Regarding the probability of using debt, this effect is significantly lower than the average effect (0.284) in the case of micro and small firms and non-metropolitan areas. Considering only levered firms, the family ownership effect is again significantly lower than the average (0.157) for firms located in non-metropolitan areas and it became significantly less important after the 2008 crisis. These findings are somewhat surprising, since most authors have suggested, directly or indirectly, a stronger family ownership effect for smaller, rural firms in the period 2009-2012. Indeed, family firms: are associated with small firms in the financial literature (Ramalho and Silva, 2009; Sirmon and Hitt, 2003); have competitive advantages that are specific to rural areas (Bird and Wennberg, 2014; Backman and Palmberg, 2015); and seem to have been less affected by the 2008 crisis in terms of credit access (D’Aurizio et al., 2015; Crespí and Martín-Oliver, 2015).
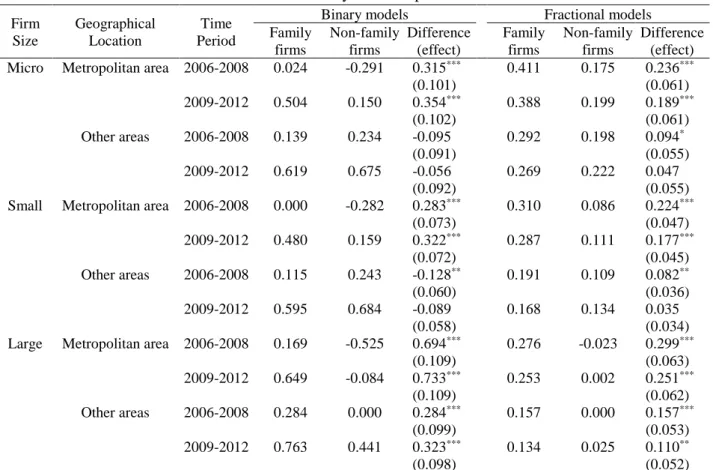
To further investigate the stability of the family ownership effect, Table 5 presents estimates for this effect for different sub-groups of family and non-family firms, which were calculated from the results of models (4) and (8).8 Note that the values reported for family and non-family firms are not interesting per se: a significant positive (negative) value would simply mean that the group in analysis uses more (less) debt, or is more (less) prone to use it, than the reference group - large non-family firms located in a non-metropolitan area and observed in the period 2006-2008 - implicitly considered in model (4). However, the difference between two of those values in cases where only ownership differs gives the family ownership effect for each sub-group of family and non-family firms.
Table 5 about here
Table 5 shows that the family ownership effect is significant and positive in eight of the 12 groups in the binary case and in 10 of the 12 groups in the fractional case. We find that family firms located in metropolitan areas or of large size are always more prone to use, and use more debt, than their non-family counterparts. Before 2008, levered family firms of any type also tended to significantly use more debt, but, after the crisis, the effect, although still positive, is no longer significant for non-metropolitan micro and small firms.
Our results reveal that the expected advantage of family firms in terms of access to funding in rural areas due to their stronger local roots (Bird and Wennberg, 2014; Backman and Palmberg, 2015) particularly applies to large firms. Smaller family firms, being less
influential, do not benefit more from relationship banking than their non-family counterparts, especially after 2008. The most likely reason for this change is that after 2008 in Portugal, many bank loan decisions previously made by officers at local bank branches, became centralised at offices located in metropolitan areas. Therefore, loan decisions are likely to have started to rely more on quantitative indicators and less on soft information such as local prestige.
Overall, we conclude that Hypothesis 2 is only partially supported by the data. Indeed, while it is true that the effect of family ownership is significant and positive in most cases, it is also true that it differs across a range of sub-groups of family and non-family firms, being even irrelevant in a few cases. The fact that previous studies have focused on particular groups of firms is hence, likely to be another reason for the opposing results reported about the overall effect of family ownership.
4.2.3. Size, Location and Crisis Effects for Zero-Leverage and Levered Family Firms
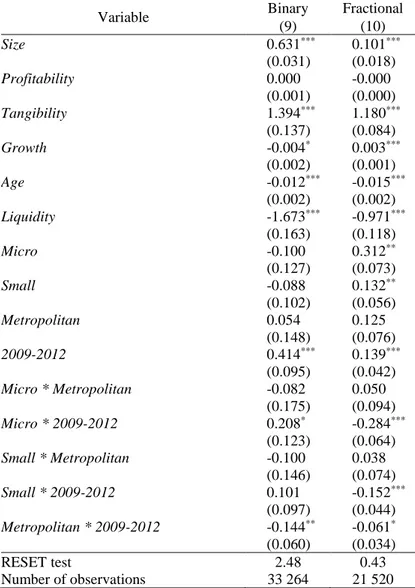
We now focus on family firm leverage, namely on the influence of the factors mentioned in Hypotheses 3-5. To investigate this question thoroughly, we consider a very flexible model specification, where the effect of each factor is allowed to depend on all the others. This new specification adds to models (1) and (5) five interaction terms relating firm size, location and the 2008 crisis. The results obtained for the new models (9) and (10) are reported in Table 6.
Table 6 about here
The estimates obtained for the classical, continuous explanatory variables in models (9) and (10) are very similar to those previously reported for models (1) and (5). The same does not happen for some of the dummy variables, suggesting that the effect of size, location and the 2008 crisis may be different for some sub-groups of family firms. In particular, note that the interaction terms involving the 2009-2012 variable are statistically significant in five of six cases. Therefore, as performed before for the family ownership effect, we computed the effect of each factor for all possible sub-groups of family firms using the results of Table 6. Again, note that the value reported for each group does not have a particularly interesting interpretation, since it merely provides a direct comparison with the reference group, which in this case concerns large family firms located in a non-metropolitan area and observed in the
period 2006-2008. What matters is the difference between each pair of groups that differ in only one dimension.
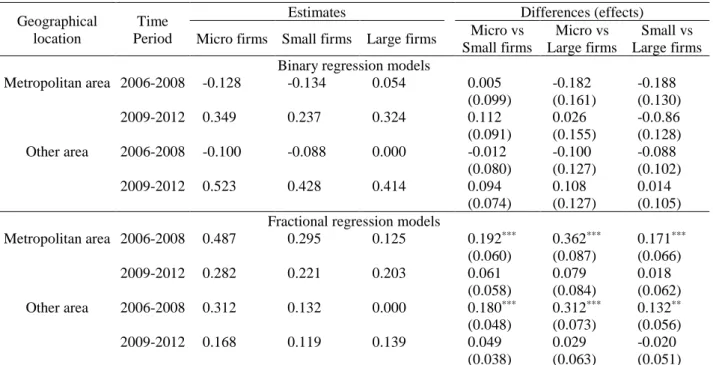
Table 7 reports the estimates obtained for the size effect on family firm leverage. For the probability of using debt, there are no significant differences across micro, small and large firms, meaning that for family firms there is no size effect other than that captured by the continuous variable Size. On the other hand, concerning the amount of debt used by levered family firms, the clear negative size effect that was present before the crisis became insignificant in the period 2009-2012. This change may have occurred because smaller family firms were more affected by the reduction in credit supply after 2008 (Cowling et al., 2012; Vermoesen et al., 2013) and/or because large family firms also had to increase their demand for debt due to a poorer economic performance (Cowling et al., 2015) and the consequent increasing difficulty in generating internal funds or raising external equity. Overall,
Hypothesis 3 does not seem to hold generally, but only for a particular debt decision and a
specific period of time.
Table 7 about here
Relative to firm geographical location, see Table 8, we find that in general there is no location effect for the probability of family firms using debt. However, conditional on having debt, family firms in metropolitan areas tend to use it in significantly higher proportions. A simple explanation is that financing costs tend to be higher for firms located in non-metropolitan areas (Arena and Dewally, 2012; Degryse and Ongena, 2005), so they use relatively lower amounts of debt. Because the proportion of metropolitan and non-metropolitan firms using debt is not significantly different, our results also suggest that firms located outside metropolitan areas nevertheless benefit from relationship banking to access debt, although in smaller amounts. Overall, Hypothesis 4 is partially supported by our results.
Table 8 about here
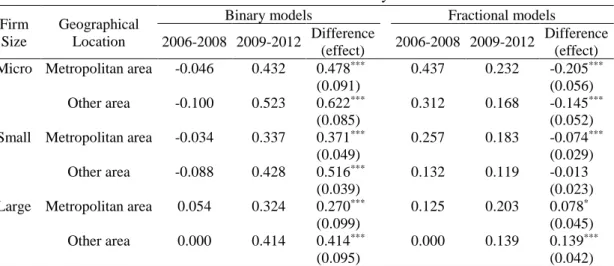
Finally, consider Table 9, which reports the estimated crisis effects for family firm leverage. Unlike the previous cases, there is strong evidence that the 2008 global crisis affected the capital structure of family firms significantly. The crisis led to increased probability of any type of family firm using debt, as formulated in the first part of Hypothesis
resources were generated as a direct consequence of the economic crisis that damaged firm performance (Cowling et al., 2015). The proportion of debt held by levered family firms has also changed significantly. However, while the debt ratios of micro and small levered family firms were negatively affected by the global crisis, especially the former, large firms actually increased their debt. This confirms our previous interpretation that the irrelevant firm size effect found above for the period after 2008 was indeed a consequence of both demand and supply factors. Overall, Hypothesis 5 is fully supported by our results.
Table 9 about here
5. Conclusion
In this article, we analysed the effect of family ownership on firm leverage across different sub-groups of family and non-family firms. We also investigated the influence of firm size, geographical location and the 2008 financial crisis on the capital structure of family firms. We found that family ownership influences positively both the probability of using long-term debt and the conditional amount of debt issued by large firms and firms located in metropolitan areas. For other types of firms, the first effect is irrelevant and the second disappeared after 2008. Indeed, the 2008 crisis seems to have had a significant impact on family firm debt policy. All types of family firms became significantly more prone to use debt; however, the proportion of debt decreased for micro and small firms, but increased for large firms. Finally, the direct effects of size and location on family firm leverage seem to be irrelevant for the probability of using debt. However, metropolitan levered firms, throughout the whole period, and smaller levered firms, before the crisis, use more debt. Classical determinants of capital structure are also relevant and we found that their effects conform to some extent with pecking-order theory.
As previously documented, for firms of any type of ownership (Cowling et al., 2012; Vermoesen et al., 2013; Dang et al., 2014; Van Hoang et al., 2017), we found that smaller family firms were more affected by the reduction in credit supply after 2008. In addition, we found other important consequences of the 2008 financial crisis, namely a demand-side effect. Indeed, the most probable reason for the higher proportion of firms that use debt in the period 2009-2012 is increasing demand, which may be due to the economic crisis and the consequent reduction in retained earnings or, to the increasing difficulties in raising external equity. These results have important implications for policy makers, suggesting that mechanisms to grant