ANA ISABEL VAZ LUCAS
UNIVERSIDADE DO ALGARVE
MASTER OF SCIENCE IN AQUACULTURE AND FISHERIES 2018
particular focus on the consumption of whiting and
Atlantic herring, in Scottish waters (1992-2014)
ANA ISABEL VAZ LUCAS
Variability of Harbour porpoise diet with a particular
focus on the consumption of whiting and Atlantic herring,
in Scottish waters (1992-2014)
Dissertation to obtain the degree in Masters in Aquaculture and Fisheries
Speciality in Fisheries
Mentor: Graham J. Pierce1 Supervisor: Karim Erzini2
1PhD Zoology, University of Aberdeen
Instituto de Investigaciones Mariñas (CSIC), Vigo
2PhD Biological Oceanography University of Rhode Island
Associate Professor, Universidade do Algarve (FCT)
UNIVERSIDADE DO ALGARVE 2018
Variability of Harbour porpoise diet with a particular focus on the consumption of whiting and Atlantic herring, in Scottish waters (1992-2014)
“Declaração de autoria do trabalho”
Declaro ser a autora deste trabalho, que é original e inédito. Autores e trabalhos consultados estão devidamente citados no texto e constam da listagem de referência incluída.
Ana Isabel Vaz Lucas
Copyright © 2018 by Ana Isabel Vaz Lucas
A Universidade do Algarve reserva para si o direito, em conformidade com o disposto no Código do Direito de Autor e dos Direitos Conexos, de arquivar, reproduzir e publicar a obra, independentemente do meio utilizado, bem como de a divulgar através de repositórios científicos e de admitir a sua cópia e distribuição para fins meramente educacionais ou de investigação e não comerciais, conquanto seja dado o devido crédito ao autor e editor respectivos.
i
Acknowledgements
These words go to the ones who were there along the way:
- First, to Prof. Graham Pierce, my mentor who was always there to help me since the moment I get in his office, for the first time. Many thanks for your patience, guidance, expertise and all the teachings, during all this time. To Prof. Begoña Santos, for her knowledge and comments, too.
- To Prof. Karim Erzini and Prof. Elsa Cabrita for always be available to help.
- To my parents, Mário and Silvana, for their support and unconditional trust and love. To Filipe and Janka for their encouragement to seek a biologist career. To my favourite pet, Misha, for its joy every time I came home.
- To Nuno for his understanding, affection, and of course for be always there for me no matter what.
Muito Obrigado.
“La science, mon garçon, est faite d'erreurs, mais d'erreurs qu'il est
bon de commettre, car elles mènent peu à peu à la vérité.”
Jules Verne, 1972 - Journey to the Center of the Earth -
ii
Resumo
O objectivo deste trabalho foi investigar a influência de alguns factores (ex. local, comprimento do boto, abundância da presa) respeitantes ao consumo de arenque e badejo, na variabilidade da dieta do boto. Estudo foi realizado para a região da Escócia, focando o período entre 1992 e 2014. Serve o presente documento, também, dar continuidade a um anterior estudo publicado em 2004 pela investigadora Begonã Santos, para a mesma área geográfica.
A observação directa dos períodos de alimentação é uma prática dispendiosa e morosa, dificultada também pelo próprio comportamento tímido dos botos. Assim sendo, a análise de estômagos provenientes de carcaças de cetáceos são uma prática mais recorrente. Este procedimento é duplamente apoiado e criticado por diferentes investigadores. Mesmo inerente a erros, contribui para um estudo mais detalhado da ecologia e biologia de uma espécie.
A equipa escocesa responsável pelo estudo e recolha de animais marinhos arrojados na Escócia (SMASS) foi quem forneceu as amostras analisadas no presente trabalho. Os conteúdos estomacais passaram por uma diversidade de etapas, desde a limpeza, a triagem, até ao seu armazenamento. Depois das diferentes estruturas esqueléticas terem sido separadas do conteúdo estomacal procedeu-se à identificação dos ossos aí O boto apresenta uma alimentação composta por uma variedade de peixes da família Gadidae, Clupeidae, Gobidae, Ammodytidae bem como de cefalópodes. Ao longo dos anos, tem apresentado diferentes preferências alimentares. Na Escócia, são alguns exemplos dessas espécies sobretudo cardumes de peixes pequenos de galeotas (Ammodytes), badejos (Merlangius merlangus), Trisopterus spp. e arenques (Clupea
harengus).
O boto (Phocoena phocoena) é um cetáceo comumente observado em zonas de águas pouco profundas (<200m), sendo a sua distribuição sobretudo limitada à plataforma continental. Nas zonas costeiras, são observados frequentes arrojamentos desta espécie provocados pela interação negativa com artes de pesca, por colisões com embarcações e, também por ataques de roazes (Tursiops truncatus) e de focas cinzentas (Halichoerus
iii
encontrados. Parte desta identificação já tinha sido anteriormente realizada por estudantes e investigadores. Estômagos não antes analisados foram processados pela presente autora.
De forma geral, a dieta de um cetáceo pode reflectir a sua condição física. Por exemplo, as habilidades e a experiência na procura de alimento normalmente estão associadas a indivíduos de grande porte e mais velhos. Fêmeas gestantes estão associadas a necessidades energéticas maiores. O boto pode, também, ajustar a sua alimentação em função da abundância e biomassa das suas presas. No caso do badejo e do arenque, os seus stocks têm sofrido grandes variações ao longo do século.
Na análise estatística os modelos aditivos generalizados (GAMs) demonstraram quais dos factores em estudo (entre as características físicas, espaciais e temporais) foram significativos na variabilidade do consumo de badejo e arenque na dieta do boto, para o período entre 1992-2014. O teste X2 foi usado para a escolha do modelo cujas variáveis eram mais representativas da realidade. Os dados para a costa oeste da Escócia bem como alguns dos obtidos para o arenque foram passíveis de originar resultados com representatividade discutível, devido ao tamanho reduzido das amostras (<50).
Durante a identificação foi dada prioridade aos ossos designados por otólitos, e aos ossos da boca do peixe – as premaxilas e as dentárias. Estes ossos permitiram muitas vezes a identificação até a espécie, pois são estruturas com um grau de resistência aos fluídos digestivos. A sua capacidade de conseguirem manter as suas estruturas quase originais, formas e tamanhos permitiram estabelecer uma relação com a espécie ao qual pertenceram. O tamanho e peso dos arenques e dos badejos ingeridos pelos botos foram estimados de forma indirecta através de equações específicas para cada espécie. Quanto ao número de presas presentes no estômago de cada boto, este foi calculado através do número máximo de estruturas ósseas encontradas.
Os dados sobre a abundância e a biomassa das presas nos mares da costa da Escócia foram disponibilizados por relatórios do ICES (International Council for the Exploration of the Sea). Os stocks das áreas que envolvem a costa da Escócia (4a, 4b e 6a) são monitorizados em associação com outros das áreas em redor. Portanto, os dados da costa este, são representativos da combinação dos stocks das áreas 4a, 4b, 3a e 7d, e os da costa oeste são combinados com os das áreas 6a, 7b e 7c.
iv
O boto demonstrou ser um predador voraz de badejo quando comparado com o consumo de arenque, sobretudo nas águas costeiras a este da Escócia. O badejo tem apresentado um papel consistente como presa ao longo dos anos, enquanto a importância de arenque se tem mantido reduzida nas tendências alimentares. De forma geral, observou-se que as escolhas alimentares do boto estão relacionadas possivelmente apenas com a abundância das suas presas primárias. Também, o local onde os botos se alimentam pela última vez reflete ser factor de variabilidade na dieta. Assim, como a sazonalidade parece ser determinante na escolha dos tamanhos ingeridos de badejo e arenque. Respeitante ás características físicas do boto, o seu tamanho, também, se destacou sendo um factor de variabilidade. Botos maiores alimentam-se de badejo de maiores tamanhos. Este cetáceo apresentou, também, preferência por badejo e arenque de menores tamanhos que aqueles capturados pelas pescas. O consumo destas duas espécies de peixe observou-se ser independente dos botos serem do género masculino ou feminino.
Termos chave: Escócia, Phocoena phocoena, factores, variabilidade alimentar, Clupea
harengus, Merlangius merlangus.
Importante de referir, que os factores que potenciam a variabilidade da dieta são transversais à relação predador-presa. Considerando os mesmos factores de variabilidade, a dieta parece ser afectada de forma diferente tendo em conta o nível de importância das presas no seu regime alimentar. Continua ainda assim por explicar muitos dos factores que direcionam a dieta dos botos, em especial no consumo de badejo e de arenque, contribuindo o actual trabalho com novos conhecimentos para esta área. Deste modo, contribuiu como estudo ecológico para a monitorização do bem-estar e desenvolvimento da estrutura populacional de botos na Escócia. Para uma abordagem mais próxima da realidade sobre a dieta dos botos nesta região, novas pesquisas envolvendo outras variáveis de estudo e com uma maior representatividade populacional serão necessárias.
v
Abstract
Harbour porpoise (Phocoena phocoena) is one of the most abundant cetaceans in Scotland, where it forages for prey such as whiting, sandeel and sepiolids. Currently, whiting is among primary prey, while herring, an important prey historically for porpoises, seemed not to be common in their diet anymore. The present work aimed to study spatial and temporal variability in porpoise diet, and the effects of prey availability and porpoises physical characteristics on the consumption of herring and whiting. Besides presenting new information, this study helps extend the data on porpoise diet beyond a published study from 2004 (by Begoña Santos), for Scotland. The stranded monitoring scheme (SMASS) provided the dietary samples from 1992 to 2014. Regression equations were used to back-calculate the amount of prey eaten based on measurement of fish hard parts (e.g. otoliths) recovered from stomach contents. GAMs and X2 test analysed the variables that significantly influence the variability of porpoise diet.
Key words: Scotland, Phocoena phocoena, dietary drivers, Clupea harengus,
Merlangius merlangus.
Although, even with an incomplete knowledge of the variables that affect porpoise diet, the present study provides new insights. Porpoise diet seems to be highly linked to the relationship predator-prey, and changes in the biology or ecology on one or the other, could have consequences for porpoise population well-being and development.
Porpoise sex didn’t affect the consumption of whiting and herring. On the other hand, geographical location, year and seasonality were significant factors in the presence and size of these prey species in the diet. Porpoises seem to prefer small sizes of herring and whiting than the ones fishery harvested. Over the years, whiting was more important and constant than herring in porpoise diet. Whiting consumption was consistent with trends in whiting abundance (based on ICES stock assessments for the North Sea). Additionally, bigger whiting was eaten by bigger porpoises. The consumption of herring by porpoises did not appear to be affected by the same or equivalent (as in the case of herring abundance) variables.
vi
Table of Contents
Acknowledgements ... i Resumo ... ii Abstract...v Table of Contents ... viIndex of Figures ... viii
Index of Tables ... viii
List of Abbreviations ... ix
1. Introduction ...1
1.1. Harbour porpoise (Phocoena phocoena), in Scottish waters ...1
1.2. Historical Harbour porpoise dietary studies...4
1.3. Prey species potential biology/ecology factors of variability...7
1.3.1. Atlantic Herring (Clupea harengus) ...7
1.3.2. Whiting (Merlangius merlangus) ...9
2. Objectives ... 11
3. Material and Methodology ... 12
3.1. Source of Harbour porpoise diet samples ... 12
3.2. Sampling, Processing and Storage diet samples ... 13
3.3. Skeleton structures used for diet identification ... 14
3.4. From skeleton to quantification of diet composition ... 16
3.5. ICES stock assessments of herring and whiting ... 19
3.6. Statistical analysis of diet data ... 21
3.6.1. Data Sorting ... 21
3.6.2. Data Exploration and Modelling ... 22
3.7. Sources of potential bias ... 24
4. Results ... 27
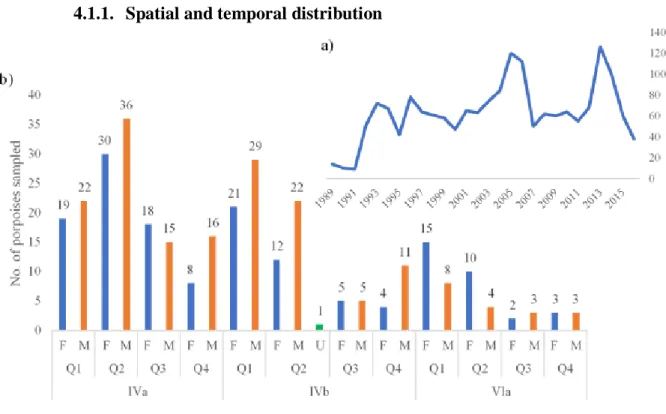
4.1. Harbour porpoises sampled data-series ... 27
4.1.1. Spatial and temporal distribution ... 27
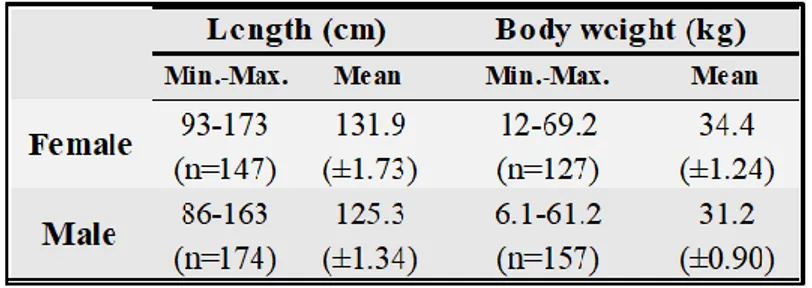
4.1.2. Physical characteristics ... 28
4.2. Herring and whiting variability in the diet of Harbour porpoises ... 29
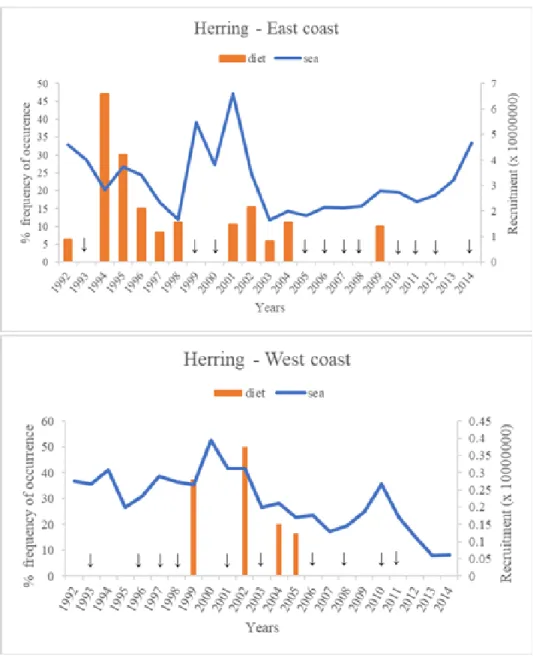
4.2.1. Importance of herring in the diet considering its stock recruitment ... 29
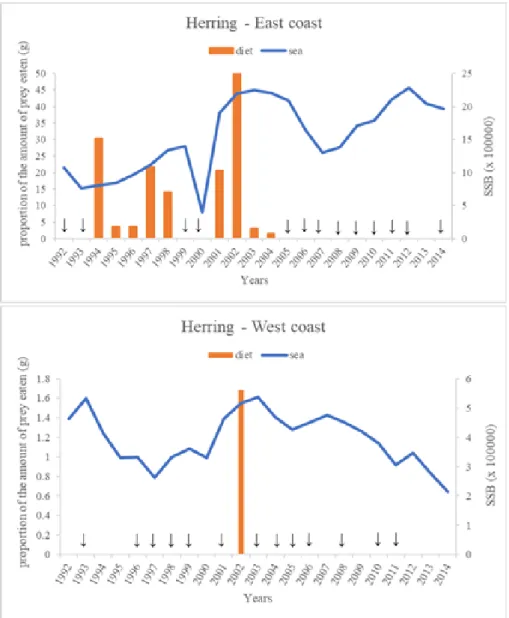
4.2.2. Importance of herring in the diet considering its stock biomass (SSB)... 32
4.2.3. Variability in the presence/absence of herring in the diet ... 34
4.2.4. Variability in the length of herring in the diet ... 36
4.2.5. Variability in the mass (g) of herring in the diet ... 38
vii
4.2.7. Importance of whiting in the diet considering its stock biomass (SSB) ... 43
4.2.8. Variability of the presence/absence and number of whiting in the diet... 46
4.2.9. Variability in the length of whiting in the diet ... 48
4.2.10. Variability in the mass (g) of whiting in the diet ... 50
5. Discussion... 51
5.1. Characteristics of Harbour porpoises strandings in Scotland ... 51
5.2. Variability in the diet of Harbour porpoise ... 54
5.2.1. Interference of prey availability in the diet ... 54
5.2.2. Interannual variation in diet ... 57
5.2.3. Seasonal variation in diet ... 59
5.2.4. Geographical variation in diet ... 60
5.2.5. Ontogenic variation in diet ... 62
6. Conclusion ... 64
7. Future work ... 65
8. Literature Cited ... 66
APPENDIX ... 72
viii
Index of Figures
Introduction
Figure 1.1- Abundance and density of Harbour porpoise, in Scottish waters ...1
Material and Methodology Figure 3.1- Harbour porpoises stranded in Scotland (1989-2016) ... 12
Figure 3.2- Standard measures for otoliths and fish jaw bones ... 18
Results Figure 4.1- Spatial and temporal distribution of sampled Harbour porpoise ... 27
Figure 4.2- Annual occurrence of herring in diet and sea (recruitment), in Scotland... 30
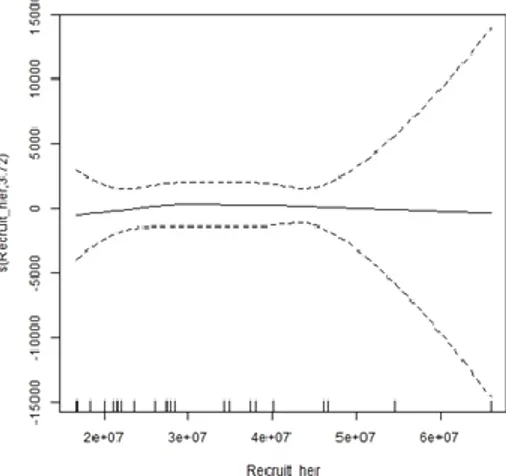
Figure 4.3- Number of herring eaten in response to Recruitment stock ... 31
Figure 4.4- Annual occurrence of herring in diet and sea (SSB), in Scotland ... 32
Figure 4.5- Mass (g) of herring eaten in response to SSB ... 34
Figure 4.6- Presence/absence of herring eaten in response to year and porpoise length ... 35
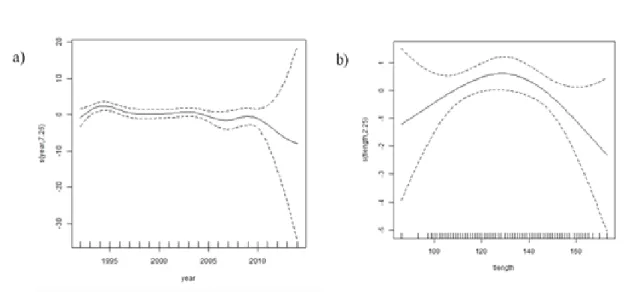
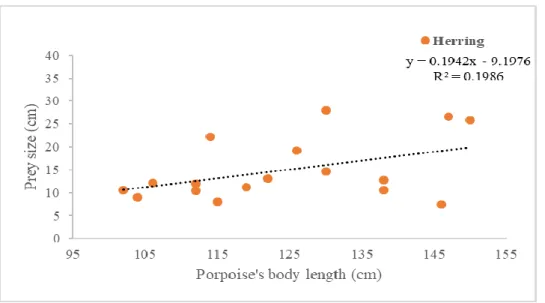
Figure 4.7- Herring length (cm) vs Porpoise length (cm) ... 36
Figure 4.8- Length (mm) of herring eaten in response to porpoise length (cm) ... 38
Figure 4.9- Mass (g) of herring eaten in response to year and porpoise length (cm) ... 40
Figure 4.10- Annual occurrence of whiting in diet and sea (recruitment), in Scotland ... 41
Figure 4.11- Number of whiting eaten in response to Recruitment stock ... 43
Figure 4.12- Annual occurrence of whiting in diet and sea (SSB), in Scotland ... 44
Figure 4.13- Mass (g) of whiting eaten in response to SSB ... 46
Figure 4.14- Number of whiting eaten in response to year ... 47
Figure 4.15- Whiting length (cm) vs Porpoise length (cm) ... 48
Figure 4.16- Length (mm) of whiting eaten in response to porpoise length (cm) ... 49
Figure 4.17- Mass (g) of whiting eaten in response to year and porpoise length (cm) ... 50
Index of Tables
Results Table 4.1- Sizes of Harbour porpoise dead population ... 28Table 4.2 - Tested GAMs for herring length (mm) ... 36
ix
List of Abbreviations
ICES International Council for the Exploration of the Sea UK United Kingdom
IUCN International Union for Conservation of Nature
SCANS Small Cetaceans in the European Atlantic and North Sea
ASCOBANS Agreement on the Conservation of Small Cetaceans of the Baltic, North East Atlantic, Irish and North Seas
EU European Union
GPS Global Positioning System
Blim Limit reference pointfor Stock Spawning Biomass
SST Sea Surface Temperature SSB Spawning Stock Biomass
SMASS Scottish Marine Animal Stranding Scheme
QGIS 2.10 Quantum Geographical Information System version 2.10 IIM Instituto de Investigaciones Mariñas
OW Otolith width OL Otolith Length FW Fish Weight TL Total Length PMXL Premaxillae length
PMXAH Premaxillae height of articular process S-VL Dentary Ventral Length
DNA Deoxyribonucleic Acid TRL/Whit. Trisopterus luscus or Whiting Whit./BLW Whiting or Blue Whiting VPA Virtual Population Analysis
HAWG Herring Assessment Working Group
WGNSSK Working Group on the Assessment of Demersal Stocks in the North Sea and Skagerrak
WGCSE Working Group for the Celtic Seas Ecoregion Q1 1st Quarter (January, February, March)
x
Q2 2nd Quarter (April, May, June)
Q3 3rd Quarter (July, August, September)
Q4 4th Quarter (October, November, December)
F Female M Male
U Unidentified sex NA Not Available
VIF Variance Inflation Factor
GVIF Generalized Variance Inflation Factor ANOVA Analysis of Variance
GAMs Generalised Additive Models AIC Akaike Information Criterion DE Deviance explained
EDF Estimated degrees of freedom CL Confidence Limits
OSPAR Oslo/Paris convention (for the Protection of the Marine Environment of the North-East Atlantic)
MSY Maximum Sustainable Yield
FMSY Fishing mortality consistent with achieving MSY
F Instantaneous Rate of Fishing Mortality Bpa Precautionary reference point for SSB
SACs Special Areas of Conservation MAPs Marine Protected Areas
1
1.
Introduction
1.1. Harbour porpoise (Phocoena phocoena), in Scottish waters
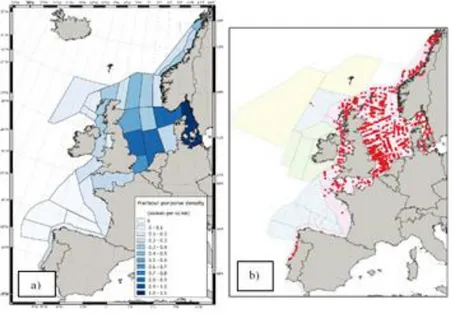
Figure 1.1- Abundance and density of Harbour porpoise, in Scottish waters
a) Estimated density of harbour porpoise for 2016, in Northeast Atlantic shelf waters (Hammond et al.,
2017). b) Harbour porpoise sightings from the last SCANS-III survey (Hammond et al., 2017).
Harbour porpoise (Phocoena phocoena) is one of the most common cetaceans in the North Sea, who is sighted regularly in Scottish coastal waters (Dolman et al., 2014; Hammond et al., 2017). Over the years, ongoing surveys (e.g. SCANS-I/1994, II/2005, III/2016) along the European continental shelfs have provided information on the abundance and distribution of this species (Figure 1.1). Among these waters, porpoise abundance did not change from 1994 to 2016 (SCANS-II, 2008; Hammond et al., 2013, 2017). However, it had a marked decline during the 1980s in the north coast of Scotland (Shetland), but the trend reversed after 1991 (Evans et al., 1996). In 2016, the North Sea and west of Scotland were the area with the highest porpoise abundance estimation, ~369743animals/km2 (Hammond et al., 2017).
In some Scottish regions, as in the west coast, porpoises distribution is often within 15km from the shore and between 50-150m deep (Marubini et al., 2009). But in the eastern side (Aberdeenshire), they occur not in such deep waters, porpoises were detected just around 20m depth (Weir et al., 2007). In a small-scale study carried out in Scotland, porpoises have revealed seasonal migrations. In the west coast, porpoises were observed moving in
2
spring to inshore waters, while on summer they move offshore (Gilles et al., 2016). In the east side (Aberdeenshire), in 1999-2001, an increase number of animals was observed between July and October (Weir et al., 2007). And in the northern waters, in 1990-1995, it was observed in summer, with a peak in August-September (Evans et al., 1996). The availability and distribution of primary prey species and the bycatch of porpoises were, in the case of north Scottish region, described as possible reasons for the changes in their abundance and distribution (Parson et al., 2000; Santos & Pierce, 2003; SCANS-II, 2008; Hammond et al., 2013).
Over the years, porpoises dietary studies have been published for Scotland (Southwell, 1881; Rae, 1973; Santos, 1998; Santos et al., 2004) as well as for other areas in the North Sea (e.g. Holland, Denmark, Norway, Sweden, Germany) (Santos, 1998; Lockyer, 2003; Leopold, 2015). Many of these researches are based on the stomach content analysis from individuals found beached, floating at sea, bycaught or killed by other animals (Santos, 1998; Lockyer, 2003; Leopold, 2015). This approach can provide information about the ecology for both prey and predator species (Clarke, 1980; Greenstreet & Tasker, 1996; Gilles et al., 2016). This method is based on the identification of the prey species using the predator stomach remains such as otoliths, beaks, jaw and opercular bones, vertebrae, Abundant and widely spread in the Scottish coastal waters (SCANS-II, 2008; Dolman et
al., 2014; Hammond et al., 2017), harbour porpoises are an active predator for a wide
range of commercial a non-commercial species (Rae, 1973; Santos, 1998; Santos & Pierce, 2003). Porpoises are sight mainly alone or in small groups (e.g. 3-4 individuals) (Jefferson et al., 2008; Dolman et al., 2014), notably single when foraging (Read, 2008). Porpoises have the capacity in moving between marine and freshwater habitats (Leopold, 2015), but they apparently seem to prefer shallow cold seawaters (Rae, 1965; Weir et al., 2007; Read, 2008; Marubini et al., 2009). Occasionally, they also swim to deeper offshore sites (Jefferson et al., 2008; Gilles et al., 2016). Within these areas, porpoise forage all over the water column, during night and day periods (Linnenschmidt et al., 2012; Wisniewska et al., 2016), for both pelagic and demersal species (Corbet & Harris, 1991; Jefferson et al., 2008; Read, 2008). However, they seem to avoid spiny schooling fish (Jefferson et al., 2008) as well as deep fish species (SCANS-II, 2008). Porpoises describe a day-night feeding behaviour (Wisniewska et al., 2016), which could be related with the daily vertical migration of their prey. As an example, cephalopods which are demersal species, approach the surface at night (Read, 2008) being forage by porpoises (Santos, 1998).
3
etc, from the sampled contents (Clarke, 1980, 1987; Pierce & Boyle, 1991; Santos et al., 2004; Bowen & Iverson, 2012).
Ecological studies of harbour porpoises have been focused on describing their diet, as well as potential factors that drive porpoises to adjust their foraging behaviour (Linnenschmidt et al., 2012). Some factors such as porpoise sex and age, prey availability and competition, and season could lead to different food choices (Rae, 1965, 1973; Santos, 1998; Santos et al., 2004; Leopold, 2015). Porpoises have high energy demands (mean energetic densities of the diet>5.5kJ/g) (Spitz et al., 2012), and due to their small body size (Van Beneden, 1889), porpoises have a low energy storage capacity making them more dependent of food (Brodie, 1995). They eat an estimated 1.17kg of daily food (Santos, 1998) which suggests their need of feeding almost continuously, to meet their high metabolic demands (Wisniewska et al., 2016). For example, pregnant females with heavier bodies (Learmonth et al., 2014), or even lactating females (in which body weight increases by 80%) (Yasui & Gaskin, 1986), will require higher energy compared to immature females, could this resulting in differences in the diet. In Scottish waters, porpoises live approximately 11-15yrs (Santos, 1998), ranging from 0.60 to 1.75m in length (Rae, 1973; Learmonth et al., 2014) and weight up to 72.9kg (Learmonth et al., 2014). Although, prey biology and ecology can drive porpoise forage behaviour as well. Around UK waters, including Scotland, porpoise present a wide array of prey species on its diet (Corbet & Harris, 1991; Santos 1998; Santos et al., 2004). Adult porpoises and juveniles share feeding Scottish sites where they forage for different prey species (Santos, 1998; Santos et al., 2004). Some of the Scottish targeting prey are herring, Trisopterus spp., cod, sandeel, haddock, whiting, crustaceans and Sepiolidae (Scott, 1903; Rae, 1965; Corbet & Harris, 1991; Santos 1998; Santos et al., 2004). Despite all these species, nowadays, porpoises apparently have preference for sandeels and whiting (Santos et al., 2004). Historically, harbour porpoise preferential prey have been shifting (Scott, 1903; Corbet & Harris, 1991; Santos, 1998). Whiting has been a consistently important prey for porpoises over many decades (Scott, 1903; Rae, 1965; Santos, 1998; Santos et al., 2004), while herring was only important in porpoise diet until the beginning of 1990s (Southwell, 1881; Rae, 1965; Corbet & Harris, 1991). Both fish species are, also, of high commercial and economic importance (Whitehead et al., 1986; Simmonds, 2007; Scottish Government, 2017) as well as an important prey in other food webs (e.g. grey gurnard, grey seals) (Leopold, 2015; ICES, 2017).
4
This has been supported by the fact that porpoises distribution has been relating to areas in close proximity to the distribution of their prey (Evans et al., 1996; Parson et al., 2000; Santos & Pierce, 2003; Hammond et al., 2013). Also, it seems that if the availability of a common prey declines, porpoises could shift its diet to other prey species (Santos & Pierce, 2003). Climate changes (e.g. Learmonth et al., 2006; Lambert et al., 2014), anthropogenic activities (e.g. bycatch, oil exploration, pollution, shipping, military tests) (Parsons et al., 2000; Weir et al., 2007) and, interspecific relationships (e.g. bottlenose dolphins and grey seals attacks (Santos & Pierce, 2003; Santos et al., 2004; Weir et al., 2007; ASCOBANS, 2015; Leopold, 2015)) seem to dictate porpoises distribution and therefore under the possibility in changing their feeding grounds and main prey.
Currently, harbour porpoises face different threats, fishery has been the most problematic one (SCANS-II, 2008; Marubini et al., 2009). In 2005, he was referred as one of the two main species more affected by fishing around UK waters (Northridge et al., 2016). Due to their interaction with the fishing gears, they may get accidental tangled in nets such as bottom-set gillnets and trawls (Parsons et al., 2000; Jefferson et al., 2008; Heath et al., 2017). In the North Sea, a few mitigation measures had been applied such as the use of pingers in the fishery nets (ICES, 2018). Since 2008, in the IUCN Red List of Threatened Species porpoises are globally classified as species of “Least Concern”, although in 1996 they were considered “Vulnerable” (Hammond et al., 2008). This could reflect the current concern and responsibility for the well-being of the harbour porpoise species. The more recent action was, in 2016, with the proposal of most of the west coast of Scotland (Inner Hebrides and the Minches) as Special Areas of Conservation (SACs) for harbour porpoises (Embling et al., 2010; SNH, 2016).
1.2. Historical Harbour porpoise dietary studies
Studies regarding harbour porpoise feeding habits (Treacy & Crawford, 1981; Leopold, 2015), including several in Scottish waters (Southwell, 1881; Van Beneden, 1889; Scott, 1903; Rae, 1965, 1973; Santos, 1998; Santos et al., 2004) have been published in the last decade. Recent studies, for Scottish waters, showed whiting (Merlangius merlangus) and sandeel (Ammodytidae) as porpoises Top 2 most important prey, when herring (Clupea
harengus) represents a small proportion (Santos et al., 2004; Pierce et al., 2007;
5
The research from Pierce & Boyle (1991), Santos (1998), Santos & Pierce (2003), Santos
et al. (2004), Pierce et al. (2007) and Leopold (2015) demonstrated that diet composition
and food preferences can differ from individual to individual, in relation to age, sex,
Described as a generalist predator, harbour porpoises have a taste for several species (Leopold, 2015). The identification of different prey in porpoises diets, is not recent. During Rae studies (1965, 1973), he found a variety of species like cephalopods, crustaceans, flatfish, cod (Gadus morhua), sprat (Sprattus sprattus), mackerel (Scomber
scombrus), Norway pout (Trisopterus esmarki), hake (Merluccius merluccius), haddock
(Melanogrammus aeglefinus) and saithe (Pollachius virens). Later on, in 1991 Corbet & Harris discovered new species, including sardine (Sardina pilchardus),
scad (Trachurus trachurus), pollack (Pollachius pollachius), gobies, and blue whiting (Micromesistius poutassou). Although, for Scotland and the east coast of England, Santos (1998) in her study apart from fish, she found polychaetas at porpoises stomachs. For the west side of European waters, Santos et al. (2004) also identified crabs, isopods and amphipods in porpoise diet. However, it is possible that some of those prey might be present because of secondary feeding. Whiting is a piscivorous, that eats many of the prey described above, like crustaceans, annelids, sprat, herring, cod, haddock and other whiting fishes (Hislop, 1991), while herring is eaten by cod and other gadoids (ICES, 2011a). Gadoids can, also, ingest or be hosts for parasitic copepods (Rae, 1973), misleading the real prey species eaten by porpoises. Besides the widely variety of prey species presented on their diet, porpoises showed preferences for sandeel and whiting, along Scottish waters (Santos, 1998).
Old descriptions on porpoise diet around British waters, stated that porpoises mainly feed on herring (Southwell, 1881; Van Beneden, 1889). Years later, at the northeast Scottish waters, porpoises had whiting as primary prey (Scott, 1903). This result was obtained by Scott after stomach content analysis, where he found otoliths belonging to whiting and sandeel. For Scottish waters, Rae carried out studies (1965, 1973), between 1959-1971, showing that almost half of harbour porpoise diet was based on herring (15.6%) and whiting (25%). In a recent study, for Scotland and the east coast of England, Santos (1998) registered a consumption of 14640t of whiting, 13800t of sandeels and 1000t of herring, per year. Besides whiting and sandeels being found as main prey, she even noted cod as a primary prey. At the 21st century, off the east coast of Scotland whiting and
6
reproductive status, season, cause of death and reflecting prey abundance and distribution. Therefore, the data collected for diet in a specific region should not be applied uncritically to other geographical locations (Pierce & Boyle, 1991).
For Scottish waters, during 1992 to 2003, Santos et al. (2004) made demonstrated the existence of regional, seasonal, and inter-annual variation in porpoise diets. Santos (1998) noted that sprat was most important in porpoise diet in 1992-1993, while herring started to be important in 1994. Recently, herring and sprat rarely occurred in stomach contents, suggesting that their importance has been changed along the years (Santos, 1998; Santos
et al., 2004). Other study carried out by Santos (1998) reported the prevalence of sandeels
in spring and summer diets of Scottish harbour porpoises. Santos (1998) and Santos & Pierce (2003) were not certain if it was the increase in their availability and/or the decrease of whiting abundance, that led to this result. Also, the increased amount of whiting during autumn and winter in porpoises diet could be related with the same principle above (Santos & Pierce, 2003). Winter period often means a high need of high-energy prey (e.g. clupeids, sandeels), however as demonstrated by Leopold (2015) and the studies above, porpoises in the winter prefer lean prey, like whiting and gobies, following the opposite trend in spring time. One of the explanations for porpoises change their preferences could be found in the Santos (1998) citation, “(…) The seasonal
movement together with the ecology of some of the prey species could explain some of the seasonal differences found in the diet”.
Porpoises aged <1yr old demonstrated preferences for gobies and shrimps (Santos et al., 2004). Older individuals show preferences for sandeels, while the youngest animals preferred Trisopterus spp. (Santos, 1998). Also, adult porpoise males ate bigger whiting specimens, and feed on a higher variety of prey compared to females (Santos, 1998; Santos & Pierce, 2003). Energy requirements or different skills to feed can be reasons for these trends (Leopold, 2015).
The cause of those changes remains unclear, however there are analogies than can be made, including if porpoises main prey be depleted by fisheries the possibility of them to switch to prey which are available. In Shetland, when the number of porpoises fluctuated with the status of local sandeel stocks (Evans & Weir, 1996). Or even with species of low preferences, like what occurred in European waters with the decline in herring stocks, the number of harbour porpoises declined too (Smeenk, 1987). However, the above trends could be merely analogies and nothing else, as Weir et al. (2007) observed, in
7
Aberdeenshire, that with the increasing of mackerel the number of porpoises in that area also increased, although mackerel is not commonly recorded in porpoise stomachs. Rae (1973), Santos (1998) and Santos & Pierce (2003) concluded that harbour porpoise diet consisted mostly in commercial important species, which are the most abundant fishes in Scotland. Santos (1998) found a positive correlation (in 3yr out of 5yr) between the most important species eaten by porpoises and fishery landings in Scotland.
Feeding habits are difficult of being carried out through direct observation in their natural habitat (Hammond et al, 2013), for example because of harbour porpoise shy behaviour (Jefferson et al., 2008; Read, 2008). Therefore, the analyses of stomach contents of dead animals will provide the necessary information for whiting and herring. As Casteel (1971) refers the predator stomach contents can help to indicate fish distribution.
1.3. Prey species potential biology/ecology factors of variability 1.3.1. Atlantic Herring (Clupea harengus)
Atlantic herring is one of the species from Clupeidae family that occurs all over the North Sea, being widely distributed from the northern Bay of Biscay to Greenland (Whitehead, 1985). The pelagic adult fishes tend to occur in continental shelf seas (to 200m deep) (Whitehead, 1985) while juveniles are found in shallow waters (ICES, 2011a). Maravelias (2001) show for both life stages higher abundances in shallow waters (<150m). Their shallow habitat made them an easy prey for porpoises.
Adults and juveniles, like the carrying capacity of herring’s early life stages (Nash et al., 2009) can be compromised by the availability of food and by ecological conditions (Maravelias, 1997, 2001). Changes in the environmental conditions can shift the traditional spawning grounds and the spawning peaks (Maravelias, 1997). As a demersal spawner, herring moves to shallow waters (15-40m deep) with gravel beds (Whitehead, 1985; Nash et al., 2009; ICES, 2011a), to attach its pelagic eggs (Whitehead, 1985). Herring spawns in autumn and spring, being the first season possible to be extended from September to January (ICES, 2011a). On Scotland, Moray Firth and Firth of Forth are important nursery grounds (ICES, 2011a), the planktonic larvae often move to inshore waters (Whitehead, 1985) and after 2yrs, herring moves into deeper waters to join to the adult population that migrates to the western part of the North Sea (ICES, 2011a).
8
Maravelias (2001) stated that older and larger fishes occur more offshore. He studied the case of Shetland Islands where on the west coast larger fishes were observed when compared to east side. In North Sea waters the lifespan is less than 7yrs, with a maximum length range of 20-30cm (ICES, 2011a). Herring usual swims in large schools (Whitehead, 1985; Camphuysen, 1990; ICES, 2011a), with diurnal vertical migration patterns, moving to the surface at the sunset and dispersing during the night (ICES, 2011a).
Herring is one of the most important pelagic fishes in several North Atlantic ecosystems, being an important prey for many predators such as other fishes, seabirds and marine mammals (ICES, 2011a). For many hundreds of years, herring has been exploited at the North Sea, being an important source of food and economic value for Europe (Simmonds, 2007). Herring is important for both commercial fisheries and cetaceans lives, in Scotland (Parsons et al., 2000), its distribution and abundance can be a proxy for predators and regulates the fisheries actions.
Herring exploitation goes back several centuries, and due to natural environment changes and human exploitation stocks have shown higher fluctuations (ICES, 2011a). Many years ago (1870s), herring was the most profitable species at Scotland, in the Firth of Clyde, on the west Scottish coast (Thurstan & Roberts, 2010). In 1889-1962, the area was closed to trawlers to protect herring spawning grounds, but after 1962 the rules were adjusted allowing to fish again until the decline of herring after 1973 (Thurstan & Roberts, 2010; Heath et al., 2017). Then, in 1984, even with the decrease on landings, they re-open all the area again to trawling expecting to increase herring catch levels and with the intention to explore new species (e.g. Norway lobster) (Thurstan & Roberts, 2010; Heath
et al., 2017). In that region, around 2005, the demersal fishery ceased, and in late 2000s
the only demersal fish landings were from bycatches from other fisheries (Thurstan & Roberts, 2010; Heath et al., 2017). Considerable fluctuations in catches were observed before and after the World War II (1939-1945) (ICES, 2011a), but Whitehead (1985) stated that fact could result from the fishing effort, and not from herring availability. In the North Sea, after 1950s, herring fisheries had a high level of expansion (Simmonds, 2007), to suffer some years later (1964-1978), one of its biggest stock collapses due to human overexploitation (Whitehead, 1985; Simmonds, 2007; ICES, 2011a), possible a consequence of lack of regulation during that time (e.g. no catch limits) (Simmonds,
9
2007). The herring stock has recovered slowly only after the closure of the fishery and with the application of strict rules (Whitehead, 1985; Simmonds, 2007; ICES, 2011a). Simmonds (2007) reported a moderate to large stock size between late 1980s and early 1990s. However, another period of greater decline was very clear in 1994/95 (Maravelias, 1997; Simmonds, 2007). Simmonds (2007) related this fact with high fishing mortality while the Maravelias (1997) study showed that in 1994/95 environmental changes (e.g. Sea Surface Temperature - SST) were the reason for low herring abundance. In 1997, an EU/Norway management plan was applied, that resulted in the recovery of stock observed in 2003 (Simmonds, 2007; Dickey-Collas, 2016).
Nash et al. (2009) agrees that environment changes linked with overexploitation can be the reasons for those herring collapses, and the new EU landings obligations helped to reverse the declines (Dickey-Collas, 2016).
Nowadays, fisheries continue all year with peak catches between October and March with a minimum landing size of 20cm for the North Sea (ICES, 2011a). Its exploitation usually is done by purse-seine, distinct types of trawls and in inshore waters with drift nets (ICES, 2011a). According to Dickey-Collas (2016), presently herring from the North Sea is sustainably fished, with ~400000t catches per year (1995-2013), with the spawning biomass above the limit reference points (Blim=800000t).
1.3.2. Whiting (Merlangius merlangus)
Whiting is one of the species from Gadidae family that occurs widely spread along the Scottish coast (ICES, 2011b). It is a demersal species which inhabits shallow waters (10-200m) (Whitehead, 1986; ICES, 2011b), like herring its habitat facilitates to be captured by porpoises.
One of the regular spawning grounds is situated at the north of Dogger Bank, along the east coast of Scotland (Loots, 2010). Even a demersal species, its eggs are pelagic, and the spawning season peak occurs at springtime, between March-June, for the northern waters (Hislop, 1984). High number of immature whiting occurs off the Scottish coast (ICES, 2013). Males grow to a small size than females (ICES, 2011b), and the species can live ~20yrs (ICES, 2011b).
Its migration through north-south are carried out along the coast of Scotland, while in Shetland waters they even move to offshore, in direction to east and south waters (Hislop
10
& Mackenzie, 1976). On a daily basis, whiting feeds at night near to the bottom and during daylight he moves into the water column and feeds on pelagic prey (Rindorf, 2003). In summer many individuals are observed offshore the Scottish coast (ICES, 2011b). Whiting is a very important prey for many piscivorous fishes and marine mammals (ICES, 2013, 2014, 2017). In cold seasons, the specimens which are not possible to be caught by fishermen due to their small size are the main prey of harbour porpoises (Santos, 1998; Santos & Pierce, 2003).
Over many years, demersal fisheries in the North Sea and adjacent waters have taken whiting as one of the main target species (Whitehead et al., 1986; ICES, 2013), and nowadays it has reached high market values (Scottish Government, 2017). The outburst in 1960s-1970s of gadoids was apparently related with the high productivity of the ecosystem (ICES, 2014a), and could had help to increase whiting abundance. However, catches fell to an historical low in 1998 (ICES, 2011b). Since 2000, whiting has recovered slightly in Scottish waters (Heath et al., 2017), although registering a 2nd historical low level between 2005-2008 (ICES, 2017). Nowadays, for some areas (north, west) of the North Sea whiting abundance has been increasing, while in others (south, east) it has declined (ICES, 2011b, 2014; Napier, 2014).
Environmental factors (e.g. SST) can be linked with the low abundance of whiting in recent years (ICES, 2014a). Since 2008, the spawning stock biomass (SSB) has been well above the biological reference point (Blim=172741t), and for the North Sea and west
Scottish whiting has been harvested in a sustainable way (ICES, 2016, 2017d).
With a minimum landing size of 27cm (ICES, 2011b), whiting is caught all year (ICES, 2013) with mixed trawl fishery gears (e.g. demersal, beam, Nephrops trawl) along with other gadoids (ICES, 2011b, 2013) but it has been captured as bycatch by industrial fisheries (e.g. Norway pout, Nephrop) (ICES, 2013, 2014). Since 2012, more selective gears and a reduced fishery bycatch have decreasing whiting fishing mortality, but even with the reduction on the number of bycatches, the MSY (Maximum Sustainable Yield) remains high (ICES, 2014a). Due to is main role in porpoises diets, his abundance can made lead to changes in porpoises choices.
11
2.
Objectives
Considering the literature (Southwell, 1881; Van Beneden, 1889; Scott, 1903; Rae, 1965, 1973; Santos, 1998; Santos et al., 2004, Pierce et al., 2007; Marubini et al., 2009; Leopold, 2015), it is apparent that herring and whiting have been part of the harbour porpoise diet in Scottish waters over a long period of time. We were interested in investigating the variation in importance of those these two fish species in the diet of porpoises in Scottish waters during 1992-2014. Over this period, fish stock abundance has fluctuated widely and piscivorous predators might be expected to adjust their diet to reflect these changes. In addition, it is likely that energy demands and foraging skills both increase as porpoises grow larger, and that mature females have higher energy needs than mature males, and these differences may be reflected in the diet. We therefore propose the following main hypotheses:
• The importance of whiting in the diet increases when herring are less important and vice versa.
• The consumption of herring and whiting by harbour porpoises increases when these fish are more abundant in the sea.
• The consumption of herring and whiting varies regionally (within Scottish coastal waters), seasonally, over time (1992-2014) and in relation to porpoise physical characteristics.
From these,
• Bigger porpoises will eat higher amount and larger sized herring and whiting. • Females will eat higher amount and larger sized herring and whiting, compared to
12
3.
Material and Methodology
3.1. Source of Harbour porpoise diet samples
Harbour porpoises found stranded on the Scottish coast, and occasionally floating at sea in Scottish waters, entangled in fishing nets or killed by bottlenose dolphins, were used to study the diet of the harbour porpoises in Scottish waters.
The Scottish Marine Animal Stranded Scheme (SMASS) has been collecting samples from dead harbour porpoises from different Scottish locations, during 1989-2016 (Figure 3.1.).
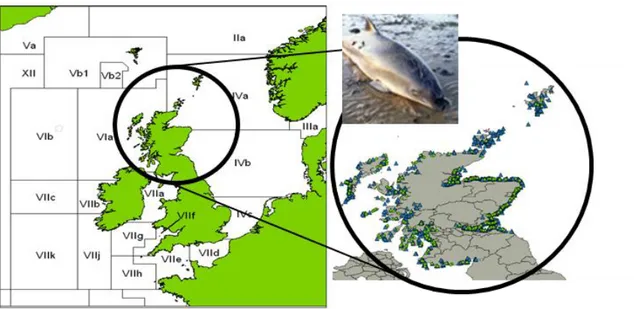
Figure 3.1 - Harbour porpoises stranded in Scotland (1989-2016)
Geographical distribution map of the harbour porpoises found death, around Scottish coast and waters (1989-2012, ▲, n=1450; 2013-2016, ●, n=324). (source SMASS/QGIS 2.10)
Between 1989 and 2016, SMASS recorded 1774 dead harbour porpoises which could be potential sources for a diet study. Unfortunately, from most of them (n=1468) there was no information about their diet, especially from the ones recovered during mid-1989-1991, before the stranding network was fully funded. Of those animals sampled, 8 animals were found with an empty stomach.
The information provided by SMASS was not always complete, probably due to the difficulty of access to some animals or their advanced state of decomposition, but also due to limited funding for necropsies. Dietary data were collected by several researchers and some inconsistencies were found in the way the data were collected. Consequently,
13
the total number of samples used for the analysis during the present study was less than expected.
In order to study the variability in the diet of harbour porpoises, I analysed the relationships between the consumption of herring and whiting and their stock status, porpoise sex and body length (cm), and the year, season and location where they were found dead.
3.2. Sampling, Processing and Storage diet samples
Firstly, it was mandatory to wear gloves and a lab coat to handle the biological material from the porpoises. Necessary precautions suggested by different authors (e.g. Pierce & Boyle, 1991; Watt et al., 1997). During a necropsy, usually, the stomach samples are frozen, or stored in alcohol or in formalin (Fitch & Brownell, 1968; Treacy & Crawford, 1981; Härkönen, 1986; Watt et al., 1997). The University of Aberdeen study avoided the use of formalin due to its harmful properties and the fact that it dissolves otoliths. The stomach contents were sieved with a mesh of 0.25-0.5mm (Treacy & Crawford, 1981; Prime & Hammond, 1987), and so skeleton bones and otoliths were separated according to their shapes and densities. The contents were placed in an aluminium foil container (the type used for take-away meals), and water was added. Due to the density of otoliths compared with other structures (Treacy & Crawford, 1981; Pierce & Boyle, 1991; Watt
et al., 1997) they sunk in the bottom of the container. This gross sorting helped to separate
flesh and intact skeletons from the sample, and to avoid the sieve to be clogged (Treacy & Crawford, 1981). Also, floating on the water were the lighter structures that were decantated into the sieve (Treacy & Crawford, 1981). One by one otoliths and bones were removed and kept separately in vials. Residual material from sorting procedure was set aside for future analysis (Treacy & Crawford, 1981). Hard structures, like otoliths and It’s important to note that the date/location and physical characteristics of porpoises were collected by SMASS’s team during their necropsies. The stomach contents were analysed by researchers at the University of Aberdeen: during 1989-2003, most sampled were analysed by Begoña Santos research while for 2003-2016 several different students collected the data. All this available information was compiled in one single Excel file. Several stomachs not previously examined were processed and the data added to this database as result of the laboratory work of the current author (2004-2014).
14
bones were kept dry (Fitch & Brownell, 1968; Härkönen, 1986; Watt et al., 1997; Assis, 2000; Campana, 2004). Otoliths could change their shape if stored in alcohol (Jobling & Breiby, 1986) or formalin (Fitch & Brownell, 1968; Treacy & Crawford, 1981; Campana, 2004). All the storage plastic or glass vial were labelled outside and inside, as recommended by Roper & Sweeney (1983) and Watt et al. (1997), using a water-resistant marker and pencil on waterproof paper respectively.
3.3. Skeleton structures used for diet identification
Fish remains from stomach contents were the source to describe the harbour porpoise diet. As the literature suggested the recovery of skeleton structures (Casteel, 1971), and other hard parts of the body (Bowen & Iverson, 2012) helped in the identification of the prey. To identify herring and whiting and to estimate their weight and length, the informative skeletal remains used were mainly sagittae otoliths and jaw bones (premaxillae, dentaries)
Along the years, studies have shown how useful and accurate otoliths have been to identify prey species due to their particular shape and size (Adams, 1940; Casteel, 1976; Frost & Lowry, 1981; Härkönen, 1986; Jobling & Breiby, 1986; Pierce & Boyle, 1991; Assis, 2000; Bowen & Iverson, 2012). Their use relies on their resistance to digestion process (Fitch & Brownell, 1968; Treacy & Crawford, 1981; Härkönen, 1986; Bowen & Iverson, 2012), for example, Gadidae otoliths are more resistant than the ones from Clupeidae (Da Silva & Nielson, 1985; Jobling & Breiby, 1986). The sagita seemed to be the most adequated to use not only because of its shape and structure, but also it is the largest earstone among marine fishes (Jobling & Breiby, 1986; Bowen & Iverson, 2012). However, for some researchers the use of the 3 pairs of otoliths (sagittae, asterisci, lapili) are a stronger tool to distinguish between species (Adams, 1940). Equally important, it’s to have an identification key reference of the different species life stages (Jobling & Breiby, 1986). As an example, it seems that otoliths from adults can be well identified (Casteel, 1976), while, for some families, otoliths from juveniles are hardly identified to the species level (Härkönen, 1986).
As a suggestion procedure, to be visualized under the microscope the otoliths were oriented with the sulcus cavity up, with the posterior margin to the left side and anterior margin right-sided (rostrum), (Härkönen, 1986; Assis, 2000).
15 The prey remains analysis was very time consuming and almost inexpensive but for a reliable identification it requires experience “eyes” (Pierce et al., 2004), and so prof. Graham Pierce was consulted several times. Also, to an inexperienced worker, as the present author, the recommendation was to make use of a reference collection and identification guides (Pierce & Boyle, 1991; Assis, 2000; Pierce et al., 2004; Bowen & Iverson, 2012). The reference collection, from Scotland region, it’s held in the IIM (Instituto de Investigaciones Mariñas de Vigo). The publish guides for bones were from North Sea species (Watt et al., 1997), and the otolith guides were from Northeast Atlantic
Besides otoliths, other skeleton bones were mentioned by the literature as useful for diet analysis, too (Fitch & Brownell, 1968; Casteel, 1976; Watt et al., 1997; Granadeiro & Silva, 2000; Bowen & Iverson, 2012). To help in the identification and when otoliths weren’t representative of the sample, jaw bones offered an excellent way due to their variety of forms (Watt et al., 1997; Bowen & Iverson, 2012), specially the premaxillae (Watt et al., 1997). However, even with the use of premaxilla, between species from the same family the differences were not always obvious. Vertebrae were useful when the head of the prey wasn’t eaten, and because they can be found in high amounts in the stomach (Casteel, 1976; Watt et al., 1997). Due to their hard structure and low variation along the vertebral column (Watt et al., 1997), the caudal vertebrae were used just only to help clarifying the identification of the species. Bowen & Iverson (2012) said that vertebrae are useful for identification, but they don’t provide prey quantities, and therefore in this study they were not used for estimations. Beyond jaw bones and vertebrae, as recommend by researchers, other structures were used in case of identification doubts, such as opercular series (Watt et al., 1997), cleithrum (Hansel et
al., 1988; Wheeler & Jones, 1989), or posttemporal bones (Wheeler & Jones, 1989).
According Watt et al. (1997) and Bowen & Iverson (2012), the importance of other bones relies on how difficult is to distinguish otoliths between species, and an example is inside the Gadidae family (e.g. whiting vs blue whiting) (Pierce & Boyle, 1991).
In the case of some families, the right and left structure of a premaxillae and otoliths (e.g. Gadidae, Clupeidae) did not have any significant asymmetry and so did not require a separately analysis (Messieh, 1972; Frost & Lowry, 1981; Watt et al., 1997). All them have distinctive features that facilitated the identification process (Härkönen, 1986; Watt et al., 1997; Granadeiro & Silva, 2000; Campana, 2004).
16
and Artic species (Härkönen, 1986). Casteel (1976) and Watt et al. (1997) refer both tools, guides and reference collections, as of high value for identification of prey species. Fitch & Brownell (1968) demonstrated the importance of knowing the resident fishes of the study region, for after to be compared with the collection material. Casteel (1971) even refers that this fact offers reliability to the information acquired from the bones identification process. Therefore, the knowledge of the Scottish fauna and previous information about harbour porpoise diet, for a specific region, helped to give an idea of the possible species that can be found on their stomach contents.
3.4. From skeleton to quantification of diet composition
The next step after the sorting of the bones, it was to measure otoliths and jaw bones which helped to predict the length and weight of herring and whiting that was eaten by porpoises. Also, it was counted the number of otoliths, premaxilla and dentaries in each stomach.
The number of individuals of herring and whiting was estimated firstly from the number of otoliths. In the absence of otoliths other remains were used, and when the otolith was broken, but it still had more than half of its size, it was counted as one otolith. Per stomach, when resulted to have ≤50 otoliths of one fish species, all of them were measured; when >50, a random sample of 30-50 of those otoliths were measured. As suggested by many authors, to obtain meaningful values is necessary to use randomly samples with a moderate-large size (n>30) and evenly distributed (Härkönen, 1986; Pierce et al., 2004; Pierce et al., 2007; Bowen & Iverson, 2012).
During counting, some samples had enormous amounts of otoliths and so they weren’t counted one by one, instead it was weighted a sub-sample (±0.01mg), and from that it was calculated the approximately real number of otoliths presented in the main sample. After counting the total number of otoliths, premaxilla and dentary, it was calculated the number of herring and whiting, per stomach. For each species, the highest number of structures identified it was considered the minimal number of individuals eaten from that same species. It was taken into account that some skeleton structures like maxillae, premaxillae, dentaries, otoliths and eyes exist in pairs (Pierce & Boyle, 1991; Santos, 1998), hence during the estimation of the number of prey, each structure was considered to be 0.5 of a fish. This step was made very cautiously because of the high probability of
17
overestimation, when using different bone structures. For that reason, it was considered only the number of otoliths to predict the final number of individuals, unless otoliths weren’t present. An example, (M007/06), it was the case of whiting that was identified with 7 otoliths and 4 premaxillae. Because they are both paired bones their number was divided by two and because the highest number came from otoliths, so it resulted in 3,5≈4 whiting (0.5 means 1 more otolith and so it contributes with 1 more individual) as the minimum number eaten by that porpoise. However, for the same sample, an unknown Gadidae was identified with 3 otoliths, 33 maxillae, 15 dentaries and 1 premaxillae. The highest structure’s number was 33 maxillae and so it should had been 16.5≈17 unk. Gadidae that had been eaten, but no. Some of that 33 maxillae can had belonged to the whiting referred above or other species from the same family, and at the end it was consider only 2 unknown individuals Gadidae (3/2₌1.5) present in the stomach. Other situation, it was when there was a sample with bones that were identified with more than one species and bones from only one species. After divided the total number of structures by 2, the total minimum number of individuals was calculated like: 1.5whiting ind.+2.5 Whit./Trisop. ind.= 4ind., rather than 1.5whiting ind.≈2+2.5 Whit./Trisop. ind.≈3 = 5 individuals.
For measurements it was used a calliper (0.05mm) for bigger structures (centimetres size at the naked eye). And a binocular microscope for smaller ones, as advised by Fitch & Brownell (1968). This last instrument had an eyepiece graticule (0.1mm/10mm) and 4 lens magnifications (x6, x12, x25, x50). To get the real size of the bones the final measurement values were calibrated using the correction factors (per unit): x6 - 0.26mm; x12 – 0.125mm; x25 – 0.06mm; x50 – 0.029mm.
For measuring skeleton bones, Watt et al. (1997) referred that “all the dimensions should
be taken in straight lines, without correcting the curvature of the bone”. For jaw bones it
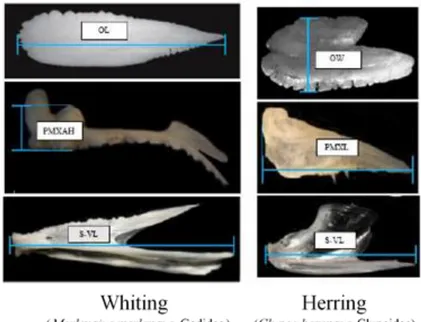
was essential to measure the specific dimensions for each species, as happened to otoliths (Watt et al., 1997; Hernandez-Milian, unpublish). The standard dimensions for premaxillae and dentaries (Figure 3.2) which were measured were the ones mention in
Fish length and weight were calculated from regressions on otolith size, based on Härkönen (1986), Brown (unpublished) and Hislop (unpublished) work (Appendix). Although, due to the otoliths shape there are standard measurements, for Clupeidae and Gadidae family, is the otolith width (OW) and the length (OL), respectively (Härkönen, 1986) (Figure 3.2, top images).
18
their respectively regression formulas (Appendix). Jaw bones were described as good estimators of fish length and weight when the right measures are selected (Hansel et al., 1988).
Figure 3.2 - Standard measures for otoliths and fish jaw bones
Standard measurements for whiting and Atlantic herring, from otoliths (top images), premaxillae (central images) and dentaries (bottom images). (adapt. Hernandez-Milian, unpublish)
The regression formulas were chosen regarding their Pearson’s correlation coefficient (r) and sample size (n). It wasn’t always possible to calculate length and weight through the bone size regressions. Regressions for herring from otolith length to fish weight and length weren’t available. Also, when the final identification of an otolith or a jaw bone was more than one species, the regression formula used was a combination of those species (e.g. otolith identified as Whit./BLW (Appendix). However, not all the combined It was supposed to use standard measurements, due to their consistency with the real dimensions (Casteel, 1976; Härkönen, 1986; Watt et al., 1997; Brown, unpublish; Hernandez-Milian, unpublish). However, in some occasions, it was necessary to use dimensions beyond the ones stablished at the beginning. The dimensions suggested are rated regarding their precision with the real fish size and so when it wasn’t possible to measure the standard dimensions, the next in the scale rate it was taken in its place. Sometimes it was even measured more than one dimension for a single bone, especially with broken structures and ambiguous identification among the species (e.g. Whiting/Trisopterus spp., Whiting/Blue whiting, unknown Clupeidae).
19
The diet composition of harbour porpoises included the number or the presence/absence of whiting and herring in the stomach, as much as herring and whiting length and weight. Later on, to predict the variability of the diet, the response of those variables were study in relation to porpoises physical characteristics, geographical area, year, seasonality and the stock status of herring and whiting.
3.5. ICES stock assessments of herring and w hiting
Every year, as a commercial species, herring and whiting are subjects of an analytical stock assessment (VPA) which means that estimations of their stock in the North Sea are
At the beginning the two main species that had been referred along the text, herring and whiting, became a combination of other fish species. During the sorting, some samples were identified with more than just only herring or whiting, as mentioned before. For this reason, the data coming from the bone structures identified as Whit./BLW (Merlangius
merlangus/Micromesistius poutassou), Whit./Trisopterus spp. (Merlangius merlangus/Trisopterus
spp.) and whiting (Merlangius merlangus) were used as information of whiting. And Herring/Sprat (Clupea harengus/Sprattus sprattu), unknown Clupeidae and herring (Clupea
harengus) as data of herring.
samples had combined regressions to be applied, like the case of Whit./Trisopterus spp.. The jaw bones were the ones with less access to regression equations. Although, broken and eroded otoliths or bones were not submitted to any type of calibration. The lack of bone regressions had limited their contribution to estimate fish length and weight.
Each value resultant from the bone regression was representative of the length and weight of each fish, in the porpoise stomach. However, because the bones used were paired, in the case of the fish weight, that value was multiply by 0.5. In a general way, each porpoise had more than one individual from the same species on its stomach, so it was calculated an average value for weight (after x0.5) and length, too. Also, when it was measured less bones (≈40) that the ones that were really found in the stomach, the rest of the fish weight were estimated through a rule of three (e.g. mean whiting weight of all sample=8.45g, no. of whiting otoliths measured=30, no. of whiting otoliths counted=115, total mean weight=8.45gx115/30). In the case of length this step was not necessary. Therefore, the length (mm) and weight (g) of whiting and herring found in each porpoise stomach was estimated.
20
available. The recruitment data and the spawning stock biomass (SSB) were undertaken by the respective ICES assessment working groups (e.g. ICES Herring Assessment Working Group), during research trawls surveys (Santos et al., 2004). The ICES areas 6a, 4a, 4b, where these assessments are carried out, include the surrounding Scottish waters. Survey grids are based on ICES statistical rectangles (30x30 nautical miles), each rectangle is often fished per ships of two different countries, and usually twice a year they do a survey (January-February; August-September) (ICES, 2012). During the tow the standard fishing speed should be between 3.5-4.5knots, for 30min., with an average of 4/5 hauls per day and with a maximum fishing deep of 200m for the North Sea (ICES, 2012).
Likewise, in the case of whiting, the advice ICES report was a combination of 4 area with division 7d (North Sea and eastern English Channel) (ICES, 2017d). The report for 6a area was single (ICES, 2016). Whiting recruitment (age 1) and SSB data for 4 and 6a ICES area were collected by the Working Group on the Assessment of Demersal Stocks in the North Sea and Skagerrak (WGNSSK) and the Working Group for the Celtic Seas Ecoregion (WGCSE), respectively (ICES, 2016, 2017d).
For the stock status, the recruitment and SSB data of whiting and herring were used as variables which may predict the variability of whiting and herring that was eaten by
Herring stock data was available for ICES area 6a (West of Scotland) (ICES, 2014), but since 2015 it has been an assessment combined with the area 7b-c (ICES, 2017a). ICES still assume that separate stocks exist (ICES, 2017a), but because a mixture of fish from the surrounding areas were identified, ICES began to combine the assessments advise (ICES, 2014). Despite data just for area 6a seemed more specific, the combined report had updated estimations and assumed to be more complete. In this report the data recruitment data was for the age of 1, and the SSB had the followed note “For this autumn- spawning stock, the SSB is determined at spawning time and is influenced by fisheries between 1 January and spawning (September).” (ICES, 2017a). Also, area 4 (North Sea) advice was combined with 3a and 7d divisions (ICES, 2017c), and was the one used in the present study of ICES areas 4a, 4b. The report area 4 had recruitment data for the age of 0 and SSB was estimated at spawning time (September). Both combined reports have been collected by the ICES Herring Assessment Working Group for the Area South of 62ºN – HAWG (ICES, 2017a, c).