Intermediaries, Financial Markets and
Growth: Some more International Evidence
António Afonso,
*1Raquel Ferreira,
* 2Edmund Freitas,
* 3Celso Nóbrega,
* 4and José Pinheiro
* 5December 2002
Abstract
We examine how financial institutions affect growth, taking into the account the organisational features of the financial system namely systems characterised by strong financial intermediaries and systems where the financial markets assume a more important role. We use a panel of 24 developed and developing countries over the 70s, 80s and 90s, to evaluate the existence of possible links between the type of preponderant financial system (bank-based or more capital markets based) and economic growth.
JEL: C23; G20; O40
KEYWORDS: Financial system; Economic growth; Panel analysis.
*
ISEG/UTL - Technical University of Lisbon, R. Miguel Lúpi 20, 1249-078 Lisbon, Portugal. 1
CISEP - Centre for Research on Portuguese Economics, ISEG/UTL. Corresponding author, email: aafonso@iseg.utl.pt.
2
email: raquelferreira78@hotmail.com. 3
email: efreitas@cotavalor.pt. 4
email: celso.nobrega@cgd.pt. 5
Contents
1. Introduction ... 3
2. Financial Systems ... 4
2.1. Financial Intermediaries ... 4
2.2. Financial Markets ... 6
2.3. Some external conditioning factors ... 7
3. Empirical Literature Review ... 10
4. Panel Analysis: Financial Intermediaries versus Capital Markets ... 12
4.1. Credit Impact on GDP ... 13
4.2. Stock Market Impact on GDP ... 16
4.3. Credit and Stock Market Capitalisation Impact on GDP Growth ... 19
5. Conclusion and Summary... 22
References ... 22
1. Introduction
Different models of financial systems coexist in modern economies. Allen and Gale
(2000) broadly classify financial systems as systems of “German type,” where financial
intermediaries dominate, and systems of “American type,” where financial markets are
more predominant. For instance, the euro area financial system might be characterised
as a bank-based system given the important role of banks in the majority of the
countries. The US is the more straightforward case of a market-based financial system.
However, these differences are always somehow relative for a given country. Also,
financial systems do evolve over time, generally towards the increase and complexity of
financial operations and services offered to the economic agents. In other words, the
trend seems to be an increase in the development of financial markets and financial
innovation, even if financial intermediaries remain the main providers of funds for
households and enterprises.
Recent literature stresses the importance of the coexistence of the two types of systems
in a single economy. Stulz (2000) suggests that the existence of developed financial
markets allows the banks, as investors, to limit its exposure to some economy sectors,
therefore reducing its operating risk levels. The coexistence of financial intermediation
and developed financial markets tends to increase the competition among financial
systems in an economy, leading to reductions in the transaction costs that enable
increased investment rentability. Thiel (2001) underlines the importance of the
adaptation and evolution of financial systems in order to satisfy the economic needs.
For instance, the role of venture capital in stimulating investment in risky economic
sectors, which frequently also possess a large growth potential.
In this paper we use a panel data approach to examine the role financial systems play in
economic growth. The paper adds to the existing literature by dividing the country
sample into three groups, according to the so-called “predominant” financial system:
bank-based systems; financial markets based systems and also a third group of
The remainder of the paper is organised as follows. The next section discusses the main
characteristics, and advantages of financial intermediaries and financial markets,
namely concerning financial systems development. Section three briefly reviews the
existent evidence on the financial system-growth relation. Section four is devoted to the
panel data analysis of the aforementioned relationship for a sample of 24 developed and
developing countries. Section five concludes the paper.
2. Financial Systems
For the majority of the countries, the usual way of financing economic activity still is
through financial intermediaries, either monetary and financial institutions or insurance
companies and pension funds. Nevertheless, the value of non-intermediated assets,
through the bond and the stock market, has been rising and in some countries already
accounts for a substantial share of GDP, higher than the value of intermediated assets.6
One may consider as examples of intermediated assets deposits, investment fund shares
and technical reserves, and as intermediated liabilities loans granted by the
intermediaries. Also, one can think about securities and listed and non-listed shares as
non-intermediated assets, while indirect financing to the economy is broadly carried
through bonds and shares and other equity.
2.1. Financial Intermediaries
Economic literature identifies five different mechanisms through which financial
intermediation can have effects on economic growth. i) efficient allocation of financial
resources; ii) the mobilisation of savings; iii) the reduction of information costs; iv) the
reduction of supervision costs in investment projects, and v) the diversification of risks
(specific risks, external shocks and inter-generational risks).
Greenwood and Javanovic (1990), point out the role of financial intermediaries as
selectors of investment projects, the selection of more profitable projects resulting from
the evaluation of the more favourable risk/return project rates. The existence of specific
selection criteria theoretically originates a better allocation of financial resources in an
6
economy. However some authors have also illustrated cases where systematic financing
from banks can lead to the development of non-profitable investments or even
investment projects that generate losses over long periods of time.
Tsuru (2000) suggests that an excessive proximity between banks and companies can
reduce the cost of capital but also generate investment in projects, which lack capacity
to generate profit in an acceptable time frame. Indeed, Stiglitz (1985) has long identified
cases where a rise in interest rates can lead to adverse selection problems, a situation
where banks are led to select investment projects with high levels of risk. These two
types of problems - moral hazard derived from excessive proximity between banks and
companies and adverse selection - can hamper the ability of financial intermediaries in
conducting a sound investment selection, thus reducing the allocation efficiency of
financial resources.
The mobilisation of savings, the second identified transmission mechanism, acts as the
main source of resources through which financial intermediaries are able to channel
funds for investment, as mentioned for instance by Sirri and Tufano (1995). This
capacity tends to increase the overall rate of profitability of capital in an economy.
As stated by Levine (1997, 1999), financial intermediaries have the capacity of reducing
the information gathering costs associated to the development of investment projects. A
reduced number of financial intermediaries can therefore collect the necessary
information to implement and develop new investment projects. Otherwise, each
investor, individual or institutional, would have to invest primarily in gathering its
necessary information, what would be a more costly and time-consuming process.
Sharpe (1990) also mentions, as a positive aspect of the proximity between banks and
companies that additional reductions regarding the costs of information can be achieved
whenever there is satisfactory information symmetry between the two parties involved.
Financial intermediaries also have an important control role, by assuming the
responsibility of being well informed and updated about the projects to which financing
is directed. This delegated monitor role is already well explained in the literature.
Additionally, Dewatripont and Maskin (1995) claim that the monitoring and
intermediaries, in comparison with financial markets. Also, financial intermediation
allows for inter-temporal risk smoothing, which constitutes part of the defensive
mechanism of an economy to external and multi-annual shocks. This process originates
from the management of provisions and bank reserves in the long run.
2.2. Financial Markets
Financial markets allow investors to directly diversify its investment portfolio and to
select the level of risk exposure in accordance with its inherent risk aversion
characteristics.7 However, financial markets do not allow for intergeneration risk
sharing, since different generations participate in the market at different times (see on
this topic Qi (1994) and Fulghieri and Roveli (1998)).
Despite this shortcoming, financial markets have several characteristics that play an
important and positive role in economies and growth. As an example, one can mention
the financing of a substantial number of projects that was performed through financial
markets at least since the industrial revolution of the nineteenth century. Allen and Gale
(2000) and Thiel (2001) mention the proven capacity of financial markets, particularly
in the US, to finance new economic sectors, of which telecommunications, media and
technology are examples.
By aggregating a vast set of opinions and expectations, financial markets have a role in
distributing and reassigning the risk of the underlying assets amongst a large number of
investors, which would otherwise have no contact with the projects they end up
financing. The mobilisation of resources depends upon the degree upon which investors
decide to assume long positions in the financial assets typically available through
financial markets, as well as on the attractiveness of the market capitalisation evolution
over time. In countries where financial markets are sufficiently developed and play an
important role, such as in the United Kingdom or the United States, this mobilisation
effectively seems to occur.
7
Also, financial markets often enable the development of compensation models that
establish a relation between operational performance and management compensation
schemes. Thus, companies have an incentive to link management compensation to
performance, and managers an incentive to increase capital profitability.
As to the costs of information gathering, financial markets appear to be in disadvantage
since information is gathered through more agents than in a financial system that relies
more intensively on intermediaries. However, stock market quotation evolution can
assume a monitor-type role. Another topic associated to an efficient financial resource
allocation enabled by financial markets is acquisitions and mergers, and an active
control market that seems more widespread and developed whenever financial markets
have an important degree of development and dimension.
2.3. Some external conditioning factors
It is worthwhile to mention some factors that, given its contours, may considerably
influence not only the development of financial systems but also the mechanisms
through which financial systems influence economic growth, and even the way
economic growth occurs, regarding the specialisation of economies. The interpretation
of results of econometric studies having by focus macro-economic variables, such as the
results presented in this paper, may well be incomplete without having in consideration
the influence of other sort of factors. This why we think it is helpful to summarise here
some of the most relevant insights emerged from this type of research.
Several authors, such as Carlin and Mayer (1999, 2002) and Levine, Loayza and Beck
(2000) offer detailed studies of the interaction between financial systems and economic
growth by analysing exogenous factors that bound the transmission mechanisms, such
as legislative structure and country specific company ownership characteristics. Franks
and Mayer (1962) had already reported the main differences of ownership concentration
between the US and UK, as well as between these countries and France or Germany.
They noted that in the US and in the UK a large and relevant portion of companies have
its performance evaluation linked to the stock market performance of its stock, and its
ownership dispersed by a large number of institutional or private investors. In France
not as impressive as in the US or UK. In these two countries ownership concentration is
much more the rule, large block-holdings of stocks belonging to institutional investors
or families, rather than to a multitude of small investors. Japan has a “mixed” system,
both phenomena being observed as to ownership structure and stock markets
importance is concerned.
One good reason to consider this type of analysis regards the finding that ownership
concentration systems, such as they occur in France and Germany, seem to be more
compatible with investments that aim to expand the core businesses of companies, or
with diversification processes into “well know ground.” This is more common than
rather having investments destined to more risky and exploratory activities, such as
those frequently associated to state-of-the-art technologies or virtually new, emergent
and unexplored business sectors. In other words, investment tends to be channelled
through the knowledge derived primarily from past experience and learning rather than
oriented to radical, often riskier, new market approaches. However, in a seemingly rapid
changing business environment, the power to enable new businesses, new market
approaches or new technologies, may well represent the difference between economic
leadership and economic dependence, in the long run.
The fact that ownership concentration appears associated in France and Germany, for
example, to financial systems strongly based in financial intermediaries, might suggest a
risk minimisation attitude from the banks perspective when channelling investment to
companies in the form of loans. This factor may, by itself, significantly influence the
type of new investment performed in these economies, thus, in the limit, indirectly
conditioning its specific economic growth rates. Exceptions to this do exist however,
some of it in European companies such as Siemens, Philips and, more recently, Nokia,
to mention just some cases.
In financial systems where financial markets are more developed, risk is widespread
among a large community of investors, and higher profitability rates became a natural
incentive for investors to partially support the higher risks associated with high-tech
development, for example. Large investments in state-of-the-art technology do not seem
to be incompatible with concentration ownership structures and systems where banks
countries like Japan and France have made an effort to move towards financial systems
where stock markets may acquire a larger importance in the near future, which may be a
point in favour to the prevalence of developed financial markets.
Also the degree to which investors are protected by legislation may be of crucial
importance to the operation analysis of transmission mechanisms between financial
structures and economy, as studied by Laporta, Lopez-de-Silanes, Shleifer and Vishny
(1998). In common Law countries, such as the UK, stockholders and investors tend to
be more protected than in countries of French legal tradition or even countries of
German or Scandinavian legal tradition. Laporta et al. (1998) mention that a more
satisfactory investor protection tends to appeal less to the necessity of ownership
concentration, increasing companies access to external financing and reducing the costs
of capital. Levine, Loyaza and Beck (2000) also mention efficiency of the legal systems
regarding Law enforcement as of fundamental importance to promote investment.
Countries where more efficient legal systems are present also tend to have more
developed financial systems.
Also, the existence of rigorous rules regulating the companies release of high quality
and comparable financial and accountability information also appears to be an important
incentive to the promotion of investment, in general, and the development of financial
systems, in particular. Allen and Gale (2000) have noted that the availability of quality
financial information about companies has enabled the development of an active control
market for companies (such as the existing in the US). These authors have claimed that
the existence of such a market helps companies to adopt better investment decisions,
rapidly distributing vital and comparable information among a large set of investors.
Despite all this, most authors keep in mind that economies of different companies in
different stages of development represent specific problems, thus being inappropriate to
generalise an ideal structure for the financial systems or to conceive a possible “general
solution.” According to Gerschenkron (1962) and Huang and Xu (1999) evidence exists
for a decisive importance of banks during the early stages of economic development.
However, a higher importance of financial markets is found for later stages of economic
development. Differentiated phases of economic development seem to have
3. Empirical Literature Review
During the last years several empirical studies that focus on the relation between the
development of financial systems and economic growth have been published. Levine
(1999), Tsuru (2000), and Thiel (2001), present summaries of the relevant papers
regarding the subject. Goldsmith (1969) provided one of the first econometric
researches of the relation between financial development and economic development,
suggesting a parallel between the development of financial systems and economy.8 By
the end of the nineties, the array of research studies performed used mainly two
econometric approaches: i) cross section/panel data analysis (for instance Bassanini et
al. (2001) and Leahy et al. (2001)), and ii) co-integration and causality analysis (see for
instance Rousseau and Wachtel (1998)).
The econometric studies based on cross section data have the purpose of investigating if
there is a relation between representative variables of the financial system development
and economic growth, measured as GDP growth, fixed capital formation or the
productivity of production factors. Representative variables of the financial system are
credit, intermediary margins, stock market capitalisation, and the volume of stock and
other actives traded, among others. King and Levine (1993) found that the following
variables were statistically significant when regressed towards real per capita GDP
growth: net responsibilities as a percentage of GDP, bank credit divided by the deposits,
credits of the central banks, and responsibilities of the private non-financial sector as a
percentage of GDP. The problem of this type of studies, employing cross section data
analysis is nevertheless the determination of the causality direction. Additionally, more
recent studies using panel data analysis manage to investigate more accurately the
relations involved, both in temporal and across time multiple countries data.
Additionally, Granger causality tests can also used to determine a more precise causality
direction. Specifically Rousseau and Wachtel (1998) report a unique causality direction
8
going from financial development to economic growth. A limitation of this study,
however, is the reduced number of countries used in the data sample. Additionally, and
also on related work, Rousseau and Wachtel (2002) report an inflation threshold beyond
which the relationship between the size of a country's financial sector and its rate of
economic growth ceases. Some of the relevant literature and its empirical findings are
summarised in Table 1.9
Table 1. The finance–growth nexus: empirical literature review
Authors Countries/ Period
Estimation Technique Findings Andrés, Hernando and López-Salino (1999) 21 OECD countries (1961-1993) Cross-country regression, unrestricted VAR.
Market capitalisation is the only variable for which significance and causality could be found
Bassanini, Scarpetta and Hemmings (2001) 21 OECD countries (1971-1998)
Error correction panel regression, pooled mean group estimators.
Stock market significant in relation to growth, bank credit only when controlled for inflation variability. Private credit and stock market significant even after controlling for investment. Beck, Levine and Loayza (2000) 63 countries (1960-1995)
Cross-country regression and dynamic panel estimator. Control variables: real GDP per capital, average years of schooling, inflation rate, openness, government expenditure.
Banks exert a strong, causal impact on GDP growth and total factor productivity growth. Results for capital accumulation and savings ratio are not robust or significant Demirgüc-Kunt and Levine (1999) 150 countries (1990s)
Correlation. In high-income countries, stock markets are more active and efficient relative to banks.
King and Levine (1993)
80 countries (1960-1989)
Cross-country regression. Strong relationship between each dependent variable and the financial variables
Leahey, Schich et al (2001)
19 OECD countries (1970-1997)
Error correction panel regression with different specifications to account for country specific effects.
All financial variables significant for pooled mean group estimator. Credit and stock market significant even with control for investment Levine and
Zervos (1998)
49 countries (1976-1993)
Cross-country regression controlling for initial income, inflation, government, social and political variables.
Correlation of stock market liquidity and bank development with future rates of economic growth. Levine,
Loayza and Beck (2000)
71 countries (1960-1995)
Cross-country regression. Exogenous component of financial variables correlated with real economic growth
Rousseau and Sylla (2001)
17 countries (1850-1997)
Cross-country growth regressions. Financial variables important for early development, best results for period prior to 1914, less important for period after 1945.
9A good survey of the empirical literature is also offered by Thiel (2001), both at the aggregate
Table 1. (cont.)
Rousseau and Wachtel (1998)
USA, UK, Canada, Sweden, Norway (1871-1929)
Granger causality in a VAR, vector error correction model.
Evidence of one-way causality from finance to growth
Rousseau and Wachtel (2001)
84 countries (1960-1995)
Cross-country regression. Financial variables explain GDP.
Shan, Morris and Sum (2001)
9 OECD countries and China (1960-1998)
Granger causality test, VAR model.
Causality runs from growth to finance only in 3 countries.
4. Panel Analysis: Financial Intermediaries versus Capital Markets
In the present section we assess empirically the nexus finance-growth for the period
between 1960 and 1999. The variables used to characterise a given country’s financial
system were domestic credit to private non-financial entities (also further referenced
ahead as “credit”) and the stock market capitalisation, or, in the absence of this data,
stock transaction volume. We also use GDP at 1995 prices, measured in US dollars.
Table 2.Country panels
Panels Countries
Developed Countries Austria, Belgium, Denmark, Finland, France, Germany, Greece, Ireland, Italy, Japan, Luxembourg, Netherlands, Portugal, Spain, Sweden, United Kingdom, USA
Developing Countries Argentina, Brazil, India, Malaysia, Mexico, Philippines, Thailand
Financial Intermediates are dominant 1
Austria, Belgium, Finland, France, Germany, Greece, India, Italy, Spain, Portugal
Financial Markets are dominant 1
Malaysia, Mexico, United Kingdom, USA
Intermediate system 1 Argentina,2 Brazil,2 Denmark, Ireland, Japan, Luxembourg,2 Netherlands, Philippines, Sweden, Thailand
1 - Classification borrowed from Tsuru (2000).
2 - These countries are not in Tsuru’s list. We considered them as having an intermediate financial system.
The panel sample of 25 countries is divided into developed and developing countries,
Table 2 shows the aforementioned segmentations between developed and developing
countries, and also between the countries were the financial system is assumed to be
mainly consistent with financial intermediaries dominance or with capital markets
dominance. Tsuru (2000) suggests this last classification.
4.1. Credit Impact on GDP
In order to assess the link between financial markets and growth we use panel data
analysis. One of the advantages of using a panel data approach is that it allows the use
of more observations and gives more degrees of freedom (see namely Hsiao (2002)).
Another advantage may be the reduction of multicollinearity among variables.
The variable chosen as a proxy for the development of financial markets is stock market
capitalisation. Credit to private non-financial entities is used as a proxy for the
development of financial intermediaries. A linear model was used, as specified below:
it it it
it i
it k X k Z Y u
Y = + D + D + +
D g a( 1 2 ) b -1 , (1)
where the subscripts i and t represent country and time, respectively, g is an unobserved
country-specific effect, Y is real GDP (constant 95 prices) in USD, X and Z are the
values assumed by the proxy variables, respectively credit to private non-financial
entities and stock market capitalisation, and u is the error term. The dummy variables k1
and k2assume the values 1 and 0 when the effect of credit on GDP is tested separately.
These two variables change their assigned values when we want to assess the separate
effect of market capitalisation on GDP (k1=0 and k2=1). They both assume the value one
when both proxies of financial system development are considered at the same time.
We present results for the pooled version, assuming that initial country specific effects,
represented by theγi coefficients, are all similar. We also report the results of both the
fixed and random effects models, where the country specific effects vary from country
pooled effects model and the fixed effects model.10 Additionally, the Hausman test is
also computed to compare the fixed effects and the random effects models.
Table 3.Credit as a proxy for financial development: developed and developing countries (k1=1 and k2=0)
Pooled Effects Fixed Effects Random Effects panel 1 (all countries)
g (constant) 18511800000
(8.92)**
-18978000000 (2.71)**
α (credit) 0.0643
(1.73)*
0.0417 (3.50)**
0.0421 (14.84)**
b (lagged GDP) 0.0098 (0.83)
0.0031 (1.74)*
0.0032 (1.16) R2 0.1969 0.6846 0.1958
F - 60.493**
-DW 0.6962 1.4506 0.5393 Hausman Test - - 0.0012
pv=(0.9729)
N 888
panel 2 (developed countries)
g (constant)
23978500000
(8.34)**
-24165500000 (2.49)*
α (credit) 0.0630
(1.74)*
0.0419 (3.45)**
0.0422 (12.58)**
b (lagged GDP) 0.0097 (0.85)
0.0030 (1.70)*
0.0031 (0.95) R2 0.1973 0.6791 0.1960
F - 58.43**
-DW 0.7025 1.4532 0.5509 Hausman Test - - 0.0011
pv=(0.9739)
N 615
panel 3 (developing countries)
g (constant)
6463160000
(9.90)**
-6499150000 (3.79)**
α (credit) 0.0117
(0.32)
0.0088 (0.22)
0.0091 (0.63)
b (lagged GDP) 0.0233 (2.29)*
0.0123 (2.12)*
0.0135 (1.40) R2 0.0127 0.1892 0.0125
F - 10.755**
-DW 1.1634 1.4209 1.1391 Hausman Test - - 0.000
pv=(0.9934)
N 272
Source: World Economic Indicator (2001).
* and **, statistically significant at the 5 and 1 per cent level respectively.
10The F statistic is computed as F (n-1, nT-n-k)=[(R
u 2
-Rp 2
)/(1- Ru 2
Table 3 presents the results considering the entire country sample, panel 1, and
considering the developed and developing countries segmentation, panels 2 and 3
respectively. Considering the proxy variable of financial development to be credit (k1=1
and k2=0).
The results of the F-test performed indicate that the fixed effects model is more
appropriate than the pooled effects model. On the other hand, the Hausman test
indicates that the random effects model is preferable to the fixed effects model.
Therefore, one may notice that in the random effects model, the proxy for financial
development turns out to be statistically significant in explaining GDP only for the
developed countries panel, and statistically not important for the developing countries
sub-sample.
The non-significance of credit in explaining GDP growth in the developing countries is
probably not surprising given the fragile organisation of financial intermediaries in
those countries. Credit, though, is statistically significant for the entire country sample.
The differences in the estimated coefficient and in the tests performed, between the two
samples, are small. It seems therefore that considering the developing countries,
alongside with the developed countries sample, does not change considerably the
results. The overall results indicate that there is a direct relation between credit and
GDP growth.
Taking into account the division of countries according to the type of the respective
financial system, financial intermediaries dominance, financial markets dominance or
intermediate system, the corresponding estimates are reported in Table 4.
Again, credit turns out to be an appropriate explanatory variable for GDP growth.
Indeed, the credit coefficient is significant in all the three samples, regardless of the type
of dominant financial system. Interestingly, the coefficient estimated for stock market
based system countries is higher than the coefficient exhibited in bank-based and in
intermediate system countries (see the random model results, the one that seems
Table 4.Credit as a proxy for financial development: different financial systems (k1=1 and k2=0)
Pooled Effects Fixed Effects Random Effects panel 1 (bank-based systems)
g (constant)
10592200000
(9.32)**
-12234000000 (3.656)**
a (credit) 0.1213 (1.82)*
0.0692 (1.23)
0.0738 (5.88)**
b (lagged GDP) 0.0147 (1.76)*
0.0029 (1.02)
0.0039 (0.73) R2 0.1827 0.4191 0.1786
F - 1.4230
-DW 1.1493 17.363** 0.9513 Hausman Test - - 0.0072
pv=(0.9327)
N 365
panel 2 (stock-market based systems)
g (constant) 22737800000(5.53)** - 30733000000 (1.76)*
a (credit) 0.2732 (8.36)**
0.1771 (6.31)**
0.1823 (10.61)**
b (lagged GDP) 0.0053 (1.67)*
-0.0001 (-0.10)
0.0002 (0.04) R2 0.5885 0.7508 0.5868
F - 34.011**
-DW 1.3295 2.0036 1.0210 Hausman Test - - 0.0561
pv=(0.8127)
N 155
panel 3 (intermediate systems)
g (constant) 16250100000
(7.64)**
-15509100000 (1.50)
α (credit) 0.0392
(2.00)**
0.0318 (8.60)**
0.0319 (13.45)**
τ (lagged GDP) 0.0209
(1.14)
0.0026 (0.82)
0.0028 (0.67) R2 0.2057 0.7506 0.1936
F - 89.090**
-DW 0.5034 1.3789 0.4121 Hausman Test - - 0.0010
pv=(0.9746)
N 366
Source: World Economic Indicator (2001).
* and **, statistically significant at the 5 and 1 per cent level respectively.
4.2. Stock Market Impact on GDP
Tables 5 and 6 report the results using the same model as in the previous section.
However, now the proxy variable used for the financial system is stock market
capitalisation, in terms of the dummy variables in equation (1) this means setting up
now k1=0 and k2=1. In table 5, the full country sample is again divided into developed
the type of financial system that predominates in each country. As in the previous
sub-section, the random effects model seems to be overall the more appropriate for the
analysis of the influence of the proxy variable on GDP growth.
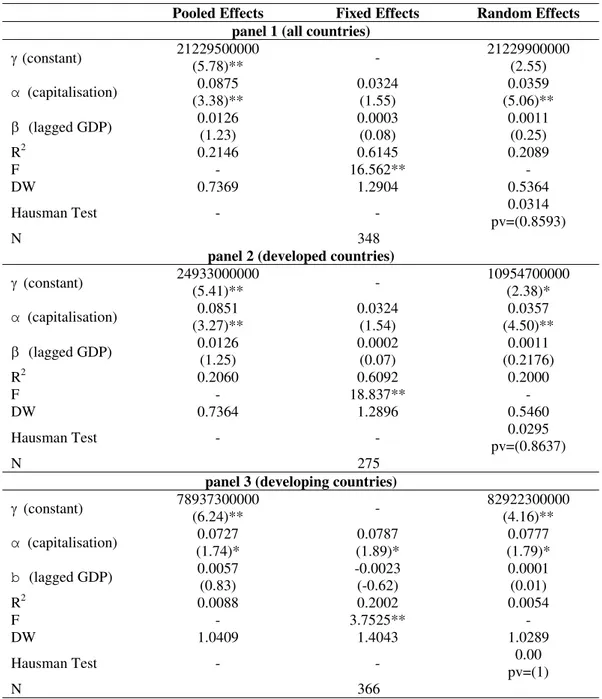
Table 5.Stock market capitalisation as proxy for financial development: developed and developing countries (k1=0 and k2=1)
Pooled Effects Fixed Effects Random Effects panel 1 (all countries)
g (constant)
21229500000
(5.78)**
-21229900000 (2.55)
α (capitalisation) 0.0875
(3.38)**
0.0324 (1.55)
0.0359 (5.06)**
b (lagged GDP) 0.0126 (1.23)
0.0003 (0.08)
0.0011 (0.25) R2 0.2146 0.6145 0.2089
F - 16.562**
-DW 0.7369 1.2904 0.5364 Hausman Test - - 0.0314
pv=(0.8593)
N 348
panel 2 (developed countries)
g (constant) 24933000000
(5.41)**
-10954700000 (2.38)*
α (capitalisation) 0.0851
(3.27)**
0.0324 (1.54)
0.0357 (4.50)**
b (lagged GDP) 0.0126 (1.25)
0.0002 (0.07)
0.0011 (0.2176) R2 0.2060 0.6092 0.2000
F - 18.837**
-DW 0.7364 1.2896 0.5460 Hausman Test - - 0.0295
pv=(0.8637)
N 275
panel 3 (developing countries)
g (constant) 78937300000
(6.24)**
-82922300000 (4.16)**
α (capitalisation) 0.0727
(1.74)*
0.0787 (1.89)*
0.0777 (1.79)*
b (lagged GDP) 0.0057
(0.83)
-0.0023 (-0.62)
0.0001 (0.01) R2 0.0088 0.2002 0.0054
F - 3.7525**
-DW 1.0409 1.4043 1.0289
Hausman Test - - 0.00
pv=(1)
N 366
Source: World Economic Indicator (2001).
* and **, statistically significant at the 5 and 1 per cent level respectively.
The results of table 5 suggest a positive and statistically significant effect of
stock-market capitalisation on GDP growth, for developed and developing countries. One
for developing countries than for the developed countries. This can be understood as
evidence of the fact that developing countries are, in terms of financial development, in
a previous level of development, with the banking sector providing most of the
financing to the economy.
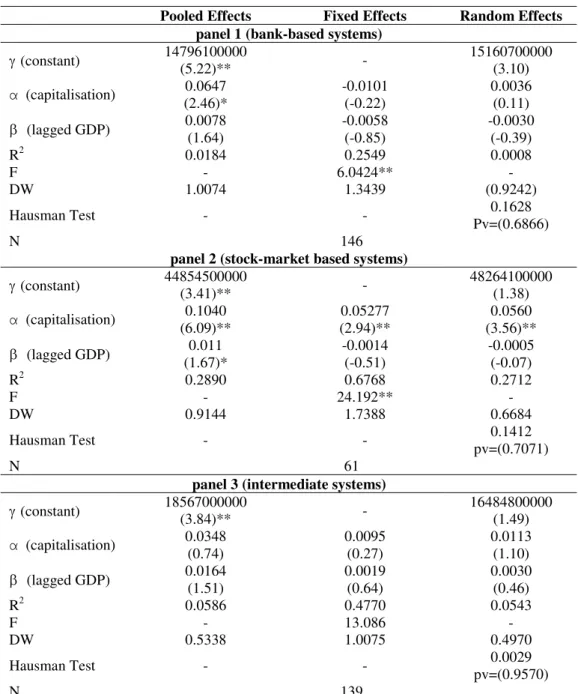
Table 6. Stock market capitalisation as a proxy for financial development: different financial systems (k1=0 and k2=1)
Pooled Effects Fixed Effects Random Effects panel 1 (bank-based systems)
g (constant)
14796100000
(5.22)**
-15160700000 (3.10)
α (capitalisation) 0.0647
(2.46)*
-0.0101 (-0.22)
0.0036 (0.11)
b (lagged GDP) 0.0078 (1.64)
-0.0058 (-0.85)
-0.0030 (-0.39) R2 0.0184 0.2549 0.0008
F - 6.0424**
-DW 1.0074 1.3439 (0.9242) Hausman Test - - 0.1628
Pv=(0.6866)
N 146
panel 2 (stock-market based systems)
g (constant)
44854500000
(3.41)**
-48264100000 (1.38)
α (capitalisation) 0.1040
(6.09)**
0.05277 (2.94)**
0.0560 (3.56)**
b (lagged GDP) 0.011 (1.67)*
-0.0014 (-0.51)
-0.0005 (-0.07) R2 0.2890 0.6768 0.2712
F - 24.192**
-DW 0.9144 1.7388 0.6684 Hausman Test - - 0.1412
pv=(0.7071)
N 61
panel 3 (intermediate systems)
g (constant)
18567000000
(3.84)**
-16484800000 (1.49)
α (capitalisation) 0.0348
(0.74)
0.0095 (0.27)
0.0113 (1.10)
b (lagged GDP) 0.0164 (1.51)
0.0019 (0.64)
0.0030 (0.46) R2 0.0586 0.4770 0.0543
F - 13.086
-DW 0.5338 1.0075 0.4970 Hausman Test - - 0.0029
pv=(0.9570)
N 139
Source: World Economic Indicator (2001).
* and **, statistically significant at the 5 and 1 per cent level respectively.
When the countries are divided according to the dominant financial system,
with GDP growth in countries where financial markets prevail as a source of funds (see
panel 2 in Table 6). This result holds true for all the versions estimated, pooled, fixed
and random effects.
Therefore, contrarily to the results obtained when credit was the proxy variable, stock
market capitalisation is indeed only important for countries where the financial markets
are dominant. For the bank-based systems and for the intermediate systems,
stock-market capitalisation seems to play a quite more mitigated role in explaining GDP
growth since the estimated coefficients are virtually zero.
4.3. Credit and Stock Market Capitalisation Impact on GDP Growth
In this section, equation (1) is amended because we now want to use both stock market
capitalisation and credit as explanatory variables of GDP, and we then have
it it it it
i
it X Z Y u
Y = + D + D + +
D g a1 a2 b -1 . (2)
The estimation results are presented in Table 7, with the country sample segmented
between developed and developing countries, and in Table 8, dividing the countries
according to the dominant financial system.
When we analyse the effect of both variables, used as proxy for the financial system
development, on GDP growth, we find that, for the set of developing countries, only
credit seems to be statistically significant (see panel 3 in Table 7). For the case of the
developed countries, both credit and stock market capitalization have a positive
influence on GDP growth. These results are in line with the conclusions already
Table 7. Credit and stock market capitalisation: developed and developing countries
Pooled Effects Fixed Effects Random Effects panel 1 (all countries)
g (constant)
21510900000
(6.27)
-20837000000 (2.54)*
α1 (credit)
0.0408 (1.66)* 0.0345 (4.29)** 0.0348 (8.87)**
a2 (stock market)
0.0660 (2.50)* 0.0160 (0.88) 0.0188 (2.75)**
b (lagged GDP) 0.0126 (1.32)
0.0010) (0.30)
0.0017 (0.42) R2 0.3161 0.6893 0.2745
F - 18.074**
-DW 0.8646 1.4885 0.5659 Hausman Test - - 0.0410
pv=(0.9797)
N 331
panel 2 (developed countries)
g (constant)
25552300000
(5.86)**
-25548200000 (2.35)*
α1 (credit)
0.0407 (1.69)* 0.0345 (4.30)** 0.0348 (7.90)**
a2 (stock market)
0.0637 (2.42)* 0.0159 (0.87) 0.0186 (2.42)*
b (lagged GDP) 0.0125 (1.36)
0.0009 (0.28)
0.0017 (0.36) R2 0.3096 0.6846 0.26998
F - 19.876**
-DW 0.8656 1.4905 0.57844 Hausman Test - - 0.040190
(0.9801)
N 258
panel 3 (developing countries)
g (constant)
7167040000
(5.24)**
-7567300000 (3.66)**
α1 (credit)
0.1407 (1.59) 0.1616 (1.66) 0.1550 (2.44)*
a2 (stock market) 0.0499 (1.40)
0.0529 (1.93)*
0.0533 (1.24)
b (lagged GDP) 0.0043 (0.75)
-0.0054 (-1.78)*
-0.0028 (-0.27) R2 0.05019 0.2626 0.04512
F - 4.2654**
-DW 0.9617 1.33399 0.9375 Hausman Test - - 0.0079
pv=(0.9290)
N 366
Source: World Economic Indicator (2001).
* and **, statistically significant at the 5 and 1 per cent level respectively.
Using the segmentation of countries according to the dominant financial system, one
can see that credit is relevant in explaining GDP, for the countries with bank-based
systems (Table 8, panel 1). Also for this country sub-sample, stock-market
systems, the number of observations is rather small (Table 8, panel 2), hampering
therefore the possibility of getting any meaningful relation between the stock-market
proxy and GDP growth. Nevertheless, credit still shows up as relevant in explaining
GDP. Concerning the intermediate systems sub-sample, again only credit is important to
establish the finance-growth nexus.
Table 8. Credit and stock market capitalisation: different financial systems Pooled Effects Fixed Effects Random Effects
Panel 1 (bank-based systems)
g (constant)
10928900000
(4.52)**
-11848700000 (3.29)**
α1 (credit)
0.2219 (1.72)* 0.1717 (1.35) 0.1919 (6.32)**
a2 (stock market) -0.0258 (-0.32)
-0.0922 (-1.12)
-0.0683 (-1.57)
b (lagged GDP) -0.0028 (-0.26)
-0.0108 (-.89)
-0.0076 (-1.06) R2 0.2955 0.3891 0.2839
F - 3.2308**
-DW 0.9728 1.1294 0.8968 Hausman Test - - 2.2587
pv=(0.5205)
N 135
panel 2 (stock market based systems)
g (constant)
30392500000 (3.56)**
36066100000 (1.99)**
α1 (credit)
0.357348 (6.71)** 0.2217 (2.82)** 0.2533 (5.67)**
a2 (stock market)
-0.0796 (-2.42)** -0.0439 (-1.25) -0.0522 (-2.17)**
b (lagged GDP) 0.0081 (1.39)
0.0010 (0.47)
0.00278 (0.46) R2 0.6770 0.7674 0.6743
F - 8.3839**
-DW 1.6900 2.1981 1.2809 Hausman Test - - 0.3836
pv=(0.8255)
N 61
panel 3 (intermediate systems)
g (constant)
19317500000
(4.51)**
-16546900000 (1.45)
α1 (credit)
0.0301 (2.24)** 0.0311 (8.48)** 0.0311 (9.68)**
a2 (stock market)
0.0185 (0.45) -0.0077 (-0.30) -0.0067 (-0.82)
b (lagged GDP) 0.0156(1.54) 0.0008(0.32) 0.0014(0.28) R2 0.2555 0.7024 0.2117
F - 22.529**
-DW 0.5208 1.2669 0.44078 Hausman Test - - 0.0024
pv=(0.9988)
N 133
Source: World Economic Indicator (2001).
One can naturally point some caveats concerning the analysis based on the division of
countries according to the predominant financial intermediaries in a given country.
Indeed, financial intermediaries also play an important role in the financial markets
either as buyers of negotiable securities or as issuers of those same securities. This sort
of activity is pursued side by side with the function of providing indirect financing to
the economy, if we want to use the terminology of Gurley and Shaw)
5. Conclusion and Summary
This paper examined how the finance-growth nexus is affected by the so-called
“predominant” financial system in a given country. For that purpose we used a panel
data approach for a sample consisting of 24 countries throughout the 70s, 80s and 90s.
As proxy for the bank-based “dominant” financial systems we used credit to the
economy. As proxy for the stock market “dominant” financial systems we selected
stock market capitalisation.
The results show that the credit variable is always significant in explaining GDP,
regardless of the type of dominant financial system. When the countries are divided
according to the “dominant” financial system, stock-market capitalisation also has an
unequivocally positive and statistically significant relation with GDP growth in
countries where financial markets prevail as a source for financing the economy. For the
case of the developed countries both credit and stock market capitalization have a
positive influence on GDP growth. However, for the set of developing countries, only
credit seems to be statistically significant. The paper’s findings are consistent with some
of the results provided by previous empirical research with a similar study focus.
References
Allen, F. and Gale, D. (1995). “A welfare comparison of intermediaries and financial markets in Germany and the US,” European Economic Review, 39 (2), 179-209.
Allen, F. and Gale, D. (2000). Comparing Financial Systems, MIT Press.
Bassanini, A.; Scarpetta, S. Hemmings, P. (2001). “Economic Growth: the role of policies and institutions; Panel data evidence from OECD countries,” OECD Economics Department WP 283.
Carlin, W. and Mayer, C. (1999). “How do financial systems affect economic performance,” Oxford Financial Research Centre WP 1999-FE-08.
Carlin, W. and Mayer, C. (2002). “Finance, investment and growth,” Oxford Financial Research Centre WP 1999-FE-09.
Demirgüç-Kunt, A. and Levine, R. (1999). “Bank-based and market-based financial systems: cross-country comparisons,” Working Paper 2143, World Bank.
Dewatripont, M. and Maskin, E. (1995). “Credit efficiency in centralized and decentralized economies,” Review of Economic Studies, 62 (4), 541-555.
ECB (2002). Report on Financial Structures, European Central Bank,
Franks, J. and Mayer, C. (1998). “Ownership and Control in Europe,” in Newman, P. (ed.), The new Palgrave Dictionary of Economics and the Law, Palgrave Publishers Ltd.
Fulghieri, P. and Rovelli, R. (1998). “Capital markets, financial intermediaries, and liquidity supply,” Journal of Banking and Finance, 22 (9), 1157-1179.
Gershenkron, A. (1962). Economic backwardness in historical perspective, Cambridge, Harvard University Press.
Goldsmith, R. (1969). Financial structure and development, Yale University Press.
Greene, W. (1997). Econometric Analysis, 3rd ed., Prentice Hall.
Greenwood, J. and Janovic, B. (1990). “Financial Development, Growth and the Distribution of Income,” Journal of Political Economy, 98 (5, Part 1), 1076-1107.
Hisao, C. (2002). Analysis of Panel Data, 2nd ed., Cambridge University Press.
Huang, H.; Xu, C. (1999). “Institutions, Innovations and Growth,” American Economic
Review, 89 (2), 438-433.
Jansen, M. and Murphy, K. (1990). “Performance Pay and Top Management Incentives,” Journal of Political Economy, 98 (2), 225-264.
Johansen, S. (1991). “Estimation and Hypothesis Testing of Cointegration Vectors in Gaussian Vector Autoregressive Models,” Econometrica, 59, 1551-1580.
King, R. and Levine, R. (1993). “Financial Intermediation and Financial Development in Mayer, C. and Vives, X. (eds.) Financial Intermediation and the Construction of
Europe, Centre for Economic Policy Research.
La Porta, R.; Lopez-de-Silanes, F.; Shleifer, A. and Vishny, R. (1998). “Law and Finance,” Journal of Political Economy, 106 (6), 1113-1155.
Leahy, M.; Schich, S.; Wehinger, G.; Pelgrin, F. and Thorgeirsson, T. (2001). “Contributions of Financial Systems to Growth in OECD Countries,” OECD Economics Department WP 280.
Levine, R. (1997). “Financial Development and Economic Growth: Views and Agenda,” Journal of Economic Literature, 35 (3), 688-726.
Levine, R. (1999). “Bank-Based and Market-Based Financial Systems: Cross-Country Comparisons ,” World Bank Working Paper 2143.
Levine, R. and Zervos, S. (1998). “Stock Markets, Banks and Economic Growth,”
American Economic Review, 88 (3), 537-558.
Levine, R.; Loayza, N. and Beck, T. (2000). “Financial Intermediation and Growth: Causality and Causes,” Journal of Monetary Economics, 46 (1), 31-77.
Qi, J. (1994). “Bank Liquidity and Stability in an Overlapping-generations Model,”
Review of Financial Studies, 7 (2), 389-417.
Rousseau, P. and Sylla, R. (2001). “Financial Systems, Economic Growth, and Globalisation,”Working Paper 8323 NBER.
Rousseau, P. and Wachtel, P. (1998). “Financial Intermediation and Economic Performance: Historical Evidence from Five Industrialized Countries,” Journal of
Money, Credit, and Banking, 30 (4), 657-678.
Rousseau, P. and Wachtel, P. (2002). “Inflation thresholds and the finance–growth nexus,” Journal of International Money and Finance, 21 (6), 777-793.
Shan, J.; Morris, A. and Sun, F. (2001). “Financial development and economic growth: an egg and chicken problem?” Review of International Economics 9 (3), 443-454.
Sharpe, S. (1990). “Asymmetric Information, Bank Lending, and Implicit Contracts: a Stylized Model of Customer Relationships,” Journal of Finance, 45 (4), 1069-1087.
Sirri, E. and Tufano, P. (1995). “The Economics of Pooling,” in Crane, D. et al., (ed.)
The Global Financial System: A Functional Perspective, Harvard Business School
Press: Cambridge.
Stiglitz, J. (1985). “Credit Markets and the Control of Capital,” Journal of Money,
Stulz, R. (2000). “Does Financial Structure Matter for Economic Growth? A Corporate Finance Perspective,” mimeo, conference paper, Financial Structure and Economic Development Conference, February 10-11, 2000, World Bank, Washington, D.C.
Thiel, M. (2001). “Finance and Economic Growth - a Review of Theory and the Available Evidence'', Economic Papers 158, European Commission.
Tsuru, K. (2000). “Finance and Growth: Some Theoretical Considerations, and a Review of the Empirical Literature,” OECD Economics Department WP 228.
Annex – Data sources
Data Period Source
GDP (constant 1995 USD)
- From 1970 to 1999 for Germany and from 1960 to 1999 for the rest of the countries.
World Bank, World Development Indicators, 2001
Credit to the Private Sector (Constant 1995 USD)
- From 1960 to 1999 except for some of the developed countries.
- 1970-1998 in the case of Austria, Belgium, France and Netherlands.
- 1960-1998 for Finland, Ireland, Portugal and Spain 1960-1998.
- Italy 1963-1998, Luxembourg 1977-1997 and Germany 1970-1998.
World Bank, World Development Indicators, 2001. Data for Germany from 1970 to 1990 inclusive base on IMF. Data for West Germany:
International Financial Statistics Yearbook, 1998, 1999, 2000.
Stock Market Capitalizatio n (Constant 1995 USD)
- From 1980 to 1999 according to the availability of data for each of the countries.
- 1980-1999 inclusive in the case of Austria, Belgium, Denmark, France, Germany, Ireland, Italy, Japan, Netherlands, United Kingdom, United States. - Sweden (1982-1999).
- Malaysia (1986-1999).
- Philippines, Spain and Thailand (1987-1999).
- Argentina, Greece, Finland and Mexico (1988-1999). - India and Portugal (1990-1999).
- Luxembourg (1992-1999). - Brasil (1994-1999).