Project
Master
’s Degree of Mechanical Engineering – Industrial Production
Application of LEAN methodology to support projects
improvements in a die casting industry
Liliana Marina Ferreira de Sousa
Application of LEAN methodology to support projects
improvements in a die casting industry
Liliana Marina Ferreira de Sousa
Project of Master’s Degree performed by orientation of Doctor Irene Sofia Carvalho Ferreira, Professor of Superior School of Technology and Management of Institute Polytechnic of Leiria in
Portugal and Doctor Rainer Schillig, Professor of the University of Aalen in Germany.
“
It is not the strongest nor the most
intelligent of the species that survives, but
the one that is most adaptable to change.”
Acknowledgments
To Mr. Herbert Nowak, who provide me the opportunity to realize an internship on the company Schüle Druckguss in Germany, and supported me every day, motivating and giving me knowledge and tools to realize this project.
To the workers of the company Schüle Druckguss that made possible this study by giving all the data that I needed, in special to my colleague Evgen Welsch, with whom I shared challenges during this project and supported me with the German language.
To Doctor Professor Joel Vasco, from Superior School of Technology and Management of Leiria, coordinator of the Master’s Degree of Mechanical Engineer – Industrial Production, who was always available to supporting me in everything.
To Doctor Rainer Schillig, from Aalen University in Germany, who orientated me on these six months, received me so well and provided me knowledge and expertise.
To Doctor Irene Sofia Carvalho Ferreira, from Superior School of Technology and Management of Leiria, who was always available, especially in the last moments of this project, to supporting and motivating me.
To my parents that are always here for me and provide me this academic pathway transmitting me straight to fight for achieve goals.
To my friends and academic colleges, with whom I grew up together and shared bad and good moments.
To my boyfriend, Donato, that was always with me on this last academic year and followed this project, advising me and supporting me in the difficult moments.
Abstract
The main goal of this project is to define waste, measure and eliminate it, inherent to the production of aluminium die casting parts on the company Schüle Druckguss in Germany. In order to eliminate waste, a set of improvement projects were carried out focusing on the production in the different halls of the company. For that purpose, Lean thinking and tools were used as supporting methodology. It is important to highlight that these projects include issues like the organization of the workplace, the optimization of the workload for the worker, programing transport routes and minimize inventory of raw material and finish goods.
Towards to achieve the previous goals, it was necessary to observe operations and procedures, measure time, detect bottlenecks or critical tasks and test different scenarios, aiming to reduce the most wasteful activities. Referring to the workplace organization, the solution achieved consists on the application of a colored marking system on the floor to define the transport way and the place for the material.
Regarding the workload of the worker, it was optimized given the worker, in the new procedure, more tasks, mostly due to the introduction of automation of controlling process. About the routes for the truck coming from the daughter company in Slovakia, it was changed and some wasteful activities reduced, obtaining a minimization of 15% of the time spent on these activities per day. Note that human and material resources were also saved with the new proposal.
Furthermore, the necessary quantity of inventory referent to one product was calculated the economic quantity order and minimized costs in 34%. For the finish goods it was proposed a new layout for the boxes, in order to be transported more quantities, according with customers ‘demand. Finally, it was studied a product and its variations, that is die casted on the daughter company in Slovakia and machined in Germany, in order to change its production to a continuous line in Germany. Thus, it was included on the Die Casting Island (DCI), three external processes, minimizing the time in transportation and using fewer workers than the actual situation.
Resumo
O principal objectivo deste projeto é definir desperdícios, medir e eliminá-los, de acordo com a produção de peças de alumínio fundidas na empresa Schüle Druckguss, na Alemanha. No âmbito de eliminar desperdícios, um conjunto de projetos de melhoria foram realizados com foco na produção nos diferentes pavilhões da empresa. Neste sentido, o pensamento e ferramentas Lean foram usadas como metodologia de suporte. É importante salientar que estes projectos incluem temáticas como a organização do espaço de trabalho, optimização da carga laboral para o trabalhador, programação da rota nos transportes e minimização do inventário de matéria-prima e produto acabado.
No sentido de alcançar os objetivos propostos, foi necessário observar operações e procedimentos, fazer medições de tempo, detectar alvos ou tarefas criticas e testar diferentes cenários, de forma a reduzir as atividades responsáveis pela maioria do desperdício. Relativamente á organização do espaço de trabalho, a solução encontrada corresponde á aplicação de marcas no chão para definir a zona de transporte e o local destinado ao material.
Relativamente á carga laboral do trabalhador, foi optimizada atribuindo ao trabalhador, num novo procedimento, mais tarefas, maioritariamente devido á implementação de um processo automático de controlo da peça. Em relação á rota do camião que transporta o material da Eslováquia para a Alemanha, foi alterada e algumas actividades que geram desperdício reduzidas, obtendo uma diminuição de 15% do tempo de actividades do camião por dia. É de salientar que os recursos humanos e materiais foram também reduzidos, considerando a implementação da melhoria.
No que se refere á quantidade de inventário necessária para um produto, foi calculada a quantidade económica de encomenda e diminuídos os custos em 34%. Para o produto acabado foi sugerido um formato de caixa para que pudesse ser transportada mais quantidade, de acordo com a procura do cliente. Finalmente, foi estudado um produto e as suas variantes, que são fundidos na empresa filial na Eslováquia e maquinados na Alemanha, pretendendo alterar a sua produção para uma linha contínua na Alemanha. Assim, foram incluídas na ilha de fundição três processos externos, diminuindo tempos de transporte e seriam necessários menos trabalhadores, em relação á situação actual.
Übersicht
Das Hauptziel dieses Projektes ist es Verschwendung, bei der internen Produktion von Aluminium-Druckgussteilen beim Unternehmen Schüle Druckguss in Deutschland zu definieren, sie zu messen und zu eliminieren. Um Verschwendung zu beseitigen wurde eine Reihe Optimierungsprojekte durchgeführt, die den Fokus auf die Produktion in den verschiedenen Hallen legen. Für diesen Zweck wurden der “Lean“ Gedanke und seine Werkzeuge als Methoden verwendet. Wichtig ist hinzuzufügen dass, diese Projekte einschließlich Themen, wie Organisation des Arbeitsplatzes, Optimierung der Arbeitsschritte des Mitarbeiters, Entwurf der Transportwege und Reduzierung der Bestände für Roh- und Fertigteile umfassen.
Um, die obengenannten Ziele zu erreichen, war es notwendig Abläufe zu beobachten, die Zeiten aufnehmen, kritische Prozesse bzw. Bottlenecks zu finden, verschiedene Optimierungsszenarien zu testen mit dem Ziel Aktivitäten mit Verschwendung zu beseitigen. Bezüglich der Arbeitsplatzorganisation, beruht die Lösung in Anwendung eines Farbmarkierungssystems, um die Transportwege und Stellflächen für das Material zu definieren.
Angesichts der Optimierung der Auslastung des Maschinenbedieners ist dieser nun in der Lage, durch Verschiebung der visuellen Prüfung in die automatisierte Fertigungszelle, flexibler in der Bedienung mehrerer Fertigungszellen zu sein. Bezüglich des neuen Fahrroute des LKWs vom Tochterunternehmen Schüle Slovakia konnten nicht – werthaltige Aktivitäten gesenkt werden und somit eine Zeiteinsparung von 15% erreicht werden. Zusätzlich konnte Arbeitsaufwand und Ressourcen eingespart werden.
Außerdem wurde die optimale Höhe der Bestände eines Produkttyps berechnet und diese ergaben eine Kostenreduzierung von 34%. Schließlich ergab die Untersuchung bestimmter Produkttypen, die in der Slowakei gegossen und in Deutschland bearbeitet werden, an einem Ort zu einem geschlossenen Prozess zu verbinden. Somit wurde auf der Druckguss Island, drei externe Prozesse, die Minimierung der Zeit im Transport und Verwendung von weniger Arbeitskräfte als die tatsächliche Situation enthalten.
Index of Figures
Figure 1 - House of Toyota Production System (Systems2win, 2003). ... 5
Figure 2 - Innovation deployment over the time, with and without Kaizen (Gumelar, 2013). ... 6
Figure 3 - Three M’s for wasteful activities, according to Lean methodology (Liker, 2004). ... 7
Figure 4 - The eight wastes (Harry, et al., 2010). ... 9
Figure 5 - Conventional production and one-piece-flow production (ALD Vacuum Technologies, 2010). ... 10
Figure 6 - Example of application of a Signal Kanban (triangle) and a Withdrawal Kanban (card) (Shook, et al., 2014). ... 11
Figure 7 – First-In-First-Out principle (Shook, et al., 2003). ... 12
Figure 8 - PDCA or Deming cycle to achieve improvement along the time (Management, 2009). ... 13
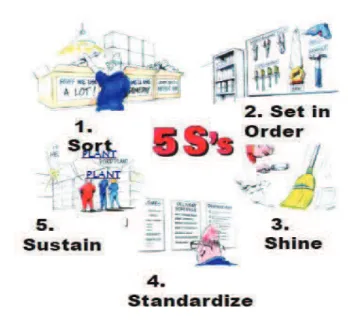
Figure 9 - 5S’s Principle (Quality foundation, 2008). ... 15
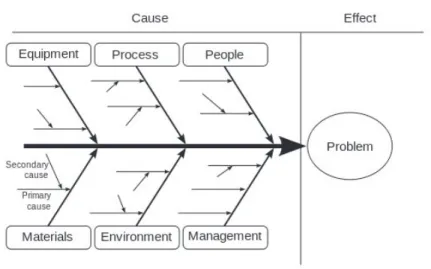
Figure 10 - Fishbone diagram (Comindwork, 2014). ... 16
Figure 11 - Pareto Chart (Wallace, et al., 2007). ... 16
Figure 12 - Andon System (Velaction, 2009). ... 17
Figure 13 - Poka-Yoke System (David Straker, 2002). ... 18
Figure 14 - Value Stream Mapping Symbols (QualityTrainingPortal, 2004). ... 19
Figure 15 - Value Stream Mapping example (ConceptDraw, 2013). ... 20
Figure 16 - Logo of the company. ... 22
Figure 17 – Hierarchy in Schenk Hall. ... 23
Figure 18 – Products manufactured in Schenk Hall. ... 23
Figure 19 – Product “Topf”. ... 24
Figure 20 – Gearbox Cover PL 7. ... 26
Figure 21 – Container with the recycled material, identified with number and color of aluminium alloy. ... 27
xii
Figure 28 - Material flow of the product Housing CP 14. ... 34
Figure 29 – Value Stream Mapping of Housing CP14 of Schüle in Germany... 35
Figure 30- Pareto analysis of the time for operators’ workload on “Housing CP14”... 38
Figure 31 - Cycle time of the product Housing CP14, referent to the machining. ... 39
Figure 32 - Workload for the Logistic Worker in both shifts. ... 42
Figure 33- Operators’ transport times per day, including all the products. ... 43
Figure 34 - Layout for the area to place the pallets, near the assembly line. ... 44
Figure 35 – Time for transport of material made by operator and logistic worker in a future situation. ... 45
Figure 36 - Schenk Hall organization before improvements. ... 46
Figure 37 – Layout of Schenk Hall with a floor marking system. ... 47
Figure 38 - Floor marks to place grid boxes, on the left side, and small load carriers, on the right side. ... 47
Figure 39 - Yellow marks on the floor for the transport way. ... 48
Figure 40 - Blue marks on the floor to bound pallets area before packing (left) and after (right). ... 48
Figure 41 – Scheme representing two options for place the pallets in GM Delta production line. ... 49
Figure 42 – Marking system for the Small Load Carrier on GM Delta production line. ... 50
Figure 43 – Workplace of the logistic worker. ... 51
Figure 44 – Place for the tools of the logistic worker. ... 51
Figure 45 – Layout for the room of the logistic worker. ... 52
Figure 46 – Product “Topf” stored on the Large Load Carrier. ... 55
Figure 48 – New prototype of the inlay for the product “Topf”. ... 57
Figure 49 - Improved inlay, on the left and actual inlay, on the right. ... 57
Figure 50 - Fishbone Diagram to represent the poor logistic organization. ... 60
Figure 51 - Part of the plant of main hall where the trucks (un)load. ... 61
Figure 52 – Pager. (Pas14) ... 61
Figure 53 – Time for load and unload each truck on the halls. ... 62
Figure 54 – Percentage of activities of the truck from Schüle Slovakia, in each hall. ... 63
Figure 55 – Percentage of time used for the step “sort pallets”. ... 64
Figure 56 – Color system to mark the grid boxes with the raw parts. ... 64
Figure 57 – Actual route of the truck from Schüle Slovakia. ... 65
Figure 58 – New route for truck from Schüle Slovakia. ... 65
Figure 59 – Organization of the boxes inside the truck. ... 66
Figure 60 - Value Stream Mapping of the Gearbox PL7 in Schüle Slovakia... 71
Figure 61 - Value Stream Mapping of the Gearbox PL7 in Schüle Germany. ... 72
Figure 62 – External Value Stream Mapping of the Gearbox PL7. ... 73
Figure 63 – Value Stream Mapping with the symbiosis of processes, without making any improvement. ... 75
Figure 64 - Takt Time of the processes included inside of the Die-Casting Island. ... 76
Figure 65 - Procedure for all manufacturing process of Gearbox PL7 with the improved situation. ... 77
Index of Tables
Table 1 – Time measurement of “Housing CP14” for the tasks of one operator in one production line. ... 37 Table 2 – Average of steps’ measurement for the control task made by the operator. ... 39 Table 3 – Time saved with the automatized control for the product Housing CP 14. ... 40 Table 4 – Actual scenario, with a manual control, for the products: Housing CP 14 and GM Delta. ... 41 Table 5 – Future scenario, with an automatized control, for the products: Housing CP 14 and GM Delta. ... 41 Table 6 – Pallets’ transport, before and after the improvement... 45 Table 7 – Analysis of the time necessary for the tasks 1 and 2/3, considering Option A and Option B. ... 50 Table 8 - Information about storage of raw aluminium. ... 53 Table 9 – Result of the costs saved with the inventory improvement. ... 54 Table 10 – Delivered amount per week of the product “Topf” in the actual and improved
scenario. ... 58 Table 11 – Delivery to the customer per week, considering the improved situation. ... 59 Table 12 – Result of the time saved with the improvements. ... 66 Table 13 - Measurement of the workload for the operator, per product, considering 1 production line. ... 68 Table 14– Result of the calculation of total workload per operator for five Production lines. ... 69 Table 15 - Percentage of operator’s tasks on the processes that will be automatized. ... 77 Table 16 - Result of the time saved with the new improvement. ... 78
List of Acronyms
CT – Cycle Time D – Demand
DCI –Die Casting Island DCM – Die Casting Machine EOQ – Economic Order Quantity FIFO – First In, First Out
FG – Finish Goods FW – Foundry Worker GB – Grid Boxes HC – Handling Costs JIT – Just In Time
LLC – Large Load Carrier LT – Lead Time
LW – Logistic Worker
MGL – Machine Group Leader NVA – Non-Value Added
O – Operator PDCA – Plan-Do-Check-Act PL – Production Line PM – Process Manager PT – Process Time QCD – Quality-Cost-Delivery RA – Raw Aluminum RM – Recycled Material RC – Reorder Costs RP – Raw Part SDG – Schüle Druckguss GmH SP – Storage Place SSK – Schüle Slovakia SLC – Small Load Carrier
xviii
USA – United States of America VA – Value Added
VSM – Value Stream Mapping WH – Warehouse
Index
ACKNOWLEDGMENTS ... III ABSTRACT ... V RESUMO ... VII ÜBERSICHT ... IX INDEX OF FIGURES ... XI INDEX OF TABLES ... XV LIST OF ACRONYMS ... XVII INDEX ... XIX1. INTRODUCTION ... 1
1.1 FRAMEWORK AND GOALS ... 1
1.2 CONTENTS OF THE STUDY ... 2
2. STATE OF THE ART ... 3
2.1 THEORETICAL APPROACH ... 3
2.2 LEAN PHILOSOPHY ... 4
2.3 DEFINITION OF WASTE... 7
2.4 LEAN TOOLS ... 9
2.4.1 ONE- PIECE-FLOW PRINCIPLE ... 10
2.4.2 PULL SYSTEMS ... 11
2.4.3 PDCA CYCLE AND STANDARDS ... 12
2.4.4 5S PRINCIPLE ... 13
2.4.5 PROBLEM SOLVING SYSTEMS ... 15
2.4.5.1 DEFINE ROOT CAUSES ... 15
2.4.5.2 DATA ANALYSIS ... 16
2.4.5.3 MISTAKE-PROOF SYSTEMS ... 17
2.4.6 VALUE STREAM ANALYSIS ... 18
3. CASE OF STUDY ... 21
3.1. THE COMPANY ... 21
3.2. PRESENTATION OF THE PROBLEMATIC ... 22
4.1. SCHENK HALL... 33
4.2.2. FINISH GOODS ... 55
4.3.1 LOGISTIC TRANSPORT FOR THE TRUCK FROM SLOVAKIA ... 62
4.4.1. TIME ANALYSIS ... 67
4.4.2. VALUE STREAM ANALYSIS ... 69
1.
Introduction
1.1 Framework and goals
“The most important factors for success are patience, a focus on long-term rather than short-term results, reinvestment in people, product, and plant, and an unforgiving commitment to quality.” – Robert B. McCurry, former Executive V.P., Toyota Motor Sales (Liker, 2004).
The excerpt aforementioned refers to the first of fourteen principles that make “The Toyota Way”, an ideology that have been capture the attention of organizations. The concept Toyota Production System (TPS) was born in Japan in 1940 as a philosophy established by Taiichi Ohno, the second President of Toyota Motor Corporation. This philosophy is based on tools, technics and continuous improvement, with the golden rule of eliminating waste (Liker, 2004) (Toyota).
Companies are seeking for a competitive advantage through its competitors. The market is thorough of offers and the goal is to achieve the best practices to provide exactly what the customer wants: the best product quality in the right time and amount, with the lower price.
Schüle Druckguss GmbH (SDG) is a provider of pre-finished die casted parts for automotive industry, pneumatic systems and gas heating markets. The company is continuously improving its performance focused on providing the best solutions for the customer and cost efficient production.
The definition of waste is based on the activities which create value or do not create value for the customer. Therefore, the focus is on reducing and eliminating these non-value added activities, responsible for high lead times, leading to a successful organization.
Throughout the present study, the main goal is to eliminate waste inherent to the production, upgrade the workload for the workers, improve the material flow and optimize the amount of inventory. Furthermore, the logistic of transports will be mentioned, including truck organization and routes. Besides, there are studied the possibilities of change one production that is divided by transport and inventory, in a continuous line procedure.
2
1.2 Contents of the study
Chapter one introduces the purpose of this project, as well as the main goals and methodology applied. On chapter two can be found the state of the art relative to Lean production and described its tools that will be used along this project. The case of study will be presented on chapter three, including the definition of the problematic on the distinct topics of this project.
Furthermore, on chapter four, there are represented the projects improvements and the tools of Lean methodology applied on the course to achieve results. Considering the results, the forecasts are expressed, in order to obtain profits.
Finally, on chapter five is represented a brief conclusion of the results obtained on the previous chapter as well as suggestion for future projects to be implemented on the company.
2.
State of the art
Currently, the competitiveness between organizations is high, as well as the manufacturing exigencies imposed by their customers. Therefore, in order to meet customers’ requirements, companies seek for high quality products, with low cost resources and efficiently procedures.
Lean philosophy intents to achieve the best practices into the organization, as improving workplaces, methodologies and implementing systems in order to support the worker and continuous improvement of internal operations. Hereby, the number of organizations that use Lean methodology is increasing over the time, registering in Europe an adherence higher than 50% in 2008 (ACE, 2008).
2.1 Theoretical Approach
In 1891, the Japanese Sakichi Toyoda invented a wood handloom and improved it for some years, achieving the creation of an automatic power loom (Toyota, 2002). Furthermore his invention had a system that stopped the power loom whether there was an error. This system is known as Jidoka, the Japanese term that means “building in quality”. Throughout his creation he founded a textile company named Toyoda Automatic Loom Works. Afterwards emerged an interest on automobile industry, and he and his son, Kiichiro Toyoda, went in United States of America (USA) to study Fords’ production (Liker, 2004).
In USA, Henry Ford was pioneer of the “flow production”, making a sequence of processes with an assembly line in the end of the production, which later was called mass production (Institute, 2009). Subsequently to the World War I, this manufacturer system controlled the automobile industry, by producing big and standardized batches of products (Womack, et al., 1990).
Following the technologic growing, Kiichiro Toyoda sold the patent of the power looms and invested on the foundation of Toyota Motor Corporation, in 1930. Within the feedback from USA, he realized that on the supermarkets there was used a reposition system according with customer’s purchase. Therefore he created the
Just-in-4
high quality showed up (Liker, 2004).
Taiicho Ohno was qualified as assessment chief of Toyota, creating the Toyota Production System (TPS), a philosophy based on two pillars abovementioned: Jidoka and JIT. In contrast with Fords’ manufacturing system, where it was normal to repair defective products, Ohnos’ rules consisted on immobilizing the production and finding the origin of the problem. Introducing this technique to the manufacturing system, it was noticed the reduction of failures and the company was worldwide considered as the one with less car defects (Womack, et al., 1990).
Toyota was known as the best worldwide automobile seller and it becomes a philosophy used by several companies around the world, not just in manufacturing but also in logistic and other areas (Institute, 2009). In fact, it has been recognized that TPS is a cheap way to improve business, with a creative mind and a focus on waste elimination.
2.2 Lean Philosophy
Toyota Motor Corporation is known for being a family business leaded within the TPS philosophy. This philosophy implies to get the hands dirty, think with an innovative mind and focus on societies’ contribution (Liker, 2004). On this environment, the term Lean was emerged, by the researcher John Krafcik, since this system, in comparison with mass production, looks for the utilization of fewer resources (Womack, et al., 1990).
The major goal of Lean philosophy is to short the time from the demand of the customer to the delivery of the product or service, which is called “lead time”. Regarding this concept, there is also included on Lean terms the takt time concept. It represents the amount of time that must be elapse between two consecutive unit completions in order to meet the demand, taking into account the net time available to
work. Therefore, the takt time needs to be respected and reduced, in order to get more profits (iSixSigma, 2014).
With the aim of waste elimination and best quality product achievement, Lean methodology encloses a set of tools and techniques. Within this concept, it is possible to observe on figure 1 the contents of the house of TPS (Systems2win, 2003).
Figure 1 - House of Toyota Production System (Systems2win, 2003).
The TPS house structure represented on figure 1 has an import interpretation, considering Kaizen, standard work and Heijunka as the basis of the house. The two pillars of the house are the Just-In-Time (JIT) and Jidoka philosophies, both created within Toyodas’ family by Kiichiro Toyoda and Sakichi Toyoda (Liker, 2004).
Heijunka is a Japanese term for “levelization”, which on this context refers to “level out the production”. In other words, this principle advocates the reduction of quantity and variety of products that are kept in inventory instead of correspond to customer’s request. This principle grounds the pull systems that will be referred forward on this chapter (Liker, 2004) (Shook, et al., 2014).
6
production while a problem occurs, raising the quality of the product. The techniques used are based on mistake-proof systems like Poka-Yoke, andon, and problem-solving systems, such as “5 Whys” and Plan-Do-Check-Act (PDCA) cycle (Liker, 2004).
A continuous improvement methodology intents to highlight some aspects as human efforts, communication, team work and others, to achieve long term benefits to the organization. Therefore, it involves the whole members of an organization, from the top managers to the operators, including suppliers (Imai, 1997).
Known as a “low-cost approach to improvement”, Kaizen, the Japanese term for “continuous improvement”, requires going in Gemba, which means “real place” in Japanese. The approach of “go to Gemba first” seeks to identify the root cause of the problem, by asking “Why” five times. While the origin of the problem is found and countermeasures are applied, the next step for innovation is testing to standardize. Figure 2 shows the innovation in quality of a product/process over the time, comparing situations with and without Kaizen methodology (Imai, 1997).
As a main strategy, Kaizen focuses on Quality-Cost-Delivery (QCD), assigning the same level of significance to all of them. QCD priority is the satisfaction of the customer, where quality refers not only to the product, but process; the cost is considered from the design until the service hereafter the sold good; and the delivery of the finish good has to be on the exact quantity in the right time (Imai, 1997).
2.3 DEFINITION OF WASTE
Waste or Muda, in Japanese, is everything that doesn’t create value for the customer, instead it consumes resources (Womack, et al., 1996). As value-added activities is intent everything that the customer pays for, then the remaining events are considered non-value-added or waste (Williams, et al., 2012). Therefore it is fundamental to define value on the early phase of a project, thereby the waste is easily detected and bottlenecks can be found.
The general description of waste (Muda) can also be completed with Muri and Mura. Muri (Overburdened) is classified as strenuous, which is a task or a process that overload the resources available, leading it to a limit. The variability in quality, cost or delivery is known by Mura (Unevenness) (Williams, et al., 2012) (Imai, 1997). These three ways of waste constitute a system, the three M’s, represented on figure 3.
Figure 3 -Three M’s for wasteful activities, according to Lean methodology (Liker, 2004).
Taiichi Ohno defined seven types of Muda, eminent to the production, as the following (Harry, et al., 2010) (Manufactus, 2014) (Imai, 1997):
8
2. Waiting
Waiting is an evident cause of waste, while a worker or equipment is stopped it is not creating any value, instead is wasting time that could be productive. Consequently it causes delays on processes and mitigates the lucrativeness of a product.
3. Transport
Carrying products for long distances or do not planning transport routes, generates long lead time, and requires more human and material resources. 4. Over-processing or incorrect process
In case that a process provides a better quality or extra activities that are not requested, it is wasting resources unnecessarily. On the other hand if a project design is not well-planed, concerning the right steps and tools, it will cause a weak production.
5. Excess of inventory
It is considered waste a large amount of products stored without a plan or reason. Excess of inventory is a way to hide problems, like quality defects, and requires more resources as well as logistic work, transport and storage space. Furthermore, the product quality decreases over the time, so as long as finish goods are stored, and it becomes obsolete while delivered to the customer. 6. Unnecessary movement
The motion of a worker as moving things constantly, searching for tools, walking around or checking inventory, consumes time and efforts. This can be a result of unused standards on the workplace or unplanned processes.
7. Defects
The customer does not pay for defective products, so every bad part is an obvious waste of resources. Also reworking on a part or verifying it represents a loss of time and efforts.
Afterwards, Womack and Jones (1996) defined the unused employee knowledge as the eighth type of waste. Once that an employee deals continuously with a process, his or her knowledge could bring suggestions for improve it (Liker, 2004).
Commonly, within a process it is possible to determine only 5% of Value Added (VA) activities, considering the other activities as Non-Value Added (NVA), as figure 4 shows.
Figure 4 - The eight wastes (Harry, et al., 2010).
2.4 LEAN TOOLS
Over this subchapter, some Lean techniques will be presented. These techniques were used to concretize the proposed improvements exhibited on the course of this
10
manufactured more than one unit per step, just on the assembly line it was processed one unit at a time. Toyota manufacturing system produces small lot sizes, with the methodology of manufacture one unit per process that flows from one production cell to the other, without middle inventory, also called “buffer”. This methodology is called one-piece-flow and is a way to improve quality and eliminate inventory between steps (Liker, 2004).
If a problem emerges on the production line, it has to be solved at the moment and the production stops, so there is no chance that this mistake continues to the next process. Furthermore, it forces workers to solve problems inherent to the production, raising their skills, expertise and motivation to do the job.
A one-piece-flow manufacturing system needs to be design according with the Takt time of that product. It means that if the customer demands a unit every minute, every minute a unit has to be ready, regarding the time available for machines and workers (Liker, 2004). Therefore, in contrast with the conventional production that creates inventory, “buffers”, there is the one-piece flow production, with a single unit going through a set of processes without waiting times. This comparison is represented on figure 5 (ALD Vacuum Technologies, 2010).
2.4.2 PULL SYSTEMS
Within Lean philosophy, the production follows the demand of the customer so, it is the customer who decides the quantity of products to be manufactured. This is called “pull production system”, once that is the customer who pulls the production and not the opposite. On the other hand, there is the “push production system” that consists in manufacture as much as possible independent on the customer demand, based on forecasts. This situation is a typical approach used in mass production, where there is not a plan for the production and where it is produced as much as possible, which leads to large amounts of inventory (Imai, 1997).
Considering the pull system adopted by Toyota, Taiichi Ohno went further and created a methodology called Kanban that means “sign” (Liker, 2004). Kanban is a visual system, based on real data, for replenishment of products and control of the material flow (Vatalaro, et al., 2003). Therefore, the interchangeability between processes becomes easier, considering that kanban gives the recurrent information about what is needed and in which quantity (Ohno, 1988).
A pull production uses both kanban systems: “Conveyance Kanban” and “Production Kanban”. The first term can be also called “Withdrawal Kanban”, which refers to a card that flows with the items to a process until it is done and after comes back to the previous process to be attached to the next ones. Referring to “Production Kanban” or “Signal Kanban”, it consists in a signal to order recipients with the units needed for the further process, symbolized with a triangle (Sugimori, et al., 1977).
Figure 6 represents an example that uses both Kanban systems abovementioned, used on a production, with a buffer of 1,5 days between “Stamping” and “Welding + Assembly”. When it is necessary replace the material on the buffer, a signal is sent to the Stamping process for reply to this request (Shook, et al., 2014).
Figure 6 - Example of application of a Signal Kanban (triangle) and a Withdrawal Kanban (card) (Shook, et al., 2014).
12
to the customer the material with a longer storage time (Shook, et al., 2014).
Figure 7 shows a pull system using FIFO principle. When a lane with material is full, the providing processes should stop until it is required (Shook, et al., 2003).
Figure 7 – First-In-First-Out principle (Shook, et al., 2003).
2.4.3 PDCA CYCLE AND STANDARDS
Concerning the way for improvement, there are techniques as Plan-Do-Check-Act (PDCA) cycle, Total Productive Maintenance (TPM) and Total Quality Control (TQC). TQC is a system to identify, control and improve procedures, regarding cost and delivery, but mainly focused on product quality. Nevertheless, there is also the concern about the equipment quality and preventive maintenance, a system called Total Productive Maintenance (TPM), which main focus is improving equipment performance (Imai, 1997).
PDCA is an endless cycle, also named Deming cycle, which starts to establish goals and sketch ways to accomplish it (Plan). Therefore this plan has to be implemented (Do) and its results verified (Check). In conclusion, the project must be prosecuted (Act) and standards created. On figure 8 it is possible to observe the PDCA cycle sustained by standards, following a continuous improvement toward to innovation (Imai, 1997).
Figure 8 - PDCA or Deming cycle to achieve improvement along the time (Management, 2009).
In respect to continuous improvement, it is necessary to establish standards to maintain the best practices within an organization. Whether there are no standards, deviations from the normal situation occur and the probability of appear defects is higher. Furthermore, if the best practices for a procedure are not standardized, the efforts for improving will be vainly (Liker, 2004).
2.4.4 5S PRINCIPLE
Concerning the importance of a workplace organization and the appliance of a standardized work, the 5S principle supports the achievement of these aspects. This methodology comes from five Japanese words, which definition and order is represented below (Liker, 2004) (Imai, 1997):
1. Seiri – Usefulness
The first step is to establish order on the workplace by define the items necessary for a process and keep it in accessible place to be used. The tools, machines, defect parts or other objects that are not needed, should be taken away from the area. The criterion used is if it the item is not required for the further thirty days, then it must be relocated outside the working area.
14
floor to define the right place to sort a pallet or a tool box. 3. Seiso – Cleanliness
As soon as a workplace is cleaned, it motivates people to work on this environment, is safer to walk around and easier to detect anomalies on the equipment. Considering this, in this stage of 5S’s it can be implemented routine procedures to keep the workplace clean.
4. Seiketsu – Maintenance
Regarding the three steps abovementioned, it is fundamental to create systems to maintain the good practices established. In order to support this maintenance, it can be used tools as informative papers, check lists, among others, seeking for a high performing organization on the workplace. Nevertheless, without setting standards and commitment from workers, this stage will not be accomplished.
5. Shitsuke – Discipline
While the previous steps are applied and the best practices prosecuted, it requires for systematization. For this reason, this last step of 5S’s is considered the most difficult to implement taking in account the usual customs of people on the workplace and the resistance to change their routines.
With a focus on the methodology described, there are different ways to support people to achieve the best practices. Figure 9 represents an example of an informative resource to implement 5S principle on the workplace.
Figure 9 - 5S’s Principle (Quality foundation, 2008).
2.4.5 PROBLEM SOLVING SYSTEMS
Regarding Jidoka pillar, it emerges the concept of “automatic stop” to pause production while a problem appears. Thus, machines are able to detect a problem and transmit this information to the workers so they can solve it quickly (i.e. procedure entitled “automation with a human touch”) (Ohno, 1988). Therefore, the root cause of the problem has to be found instead of implement a temporary solution, by applying countermeasures to avoid recurrence (Japan Management Association, 1989).
2.4.5.1 DEFINE ROOT CAUSES
In order to solve a problem it is fundamental to identify it and analyze its inherent data to get hypothesis of its occurrence. Therefore, it is used a Cause-Effect diagram to define probable motifs, ordered by different groups which are connected to each other. These categories are known as the 5M’s for Men, Machine, Material, Method and Measures. Considering these groups, it is possible to add another one: “Mother nature”, which refers to the environment (Pande, et al., 2000).
Moreover, this tool can either be called fishbone or Ishikawa diagram, which allows the whole visualization of the main problem and its hypothetic causes (Lighter, et al., 2000). An example of a fishbone diagram and its correlated categories can be seen on figure 10.
16
Figure 10 - Fishbone diagram (Comindwork, 2014).
2.4.5.2 DATA ANALYSIS
Hereby, improvement processes requires defining which data should be measured, collecting and analyzing it. There are diverse types of tools used on the analysis of the data, depending on its characteristics and what has to be studied. Pareto Chart is an example of these tools that sorts data in a descending order, contradicting with a crescent curve, and shows that 20% of the causes are originating 80% of the problems. Thus, it can easily be found a bottleneck (Pande, et al., 2000).
It is represented on figure 10 a Pareto Chart of a pizza delivery process, considering that 20% of the reasons, which are “undercooked”, “overcooked” and “not enough topics”, were 80% of the complains of the customer.
2.4.5.3 MISTAKE-PROOF SYSTEMS
There are techniques aiming to bring problems to surface and avoid mistakes, such as Poka-Yoke and andon systems. Considering the principle of interrupting a process whether a problem occurs, it is used the andon system, the Japanese word for “lamp”. An example to prosecute the andon system is the application of light systems on the manufacturing process to warn the worker while there is a problem, by turning the red light on. Therefore the production stops, and it is compulsory that the workers involved on the production solve the abnormality (Japan Management Association, 1989). On figure 12 it is possible to visualize how this procedure works.
Figure 12 -Andon System(Velaction, 2009).
In this case represented on figure 12, the operator 2 find an abnormally and light on the yellow alarm, which give a signal to the andon board. Then the group leader knows that has to go in the production station 2 to support on solving the problem.
Toward to solve abnormalities on the work place, the engineer Shigeo Shingo created a tool named Poka-Yoke that means “mistake-proofing”. Originally, this system was created to assist workers to avoid mistakes. Although, its main goal is to improve quality in all the levels of the production, reducing substantially the appearance of abnormalities (Shimbun, 1988).
As a mistake proofing, this system does not give any chance to make errors. An example is demonstrated bellow on figure 13.
18
Figure 13 -Poka-Yoke System(David Straker, 2002).
2.4.6 VALUE STREAM ANALYSIS
Among other tools used in Lean, Value Stream Mapping (VSM) aims to visualize all the material and information flows, from the demand of the customer to the shipping. Therefore, VSM intends to describe the material flow and showing the waste inherent to the production (Liker, 2004).
VSM was originally used in Toyota with the name of “material and information flows”, which later was placed by James Womack and other authors, as “value stream” (Martin, et al., 2014). This tool can be applied to study the current state in order of waste elimination and future state to see the outcome of the improvements enforced (Nash, et al., 2008).
Before delineating a VSM, the takt time has to be calculated, making the relation between the daily number of units required by the customer and the daily available time of production. Equation 1 shows how to calculate the takt time (Shook, et al., 2003).
(1) In VSM, each box contains the process and its data, such as Cycle Time (CT), capacity of the process, available time of the machine or worker and other pertinent data that can be added. These boxes are connected by arrows, simulating the movement of the material flow (Liker, 2004). Under each box and arrow, there is a timeline, which contains the respective time that takes for processing one unit and move it to the next step. In the end of the timeline it is represented the “total cycle time” or “Process Time” (PT), the “travel distance” along the process or “Transport Time” (TT), and “Lead Time” (LT) that is the sum of PT and TT (Nash, et al., 2008).
Relative to the drawing of a VSM, it must be used standard symbols to make it universally understandable, as it can be seen on figure 14.
Figure 14 - Value Stream Mapping Symbols (QualityTrainingPortal, 2004).
Regarding the symbols represented above, and based on the data obtained by following products on working area, the next step is to drawn the VSM that can be visualized on figure 15.
20
Figure 15 - Value Stream Mapping example (ConceptDraw, 2013).
On the example represented by figure 15, the processes Milling, Welding, Painting and Assembly correspond to value added time, and the inventory between processes is the non-value added time. On the process “Assembly & Inspection” the cycle time is 3 minutes, but the value added is 2 min, once that inspection of the products is considered waste. In the end the product Lead Time is 65 days and the time that the customer is willing to pay is just 17 min.
Concerning this tool, it is possible to visualize the whole procedure and take countermeasures regarding waste extinguishment.
Milling Welding Painting Assembly & Inspection
3.
Case of Study
The present project consists on the application of the Lean Thinking within the organization. The case of study is the company Schüle Druckguss GmbH, situated in Schwäbisch Gmünd, Germany. Along this chapter, will be mentioned the different production halls of the organization and more over the daughter company in Slovakia. The sub chapters represent analysis of different aspects as hall organization, workload for the operator and truck routes, among others. Therefore, it will be presented proposals in order to improve all the system involved on the production.
3.1. The company
The foundation of Julius Schüle, companys’ first name, was in 1951 in Schwäbisch Gmünd, Germany and it was specialized in injection molding for the production of tools. In 15 years the production raised and the warehouse area was expanded to 4 000 m2, giving job to 150 employees. Later it moved on to a new administrative building and it was constructed a new building for manufacturing and another hall, summing a total area of 10.000 m2.
In 1999 the new company’s name changed to Julius Schüle Druckguss GmbH and it was founded a daughter company in Poprad, north of Slovakia, named Schüle Slovakia s.r.o., with 25 employees. The number of employees of Schüle daughter’s company was expanded to 180 in 2 years.
The German company expanded its area by constructing a new production and logistic hall to replace the old buildings and rented “Schenk Hall” with 1 600 m2, raising the area of production. In 2012 the company acquired a new building called “Automotive Hall” with 7.500m2 and registered 250 employees in Schwäbisch Gmünd and 380 employees in Poprad.
At the moment, the company has in total 600 employees and manufacture products mainly for automotive industry, but also pneumatic and gas heating markets. There are manufactured products as pumps, steering, valves and gears for the abovementioned markets. The company has thirty die-casting islands and manufacturing lines, characterized by its automation.
22
Figure 16 - Logo of the company.
3.2. Presentation of the problematic
Considering that companies are seeking for innovation, the implementation of low cost solution is the way for get more profits without investment, in which the focus is to make more with the existing resources. Therefore, a set of problematic situations, as well as potential improvements areas, were analyzed through Lean perspective in order to better define the best Lean tool for that purpose. Each situation is then detailed, in order to better defining the problematic, analyzing the data gathered and suggesting improvements.
Based on that, a set of projects’ improvements will be presented regarding problematic situations on the production, where the methodology and techniques used, as well as the countermeasures, will be described in detail on chapter four.
3.2.1. Schenk Hall
Schenk is the name of the hall rented by the company Schüle to manufacture four types of products. There are three shifts and each one has one Machine Group Leader (MGL), one Sub Machine Group Leader (SMGL) and four operators (O). The Logistic Worker (LW) is just present on the first two shifts, once that is not necessary for the third shift, or “night shift”. The workload of the LW and the Operator will be studied further on this sub-chapter. The structure of employees on this hall is represented on figure 17.
Figure 17 – Hierarchy in Schenk Hall.
The Schenk Hall has eight lines of automatized production that manufacture four different products: “New AMT Cover”, “New AMT Housing”, “Housing CP 14” and “GM Delta”. Figure 18 shows the products and the correspondent name.
Housing CP 14 New AMT Cover
New AMT Housing GM Delta
24
material flow on the workplace. Towards to optimize the material flow, specifically the transportation of pallets between warehouse and production lines, it was necessary to study the workplace organization first. Therefore, a project improvement focusing on Schenk Hall was carried out aiming to optimize the material flow, by the analysis of workload for the workers and workplace organization.
3.2.2. Automotive Hall
Automotive Hall is the newest of the company where are produced, in two lines of production, the “Topf” product. This product encompasses different operations, from the die casting process to the machining. Figure 19 represents this product that will be produced for the next seven years. In the future there will be implemented more lines for this product production, which justifies all the efforts to optimize its manufacturing process.
Figure 19 – Product “Topf”.
The goal of this project is to optimize all the procedure inherent to this product, aiming to reduce the lead time by determining bottlenecks and improving the production by waste elimination. Given the fact that the inventory inherent to the raw
material and finish goods of this product is high, it is decided that the main focus of this project will be inventory reduction.
3.2.3. Logistic of transports
Regarding the restructuration of the company in the future, one of the matters to be improved is the logistics. In the actual situation, the logistic worker faces some difficulties, while loading or unloading the trucks. Besides, the truck that comes from the daughter company in Slovakia has a long route between halls and its inherent activities take too much time. The challenge here is to optimize the activities inherent to this truck that every day transport material between Slovakia and Germany.
3.2.4. Daughter company in Slovakia
The daughter company of Schüle Druckguss GmbH (SDG), in Schwäbisch Gmünd, was founded 15 years ago in Poprad, Slovakia, with 25 employees and its name is Schüle Slovakia s.r.o. (SSK). Nowadays, SSK has in total 400 employees and in the production area the employees are working in two shifts per day of 12 hours each, with 45 minutes of break. The manpower is cheaper than in Germany so it’s possible to get competitive advantage even considering the distance of 1078 Km between these companies.
In SSK there are produced aluminum die-casting parts which are sent to SDG every day to be machined. Based on that, the objective of this project is to convert the actual production, divided by 13h of travel, in a closed process by moving the Production Line (PL) from SDG to SSK. To do that, the new process must start with the production of die casting parts and end with the production lines, where the product is machined. There are 12 different PL that have products being manufactured continuously and some of these products are changed according to the customer demand. This is true for the four variations of Gearbox Cover, where the main focus here will be only on the Gearbox Cover PL7.
The basis for the production is a contract, with a yearly prediction, about the quantity of components that the customer requires, including a safety number. Usually every week, the customer sends the demand to the sales department in SDG that communicates to the sales department in SSK, which orders the Raw Aluminum (RA)
26
The product Gearbox has different variations and it is manufactured according with the demand of the customer. In this subchapter it will be studied the variation PL7 (Figure 20), which is die casted in SSK and transported to SDG, where is machined in Automotive Hall.
Figure 20 – Gearbox Cover PL 7.
The procedure starts in SSK receiving the Raw Aluminium (RA), which comes from different points in Europe, as France, Spain, Hungary, Austria, England and Slovakia. It is considered an average of 1.250 Km of distance, which corresponds to 15 hours driving. The RA is unload from the truck to the Warehouse (WH), by the Logistic Worker (LW), and from the WH to the foundry where is setting the furnace.
Considering the different type of products, there are also different aluminium alloys and three furnaces, which are cleaned in the end of every shift. Inside of the furnace there are 1.000Kg of aluminium melted every hour, in the proportion of 60% of RA and 40% of Recycling Material (RM). This RM is the fragment formed by the distribution channel of the mould and it is separated from the moulded parts on the cutting station, in the Die Casting Island (DCI). These fragments are placed on the conveyor by the robot, and moved to a container identified with the alloy type as figure 21 shows. There is an operator responsible to move the full container from the DCI to the Foundry area, so these fragments can be melted over again.
Figure 21 – Container with the recycled material, identified with number and color of aluminium alloy.
There is a light system used for the furnace, which turns on the green light, so the Foundry Worker (FW) knows the aluminium is molten and ready to be transported. On the wall is standing another light system for the Die Casting Machine (DCM), which blinks when it is running out of material.
The FW is responsible for transport the molten aluminium with a forklift, in a pot with 600 Kg of capacity, from the furnace to the impeller and after to the DCM. The impeller is a treatment process that purifies the liquid aluminium by injecting gaseous nitrogen in the material. The rotation that the impeller induces on the molten aluminium causes the agglomeration of the impurities by chemical reactions and brings the impurities to the surface. The FW extracts the impurities to a container and transports the pot with the pure molten aluminium to the DCI (Christophe Leroy Ph.D., 1991).
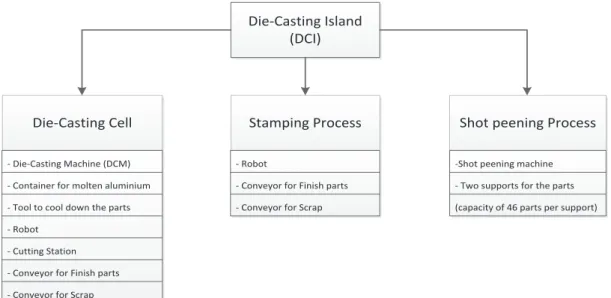
In this case of study, the DCI includes the die-casting machine, a checking station and a cutting station, although it is also possible to include stamping and shot peening processes inside of the DCI. On figure 22 it is possible to see the elements of the DCI and figure 23 comprises all this processes and simulates the material flow on DCI.
28
Figure 22– Scheme with the processes of the Die-Casting Island.
Figure 23 - Layout of a Die Casting Island.
On figure 24 it is represented the four moulded Gearbox Cover PL7 parts, which are the result of one shot of 3,4Kg of molten aluminium.
- Container for molten aluminium - Tool to cool down the parts - Robot
- Cutting Station - Conveyor for Finish parts - Conveyor for Scrap
- Conveyor for Finish parts - Conveyor for Scrap
- Two supports for the parts (capacity of 46 parts per support)
Figure 24 – Product structure after the die-casting process.
Afterwards the robot unloads the part from the conveyor to the Stamping process and puts it in another conveyor for the next step. The machine responsible for make the Stamping process on the part is represented on figure 25.
In the end of the conveyor, the operator takes the part and makes the debarring process with an automatic tool and loads it in the box. There is a second operator that picks up the part from the box and loads on the support of the shot peening machine, represented on figure 26. Shot peening is a process that induces compression stress,
30
Figure 26 – Shot peening machine with the two supports outside.
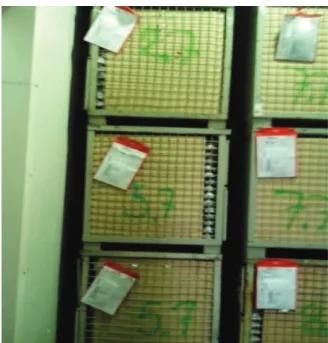
As soon as the process is finished, the operator signs the ready units with a marker and loads into the Grid Box (GB), after that, the second support goes inside and the process continues. Once the GB is full, the operator transports it to the Warehouse (WH), thus the unit is ready to be delivered to SDG. In the WH the First-In-First-Out principle (FIFO) is applied, writing the day and month of production on the pallet, ordered by product, as figure 27 represents.
Figure 27 – Grid boxes organization using FIFO principle.
It is possible to observe on figure 27, the GBs are organized from the one which was produced first on the top and will be the first one to be taken, to the last one produced on the bottom.
After the transport to SDG, in Automotive Hall, the Logistic Worker (LW) transports the GB directly to the place near the Production Line (PL). The operator has to transport the GB near the conveyor, to load the parts and make the checking process after the machining. The checking process includes two steps: visual checking of the part and cleaning with the vacuum machine. The operator puts the part on the pallet and transports near the storage, so the LW can make the packing process and the pallet is ready to be sent to the customer.
4. Carrying out of projects improvements
During this chapter will be presented the analysis and results according to the problematic described on the last chapter, in order to: optimize material flow and improve organization on Schenk Hall; optimize manufacturing process of “Topf”; optimize the logistics’ activities of the truck coming from Slovakia; and redefinition of Gearbox Cover PL7 production.
4.1. Schenk Hall
As it was mentioned before, the first improvement project was carried out aiming to optimize material flow in this area. To do that, workload of the workers and the material’s flow were studied and a set of actions proposed, which will be described in the following chapters. At the same time, since the workplace organization of the work area in Schenk Hall was not organized, which was particularly problematic, and there is not so much available space, this aspect will be also analyzed.
4.1.1. Material Flow: “Housing CP 14”
The problematic presented was relative to the product “Housing CP 14”, once that will be added, in a close future, another Production Line of this product. In order to understand all the steps that the product passes through, it was studied the material flow. Figure 28 represents materials’ flow of this product, beginning on the supplier of the Raw Aluminum (RA) and finishing with the delivery of Finish Goods (FG) to the customer.
34
Figure 28 - Material flow of the product Housing CP 14.
As it can be observed, the die casting process is done in SSK and the machining of the part is done in SDG. The focus will be on this last process, in SDG, and the material flow in detail within this company is represented on Annex II.
Afterwards it was necessary to drawn the Value Stream Mapping (VSM) of this procedure referent to the current product, which was analyzed considering SSK as the supplier. The VSM is the best way to visualize the whole situation and detect possible targets for waste elimination. On this case, the transport between steps is the target, once that the material flow is not organized, which is a great possibility to improve. Therefore, it was necessary to understand how this transport works and consequently, determine the workload for the workers involved on the material flow. The gathered VSM is represented on figure 29.
36
per shift, which means that 27.000 seconds corresponds to 100% of workload per worker.
Operator
Along this sub-chapter it will be studied product “Housing CP14” due to the previously described reasons. Referring to operators, it was defined the tasks per machine for one shift, considering that the present product has three Production Lines (PL). Table 1 represents the list of tasks for the worker in one PL of “Housing CP 14”, determined using an average value of three measurements on different shifts. Thus, it was calculated according to the amount produced per shift, which is 214 units per PL, considering 924 units of raw material inside one Grid Box (GB) and 360 units on the Small Load Carriers (SLC).
Table 1 – Time measurement of “Housing CP14” for the tasks of one operator in one production line. O (Operator) Step Tasks [1 Production Line] Time/step [sec] Time/shift [sec.] Calculation
1 Transport GB empty to Warehouse 72 16,7 924 units/214 units=4,3 Shift/GB
2 Transport GB full to production line 85 19,8 924 units/214 units=4,3 Shift/GB
3 Load on the conveyor 3 642 3 Sec./unit; 214 units/shift 4 Control of the part 34 7276 214 units/shift
5 Load on the SLC 3 642 214 units/shift
6 Marking parts 1 214 214 units/shift
7 Transport SLC full to assembly line 9 5,3 units/shift]=1,7shift/SLC [360 units/SLC] /[214
8 Transport SLC empty to PL 72 42,4 units/shift]=1,7shift/SLC [360 units/SLC] /[214 9 Superficial examination 180 1350 1x every hour
10 Extended examination 900 1800 2 x shift
11 Transport aluminium shavings to the container 180 180 1 x shift
TOTAL: 12.188 sec./ PL/ shift
In order to get the time per shift that the operator spends to load the SLC, it was measured 3 seconds per unit and multiplied for the capacity of production per shift, which is 214 units. According with this, the operator spends 642 seconds per shift doing this task on one PL. In total there are 12.188 seconds per shift of workload for the operator on one PL, in 27.000 seconds available, which corresponds to 45 % of workload per shift. Once that this product is produced in three machines and there are two operators to work on them, the workload per operator is 67,5 %.
Regarding the list of tasks abovementioned, it was necessary to determine the main causes of waste of time, inherent to the workload of the operator. Thus, it was
38 time/shift[sec.] 7276 1800 1350 642 642 478 Percent 59,7 14,8 11,1 5,3 5,3 3,9 Cum % 59,7 74,5 85,5 90,8 96,1 100,0 step Othe r Load on th e SLC Load on th e con veyo r Supe rficia l exa mina tion Exten ded e xami natio n Contr ol of the pa rt 10000 8000 6000 4000 2000 0 80 60 40 20 0 ti m e/ sh ift [s ec .] Pe rc en t
Figure 30- Pareto analysis of the time for operators’ workload on “Housing CP14”.
Throughout the Pareto analysis it is possible to observe that the tasks signed are the two causes for 80% of operators’ workload, per shift. Therefore, the tasks selected as “Control of the part” and “Extended examination”, are the focus for improvement.
Considering the “Control of the part”, it will be studied in detail and represented as the bottleneck of this study. Therefore it is necessary to identify all the small steps inherent to the control and measure each one. On Annex III there are represented in detail all these steps, and on Annex IV can be found the 10 measurements of time for two workers in each step. The steps 3 and 4 were measured together because the operators make the task simultaneously. The result, considering the average, is represented on table 2.
Table 2 – Average of steps’ measurement for the control task made by the operator.
Step Task Time [sec.]
1 Measure the hole of the part with a cylindrical tool 2,7
2 Clean with an spiral automatic machine 3,3
3 4
Make a visual control and take off aluminium sharps with a tool
Clean with a vacuum machine and check with a flashlight 19,8 5 Make a endoscopy test in three different points of the part 7,9
TOTAL: 34 sec.
The control of the part is the task that takes more time. Thus, if it can be automatized in order to make it faster and save human resources, it will be an important improvement. Regarding that, it is crucial to find out if it is possible to include this step inside the PL as an automatized process, by measuring the Cycle Time (CT) of the robot and the processes itself. The lead time of the PL for one part is 101 seconds, and figure 31 represents the cycle time of the stations and movements of the robot for one part, considering that these processes work in parallel.
40
take longer than the higher cycle time aforementioned.
Furthermore, it was considered that in the future there will be four PLs and if the actual situation continues with a manual control with 2 workers, they just can operate on this PL. For a future situation with an automatized control, the same workers can operate in four PLs of Housing CP14, as well as to make other tasks. The percentage of time saved per shift with this improvement can be seen on table 3.
Table 3 – Time saved with the automatized control for the product Housing CP 14.
As a conclusion, with the automation of the control process, the total workload per shift for one operator would be 60% (120% for two operators), which means that both can do other tasks in 80% of time left. Therefore, it will reduce the lead time on 34 seconds per part, once that the process will be done in parallel with other processes inside the PL. Furthermore, the investment on the automatic process will be recovered in one year, when compared with a cost for employing one worker.
In order to understand if it is possible, with an automatized control, both operators work in other product, it was made the same procedure for the product GM
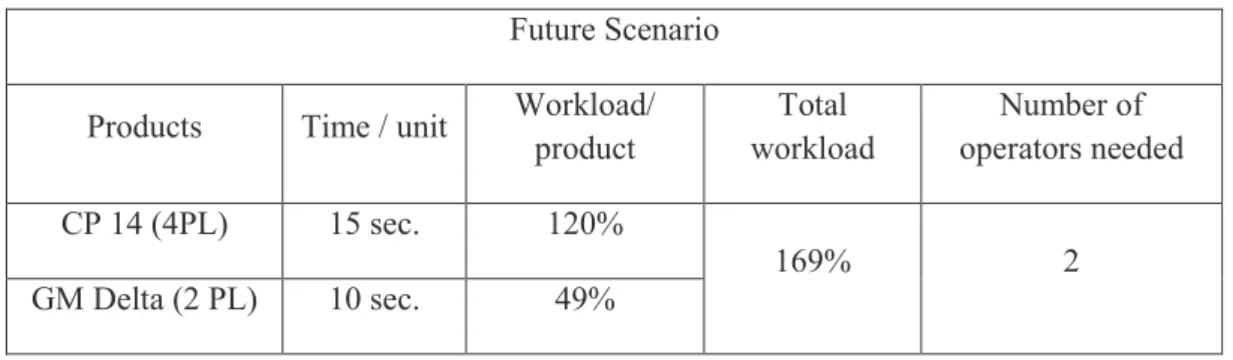
Time/ Step [sec.] Time/ Step/ Shift [sec.] % Task/Shift Workload/ Shift [sec.] % Total Workload/ Shift Operators for 4 Machines Manual control 34 7276 60% 12188 181% 2 Automatized control 15 3210 40% 8122 120% 2 Total time saved 19 4066 20% 4066 60%