______________________________________________________________________________________________________ 1,2 Geoprocessing Laboratoty, Instituto Federal de Educação, Ciência e Tecnologia do Ceará, Iguatu, Ceará, Brasil.
3 Direção Geral, Instituto Federal de Educação, Ciência e Tecnologia do Ceará, Iguatu, Ceará, Brasil.
4 Geoprocessing Laboratoty, Instituto Federal de Educação, Ciência e Tecnologia do Ceará, Iguatu, Ceará, Brasil.
Article
________________________________________________________________________________________________ Ciências Ambientais Environmental Sciences
Analysis of the influence of the elements methodology on
evapotranspiration in Morada Nova, in Ceará
Joaquim B. de oliveirar1, Paula J. A. Barbosa2, Dijauma H. Nogueira3, Efraim M. Araújo4, Francisco D. D.
Arraes5& Eliakim M. Araújo6
* Corresponding Author: efraimifce@gmail.com Received: June 3, 2017 Todos autores contribuíram de forma igualitária Accepted: JJune 22, 2017
Published: July, 2017
ABSTRACT
The reference evapotranspiration is an important agrometeorological parameter for planning and irrigation management and can be estimated by several methods. In the Brazilian Northeast, irregular and contingent water resources, studying evapotranspiration means optimizing irrigation management. This study aimed to analyze the influence of climate elements on the reference evapotranspiration calculated by the FAO-56 Penman-Monteith equation to the climatic elements of maximum and minimum temperature of the air, relative humidity, wind speed and insolation of a period of 53 Years, granted by INMET, of the city of Morada Nova in Ceará, whose climate according to the classification of Köppen is BSw'h '; Hot and semi-arid climate. The reference evapotranspiration was calculated according to the procedures suggested by FAO 56. The sensitivity analysis was based on the addition and decrease of one climatic element at a time in ± 5% up to the limit of ± 40% between -40% and -30% %, -20%, -15%, -10%, -5%, + 5%, + 10%, + 15%, + 20%, + 30% and + 40%, while maintaining the values of the other elements Constant. The results showed that the variation of the elements of the climate between dry and rainy season did not change the sensitivity of the Penmam-Monteith FAO 56 model to the evaluated climatic elements. The Penmam Motheith model, in the climatic conditions of Morada Nova, CE, is more sensitive to the elements of maximum temperature of the relative humidity of the air, followed by insolation, wind speed and minimum air temperature.
Keywords: Penman-Monteith, Sensitivity analysis, Semi-arid
Introduction
Nowadays, we are increasingly faced with water scarcity and the term renewable resource is no longer applied to water because of its ecological, economic and social importance, being vital to survival, biodiversity and food production.
Most of the surface water returns to the atmosphere through the effects of evaporation and transpiration, and is best seen in environments where both processes occur simultaneously, since in vegetation soils it is practically impossible to separate water vapor from evaporation of the soil from that originated of the plants transpiration. In this case, an ideal environment is the semi-arid.
This happens because evaporation is responsible for the movement of water to the air from sources such as soil, forest canopy and bodies of water, such as lakes, streams, rivers and seas. Already the transpiration represents the movement of water within a plant, and the consequent loss of water to the atmosphere (O ECO, 2014).
Different environments present different rates of evapotranspiration, since it is affected by several factors, such as: plant growth stage, growth or maturity level, leaf type, percentage of soil cover, solar radiation, humidity, temperature and the wind. Improving the management of water resources is the first step towards conserving water on our planet. In this sense, the evapotranspiration is very useful in climatology for the quantification of
121 | Rev. Geama, Recife – 3 (3): 114-119. Jul-Sep 2017. | Online version ISSN: 2447-0740 | http://www.geama.ufrpe.br regional water availability (CARDOSO; MARCELINO,
2005).
The methods for estimating ETo are generally dependent on several atmospheric variables, such as Penman-Monteith, parameterized in bulletin nº 56 of FAO, forcing producers to seek methods that depend on few variables, as alternative to irrigation management planning.
The objective of this work was to analyze the sensitivity of the Penman-Montheith equation parameterized by FAO, to the climatic elements: maximum and minimum air temperature, relative air humidity, wind speed and insolation in Morada Nova city, Ceará state.
Material and Methods
The study comprise the Morada Nova city in the state of Ceará, localized in the Baixo Jaguaribe sub-basin, in the semi-arid region of the northeastern sertão of Brazil.
The average monthly climatic elements of maximum temperature, minimum temperature, relative humidity, wind speed and insolation, used in the study were obtained at the Main Climatological Station belonging to the National Institute of Meteorology (INMET). Monthly averages were calculated using a 53-year coverage period from 1961 to 2014. Failure completion of the series was performed according to the procedures suggested by the FAO 56.
Wind speed measured at 10 meters from the surface shape adjusted to the height of 2 meters, according to procedure described by Allen et al. (1998).
For the calculation of evapotranspiration and to verify the possible effects of changes in climatic elements in evapotranspiration was used the model parameterized by FAO (ALLEN et al., 1998).
ETo=
(0,408)∆(Rn−G)+γ900
T+273u2(es−ea).
∆+γ(1+0,34u2) Eq. 1
At where: ETo = reference evapotranspiration, mm d-1; Rn = balance of radiation to the crop surface, MJ m-2; G = soil heat flux density, MJ m-2; T = average air temperature at 2 m height, °C; u2 = wind speed of 2 m height, m s-1; es = steam saturation pressure, kPa; ∆ = slope of the vapor pressure curve, kPa °C-1; 𝛾 = psychometric coefficient, kPa °C-1.
The slope of the vapor pressure curve is calculated as a function of the temperature. ∆=2504 exp(
17,27 T T+237,3)
(T+237,3)2 Eq. 2
The monthly average temperature (T) is obtained as a function of the maximum temperature (Tx) and the minimum air temperature (Tn).
T=Tx+Tn
2 Eq. 3
Psychrometric constant is calculated as a function of atmospheric pressure.
𝛾 = 0,00065 × 𝑃 Eq. 4
The atmospheric pressure (P) is given as a function of the local altitude (z).
P=101,3 (293-0,0065z
293 ) 5,26
Eq. 5
The saturation pressure of the steam (s) is calculated as a function of the saturation pressure of the air temperature (e°):
es=es(Tx)+es(Tn)
2 Eq. 6
At where:
es(T)=0,6108 exp (T+237,317,27 T) Eq. 7
Substituting T into the equation for Tn gives the saturation pressure of the minimum air temperature "e" _"s" (Tn) and T by Tx we have "e" _"s" (Tx).
The radiation balance (Rn) is the difference between the balance of shortwave radiation (Rns) and the balance of longwave radiation (Rnl). Obtained by equations: Rn=Rns+ Rnl Eq. 8 Rns=(1-α)Rs Eq. 9 Rnl=σ [TxK4+TnK4 2 ] (0,34-0,14√ea). (1,35 Rs Rso-0,35) Eq. 10 Rs=Ra(0,25+0,50Nn) Eq. 11 Rso=(0,75+2.10-5z)Ra Eq. 12 Ra=24.60 π Gscdr[ωssen(φ)sen(δ)+cos(ω)cos(δ)sen(ωs)] Eq. 13 ea=100UR(es) Eq. 14 dr=1+0,033·cos (3652πJ) Eq. 15 =0,4093·sen (3652πJ-1,39) Eq. 16 ωs=cos-1(-tanφ·tan) Eq. 17
N=24ωs
π Eq. 18
At where: Ra = solar radiation at the top of the atmosphere, MJ 2 d-1; Rs = solar radiation, MJ
m-2 d-1; Rso= global solar radiation for clear sky days, MJ m-2 d-1; n = Number of hours of sunshine or insolation, h; N = astronomical duration of the day, h;ea = current steam pressure (kPa); σ = Stefan-Boltzmann constant, 4,903.10-9 MJ K-4 m-2 d-1; TxK = maximum air temperature, K; TnK = minimum air temperature, K; J = Julian day, dia; = solar declination, radianos; Gsc = solar constant, 0,0820 MJ m-2 min-1; dr = distance relative to the sun, adimensional; ωs = hour angle of sunrise or sunset, radianos; φ = local latitude, radianos.
The soil heat flux (G) is calculated as a function of the temperature of the current month (Ti) and the temperature of the previous month (Ti-1):
G=0,14(Ti-Ti-1) Eq. 19
The sensitivity analysis was based on the increase and decrease of the values of the meteorological elements in changes of up to 40%, one at a time and maintaining the values of the other constant
elements, arranged between -40%, -35%, -30% 25%, -15%, -10%, -5%, + 5%, + 10%, + 15%, + 20%, + 25%, + 30%, + 35%, + 40% .
To quantify the impact of a range of values of an input parameter on the results obtained with the model, sensitivity coefficients were calculated for Tx, Tn, n, UR, u2. According to the procedure suggested by McCuen (1974):
Sr=∆ET0
∆Vi.
Vi
ET0 Eq. 20
At where: Sr = coefficient of sensitivity of the model; ∆ETo = variation in the reference evapotranspiration with the change in meteorological element; ∆Vi = variation in each parameter; Vi = parameter used.
The variation of the ETo sensitivity coefficient for disturbed series was obtained as described by Gong et al. (2006):
∆ET0 ET0≅ ( ∆Tx Tx) .Sr(Tx)+ ( ∆Tn Tn) .Sr(Tn)+ ( ∆n n) .Sr(n)+ ( ∆UR UR) .Sr(UR)+ ( ∆u2 u2) .Sr(u2) Eq. 21
At where: ∆Tx = variation in maximum air temperature, °C; Sr(Tx) = coefficient of sensitivity for maximum air temperature; ∆Tn = variation in minimum temperature, °C; Sr(Tn) = coefficient of sensitivity for minimum air temperature; ∆n = variation in sunshine, h; Sr(n) = coefficient of sensitivity for insolation; ∆UR = variation in relative air humidity, %; Sr(UR) = coefficient of sensitivity for relative humidity of the air; ∆u2 = variation in wind speed at 2m height, m s-1; Sr(u2) = sensitivity coefficient for wind speed at 2m height.
Table 1 - Average annual geographic and meteorological data for the city of Morada Nova in Ceará (Author 2017).
Onde: - Latitude; - longitude; z - altitude; Cc - classificação de köppen; Ta - temperatura do ar média anual; n - insolação total anual; UR - umidade relativa média anual;
u10- - velocidade do vento média anual a 10 m de altura.
Results and Discussion
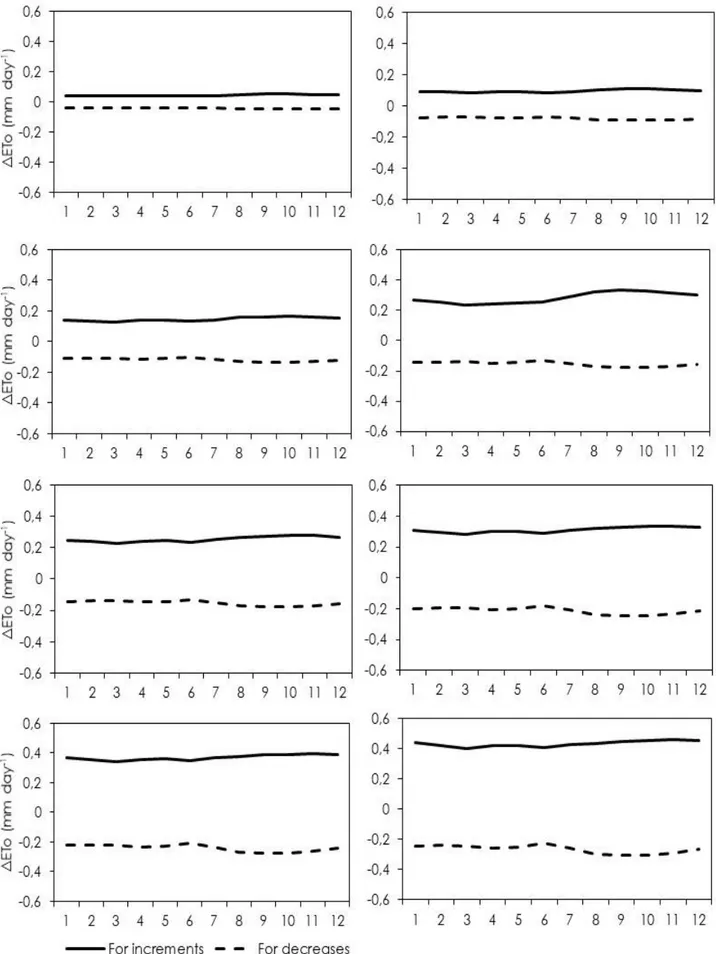
The variation of the reference evapotranspiration along is very small when the data series was disturbed by 5%. The same can be observed for 10, 15, 20, 30, 35 and 40% of disturbance in the series of climate elements (Figure 1).
When the disturbance of the elements of the climate was 25%, the evapotranspiration variation was lower in the months when rainfall is normally observed (January to June) and higher in the hot and dry months (July to December) of the year (Figure 1).
In general, as the magnitude of the increments and decreases increases, the amplitude of the reference evapotranspiration variation increases, with changes of ± 40% being more prominent (Figure 1).
Oliveira et al. (2016), analyzing the sensitivity of the meteorological elements in the
Penman-Monteith equation for the Iguatu city in Ceará, notice a pronounced difference between dry and rainy season. In the rainy season, the influence of climate elements on the Penman-Monteith FAO 56 model was less intense than in the dry season.
Silva (2011), in a field experiment conducted in 2009, in the Capim city, PB, verified that the reference evapotranspiration obtained by Penman-Monteith FAO 56 presented the highest values of evapotranspiration in the periods of September 2008, February, July and September of 2009, with values higher than 7.0 mm d-1, a period that corresponds to the time of high atmospheric demand and also the greater availability of water in the soil through precipitation or irrigation.
In general, when compared to the variation in evapotranspiration with the variation of the climatic element, the more inclined the resulting points in the graph are, the more sensitive evapotranspiration is in relation to the climate element in question. In this sense, the ETo showed to be more sensitive to the climatic elements of the maximum temperature
Local z Cc Rain Ta n UR u10
Morada
123 | Rev. Geama, Recife – 3 (3): 114-119. Jul-Sep 2017. | Online version ISSN: 2447-0740 | http://www.geama.ufrpe.br and relative humidity of the air, and to the elements
of insolation and wind speed. The minimum air temperature was the climatic element with the least influence on ETo (Figure 2).
Xu et al. (2006) observed that the most sensitive variable to this equation in its area of study was the relative humidity of the air followed by short-wave radiation and air temperature; Already the wind velocity presented the lowest values of sensitivity coefficients, which were explained by its great spatial variability in the region.
Results similar to this study were found by Silva (2011) and Oliveira et al. (2016). The values of the coefficients of sensitivity elements of the climate involved in the calculation of evapotranspiration where evapotranspiration was more sensitive to relative humidity and air temperature, followed by wind speed.
While the evapotranspiration sensitivity coefficients were lower with the decrease and higher with the increase in the climate elements, the relative humidity of the air presented an inverse behavior, the sensitivity coefficient was higher in the decrease and lower in the increase (Figure 2).
Regarding the climatic elements of maximum and minimum temperature of air, insolation and wind speed, the reference evapotranspiration variation was positive, increasing when the series was disturbed for more and decreasing when the series was disturbed for less
However, contrary to what was observed in this work, where the relative humidity presented negative variation, the results of Hupet and Vanclooster (2001) showed that the air temperature was the one that presented negative variation of the sensitivity.
In this work the radiation component was estimated from the insolation. Although the study by Silva (2011) determined that the Penman-Monteith FAO 56 model was very sensitive to radiation, followed by wind speed and air temperature, in Morada Nova, CE, a sensitivity was observed with respect to the element insolation and wind speed. In this locality, the element to which Penman-Monteith is less sensitive is the minimum temperature of the air.
The closer to zero the sensitivity coefficient the less the impact of the climate element the impact of the climatic element on the evapotranspiration. The analysis of the behavior of the monthly average coefficients of sensitivity throughout the year show that in the rainy season, February to May, they vary month to month, whereas in the driest period they tend to remain constant, except for the relative humidity of the air, whose greater oscillation Is from May to August, when relative humidity tends to the lowest values of the year (Figure 3).
In general, the sensitivity coefficients for maximum air temperature were those that showed
higher coefficient of sensitivity with 0.71, followed by relative humidity with -0.46, insolation with 0.33, wind speed with 0.18 and Minimum air temperature of 0.11 (Figure 3).
The calculated sensitivity coefficients showed seasonal monthly oscillations for all meteorological elements. The elements of insolation and minimum air temperature showed similar behavior, in the rainy season from February to May the coefficients of sensitivity were higher than in the dry period. The wind velocity was observed higher coefficients of sensitivity in the dry period from July to December than in the rainy season (Figure 3).
There was a higher sensitivity of ETo to the maximum temperature and the relative humidity of the air. As the maximum temperature was more sensitive in the dry period from August to December than in other periods of the year, and relative humidity was more sensitive in June and did not present a difference between rainy dry season (Figure 3).
The results for the city of Iguatu, Ceará, located in the semi-arid region of Ceará, were similar, where the Penman-Monteith model was more sensitive to the elements of maximum air temperature and relative humidity (OLIVEIRA et al., 2016).
Similar results were found by Alencar (2012) in a study of the temporal evolution of reference evapotranspiration and its sensitivity to the main climatic elements in the city of Uberaba - MG, showing that among the climatic elements studied maximum temperature and relative humidity were the elements that presented Higher sensitivity coefficients, followed by insolation, wind speed and minimum temperature with the following coefficients of average sensitivity: 1.01; -0.53; 0.31; 0.19; And -0.15 respectively.
According to Carvalho and Junior (2008), estimates of evapotranspiration differ mainly in relation to daily variability, with the more complex models, Penman and Penman-Monteith, and even Priestley-Taylor A daily variability when compared to simpler, air-temperature-based models such as Thornthwaite, Hargreaves and Oudin, which tend to reflect only intra-annual seasonality with higher ETP rates in the spring-summer period.
By the study of Alencar (2012) ETo is higher than 90 mm year-1, reaching its peak in October, with an average value of 152 mm. The sum of the evapotranspiration of the period from September to March (period of higher rainfall indices) corresponds to 64% of total annual evapotranspiration that is 1495 mm per year. According to the authors it was observed in the rainy season that the highest values of the sensitivity coefficients of the climate elements studied were observed.
Figure 1 Average variation of ETo for the increments and decreases of ±5% (a), ±10% (b), ±15% (c), ±20% (d), ±25% (e), ±30% (f), ±35% (g), e ±40% (h), from meteorological elements for the Morada Nova city, CE (Author, 2017).
125 | Rev. Geama, Recife – 3 (3): 114-119. Jul-Sep 2017. | Online version ISSN: 2447-0740 | http://www.geama.ufrpe.br
Figura 2 – Variation of Reference Evapotranspiration (ETo) in function of maximum air temperature (a), minimum air temperature (b), insolation (c), relative air humidity (d) and wind speed (e) in Morada Nova city (Author 2017).
Figura 3 - Average monthly variation of the sensibility coefficients: maximum air temperature (Tx), minimum air temperature (Tn), insolation (n), relative humidity of the air (Ur) and wind speed (U10) in Morada Nova-CE. (Author, 2017).
Conclusions
The FAO Penman-Monteith model presented higher sensitivity to maximum air temperature and relative humidity, followed by insolation, wind speed and minimum air temperature.
Between the rainy and dry season the sensitivity of the Penman-Monteith FAO 56 model did not present a pronounced variation to the evaluated climatic elements.
Acknowledgement
To Instituto Federal de Educação, Ciência e tecnologia do Ceará, campus Iguatu and the Laboratory of Geoprocessing.
References
ALENCAR, L. P.; SEDIYAMA, G. C.; WANDERLEY, H. S.; HENDERSON, S.; ALMEIDA, T. S.; DELGADO, R. C.; VIEIRA, G. H. S. Evolução temporal da evapotranspiração de referência e sua sensibilidade aos principais elementos climáticos na cidade de Uberaba – MG. Revista Brasileira de Ciências Agrárias, v. 7, n. 1, 2012.
ALLEN R. G.; PEREIRA, L. S.; RAES, D. SMITH, M. Crop evapotranspiration-guidelines. Rome: FAO, 1998. 297 p FAO Irrigation and DrainagePaper, 56. CARDOSO, M. J.; BASTOS, E. A.; ANDRADE JÚNIOR,
A.S.; RODRIGUES, B.H.N. Uso da exigência térmica para a determinação do ciclo de cultivares de milho sob irrigação. In: X CONG. BRAS. DE AGROMETEOROLOGIA, 10, 1997, Piracicaba. Anais... Piracicaba: SBAGRO, 1997, p. 23-25. CARVALHO, T. L. L; JUNIOR, D. S. R. Avaliação da
influência dos dados de evapotranspiração potencial no desempenho de modelos hidrológicos em bacias do semiárido cearense. IX Simpósio de Recursos Hídricos do Nordeste. 2008, 20 p.
GONG, L.; XU, C.; CHEN, D.; HALLDIN, S.; CHEN, Y. D. Sensitivity of the Penman-Monteith reference evapotranspiration to key climatic variables in the Changjiang (Yangtze River) basin. Journal of Hidrology, v. 329, 2006.
McCUEN, R. H. A sensitivity and error analysis of procedures used for estimating evapotranspiration. Water Resources Bulletin, v. 10, n. 3, 1974.
MINUZZI, R. B.; VIANELLO, R. L.; SEDIYAMA, G. C. Oscilações climáticas em Minas Gerais. Revista Brasileira de Meteorologia, v. 25, n. 2, 2010.
O ECO. Dicionário ambiental. [S.l]:[s.n] 2014: Acesso em: 11 de jan. 2017. Disponível em: <http://www.oeco.org.br/>.
OLIVEIRA, J. B.; BRASIL, P. P.; ARRAES, F. D. D.; RODRIGUES, V. B.; OLIVEIRA, W. C.; CORDEIRO, A. Y. P. A. V. G. Análise de sensibilidade dos elementos metorológicos na equação de Penman –Montieth FAO 56 no semiárido. In:
CONGRESSO BRASILEIRO DE
AGROMETEOROLOGIA, 19., 2016, João Pessoa, Anais... João Pessoa: SBMET, 2016. Acesso em: 05 abr. 2017. Disponível em: <www.cbmet 2106.regg.co/anais#>.
SILVA, B. K. N.; SILVA, V. P. R.; AZEVEDO, P. V., FARIAS, C. H. A. Análise de sensibilidade dos métodos de estimativa da evapotranspiração de referência e razão de Bowen em cultura da cana-de-açúcar. Revista brasileira de engenharia agrícola e ambiental, Campina Grande, v. 15, n. 10, 2011. XU, C., GONG, L., JIANG, T., CHEN, D., SINGH, V. P.
Analysis of spatial distribution and temporal trend of reference evapotranspiration and pan evaporation in Changjiang (Yangtze River) catchment. Journal of Hydrology, v. 327, n. 1, 2006.