Department of Information Science and Technology
Visualization and Analytics of
Codicological data of Hebrew books
T
IAGOM
IGUELG
ARCEZP
ATEIROA Dissertation presented in partial fulfillment of the Requirements for the Degree of
Master in Computer Engineering
Supervisor
Elsa Alexandra Cabral da Rocha Cardoso, Assistant Professor, PhD
ISCTE-IUL
Co-Supervisor
Débora Marques de Matos, PhD
Westfälische Wilhelms-Universität Münster
iii
Resumo
A presente dissertação tem como objetivo obter conhecimento estruturado de manuscritos hebraicos coletados por codicologistas. Estes manuscritos refletem a produção de livros de uma região específica, nomeadamente a região “Sefarad”, no período entre os séculos X e XVI. O objetivo é fornecer um modelo de dados apropriado, usando um vocabulário comum, para diminuir a natureza heterogénea desses conjuntos de dados, bem como sua incerteza inerente causada pela natureza descritiva no campo da Codicologia. Este projeto de investigação foi desenvolvido com o objetivo de aplicar técnicas de visualização de dados e data mining no campo da Codicologia e Humanidades Digitais. Usando os dados de manuscritos hebraicos como ponto de partida, esta dissertação propõe um ambiente para análise exploratória a ser utilizado por especialistas em Humanidades Digitais e Codicologia para aprofundar a compreensão dos dados codicológicos, formular novas hipóteses de pesquisa, ou verificar existentes, e comunicar as suas descobertas de uma forma mais rica. Para melhorar as visualizações e descoberta de conhecimento, tentaremos usar métodos de data mining, como a Association Rule
Mining e Formal Concept Analysis.
Palavras-Chave: Visual Analytics, Ciência de Dados, Big Data Analytics, Data
Mining, Machine Learning, Knowledge Discovery, Humanidades Digitais, História de
v
Abstract
century. The goal is to provide a proper data model, using a common vocabulary, to decrease the heterogenous nature of these datasets as well as its inherent uncertainty caused by the descriptive nature of the field of Codicology. This research project was developed with the goal of applying data visualization and data mining techniques to the field of Codicology and Digital Humanities. Using Hebrew manuscript data as a starting point, this dissertation proposes an environment for exploratory analysis to be used by Humanities experts to deepen their understanding of codicological data, to formulate new, or verify existing, research hypotheses, and to communicate their findings in a richer way. To improve the scope of visualizations and knowledge discovery we will try to use data mining methods such as Association Rule Mining and Formal Concept Analysis. The present dissertation aims to retrieve information and structure from Hebrew manuscripts collected by codicologists. These manuscripts reflect the production of books of a specific region, namely “Sefarad” region, within the period between 10th and 16th
Keywords: Visual Analytics, Data Science, Big Data Analytics, Data Mining, Machine Learning, Knowledge Discovery, Digital Humanities, Jewish Book History, Codicology, Material Culture
vii
Acknowledgments
I would like to express my sincere thanks to Professor Elsa Cardoso and Débora
Matos for encouraging me throughout this path, for allowing me to have this opportunity and for sharing all the knowledge that was, without doubt, valuable. Thank you again for keeping me on track and sharing your experiences in such a patient and gracious way.
A special thank you to my girlfriend, for encouraging me on this journey, for giving up on several weekends and for traveling with me, thinking that I was going on vacation when in reality it was because of a conference. Finally, but not last, a big thank you to my family, especially my mother and sister, for all the encouragement given to finish this step.
viii
C
ONTENTS
Resumo ... iii Abstract ... v Acknowledgments ... vii List of Figures ... x Acronyms ... xiii Introduction ... 11.1 Motivation and Research Context ... 4
1.2 Research Methodology ... 6
1.2.1 Identify Problem and Motivate ... 8
1.2.2 Define Objectives for Solution ... 8
1.2.3 Design and Development ... 9
1.2.4 Demonstration ... 10
1.2.5 Evaluation ... 11
1.2.6 Communication ... 11
1.3 Document Structure ... 11
Related Work ... 13
2.1 Big Data Lifecycle ... 16
2.2 Data Cleaning and Preparation ... 18
2.2.1 Missing Values ... 18
2.3 Data Visualization of high dimensional sources ... 19
2.4 Knowledge Extraction ... 21
2.4.1 Data Mining and Unsupervised Learning Algorithms ... 22
2.4.1.1 K-Means Algorithm ... 22
2.4.1.2 Hierarchical Clustering ... 23
2.4.1.3 Association Rule Mining ... 23
2.4.2 Formal Concept Analysis ... 24
Design and Development ... 28
3.1 Development Languages ... 28
ix
3.2.1 Sfardata ... 30
3.3 CodicoDaViz ... 31
3.3.1 Domain Understanding ... 34
3.3.2 Data Acquisition ... 36
3.3.3 Data Identification (Controlled Vocabulary artifact) ... 36
3.3.3.1 Historical Data ... 37
3.3.3.2 Codicological Data ... 39
3.3.3.3 Palaeography Description ... 40
3.3.4 Data Profiling, Preparation and Cleaning Method ... 40
3.3.5 Data Aggregation and Representation ... 45
3.3.5.1 Preliminary Data Model ... 45
3.3.5.2 ETL ... 46
3.3.5.3 Multidimensional Model ... 47
3.4 Visual Analytics ... 49
3.4.1 Conceptual Areas of Analysis ... 53
3.5 Unsupervised Learning and Knowledge Extraction ... 53
3.5.1 Cluster Analysis ... 54
3.5.1.1 K-Means Algorithm ... 55
3.5.1.2 Hierarchical Clustering ... 58
3.5.1.3 Results ... 59
3.5.2 Formal Concept Analysis ... 61
3.5.3 Association Rule Mining ... 63
Demonstration ... 66
4.1 Overview ... 66
4.2 Codicological Dahsboards ... 67
4.3 Data Analysis ... 76
Conclusion ... 77
5.1 Analysis of Research Questions ... 78
5.2 Limitations ... 79
5.3 Further Work ... 81
x
L
IST OF
F
IGURES
Figure 1.1 - Design science research cycles. (Retrieved from (Hevner & Chatterjee, 2010), p. 16) ... 6 Figure 1.2 - Design Science Research Methodology in nominal process sequence form. (Retrieved from (Peffers et al., 2007), p. 14) ... 6 Figure 1.3 - DSRM adopted in this thesis. (Adapted from Figure 1.2) ... 7 Figure 1.4 - CRISP-DM reference model. (Retrieved from (Chapman et al., 2000), p. 10) ... 7 Figure 2.5 Four V's of Big Data. Taken from IBM (2018) ... 14 Figure 2.6 - Four level breakdown of the CRISP-DM methodology. Retrieved from (Chapman et al., 2000), p. 6 ... 17 Figure 2.7 - Dimensions of data mining contexts and examples. Taken from (Chapman et al., 2000), p.7 ... 17 Figure 2.8 - CRISP4BigData Reference Model Version 1.0 from Kaufman 2016. Taken from (Berwind et al., 2016), p.5 ... 18 Figure 2.9 - Example of over plotting through parallel coordinates, taken from (Theus et al., 2008) ... 20 Figure 2.10 Example of Geographic D3 and Radial Tree in D3 for content exploration. Taken from (Bostock et al., 2011) ... 20 Figure 2.11 - Set of formal concepts using binary encoding of dataset. Example taken from (Buzmakov, 2015), p. 27 ... 25 Figure 2.12 - A set of formal concepts w.r.t context on Figure 2.11. Example taken from (Buzmakov, 2015), p. 27 ... 25 Figure 2.13 - The FCA-lattice for the context on Figure 2.12. Example taken from (Buzmakov, 2015), p. 28 ... 26 Figure 2.14 - Central pane showing the current concept: intent as thumb-nails. Example taken from (Cole et al., 2018) ... 27 Figure 2.15 - Example of associative rules in natural language from "A Place of Art". Example taken from (Cole et al., 2018) ... 27 Figure 3.16 - An example taken from Sfardata (Beit-Arié, 2017) demonstrating its descriptive nature ... 30 Figure 3.17 - Adapted lifecycle to use visualization as a central data inspector step .... 31
xi
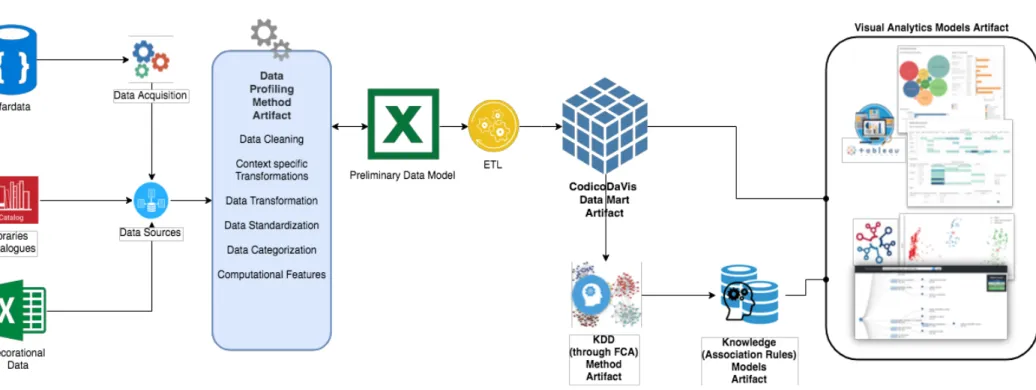
Figure 3.18 - CodicoDaViz framework architecture. ... 33
Figure 3.19 - Concept map covering the relations that describes a manuscript. ... 35
Figure 3.20 - Sfardata specific data acquisition process ... 36
Figure 3.21 - Part 1 of 3 of mind map with the Historical attributes ... 38
Figure 3.22 - Part 2 of 3 of mind map with the Codicological attributes ... 39
Figure 3.23 - Part 3 of 3 of mind map with the Palaeography attributes ... 40
Figure 3.24 - Missing values plot from several attributes. ... 42
Figure 3.25 - Data visualization as a key tool to spot wrong geographies. ... 43
Figure 3.26 - Visualization used to spot unexpected information requiring another iteration. ... 45
Figure 3.27 - Data sample taken from Excel to show the model structure ... 46
Figure 3.28 - ETL workflow to feed data mart ... 47
Figure 3.29 - CodicoDaViz data mart artifact. ... 48
Figure 3.30 - Correlation Heatmap for feature space ... 50
Figure 3.31 - Example of a dashboard for geographic information ... 52
Figure 3.32 - Elbow measure based on K-Means score ... 56
Figure 3.33 - Silhouette score and sampling for two, three and four clusters ... 57
Figure 3.34 - K-Means labelled data (right) against original PCA components (left) ... 57
Figure 3.35 - H. Clustering Dendrogram for Material analysis ... 59
Figure 3.36 - Overall Accuracy per algorithm and dataset including mean and deviation ... 60
Figure 3.37 - Encoded data sample prepared for FCA ... 62
Figure 3.38 - Tree of FCA produced concepts ... 63
Figure 3.39 - Association Rule model sample using ConExp ... 64
Figure 4.40 - Dashboard for Content Analysis on Subject and Destination ... 68
Figure 4.41 - Dashboard for Material Aspects Overview with a drill-down by material type ... 69
Figure 4.42 Dashboard for Material Aspects showing interactive format analysis ... 70
Figure 4.43 - Dashboard with Decoration info. based on subject ... 71
Figure 4.44 - Dashboard with Palaeographical analysis ... 72
Figure 4.45 - Dashboard with contents and purpose analysis ... 73
Figure 4.46 – Dashboard with Material overview ... 74
Figure 4.47 - Dashboard with Geographical information ... 75
Figure 4.48 - Visualization with geographic information of multi-handed manuscripts analyzing the subject, script and the number of hands ... 76
xii
Figure 5.49 - Evidence raised on how unclear is having repeated nodes in different levels ... 80
xiii
A
CRONYMS
ACM Association for Computing Machinery
ARI Adjusted Random Index
BI Business Intelligence
BL British Library
BLO Bodleian Library in Oxford
CRISP-DM Cross Industry Standard Process for Data Mining
CSV Comma-Separated Values
D3 Data-Driven Documents
DH Digital Humanities
DM Data Mining
DSDAH Data Science for Digital Art History
DSRM Design Science Research
DSRM Design Science Research Methodology
DW Data Warehouse
EAJS European Association of Jewish Studies
ETL Extract, Transform and Load
FCA Formal Concept Analysis
HTML HyperText Markup Language
KDD Knowledge Discover in Databases
MSS Manuscript
NLI National Library of Israel
PCA Principal Component Analysis
RQ Research Question
xiv
Chapter 1. Introduction 1
Chapter 1
Introduction
The following dissertation proposes to address the lack of proper knowledge extraction tools by analytical means of Hebrew manuscripts. Manuscripts are the object of study of, primarily, experts in the field of Humanities, in particular from disciplines such as codicology and palaeography. Codicology can be referred to as the “archaeological study of the book” (Clark, 2014). It aims at tracing the manuscript’s history by registering its producer, materials, decorations and techniques used. As for Palaeography, it is the study of ancient handwriting which also characterizes a manuscript and can answer the questions of who, when, and where a given manuscript was written. The interdisciplinary nature of the technical examination of books means that when someone has a specific research question, an outside collaboration is almost invariably required (Clark, 2014).
Codicology and palaeography, similarly to other disciplines in the Humanities, have increasingly benefitted from the introduction of computational approaches, the development of new tools and new means of knowledge (Schreibman, Siemens, & Unsworth, 2004, 2008). One positive aspect of the application of computational methods and tools in the Humanities is overcoming the limitations of a manual analysis (Schreibman et al., 2004). However, this often requires the adaptation of methods and tools to new objects of study. The exploration of domain-specific problems in art history, for instance, has led to significant developments in conservation sciences, and tools that are normally used by physicists and chemists have been adapted by conservators, librarians and art historians (Clark, 2014). Another example is how relational databases have been used to store information about book prints, and how visualization tools can be employed to explore the data and analytics, to provide insights on data based on statistics (Schreibman et al., 2004).
This methodological shift has fostered a new field of inquiry, commonly known as Digital Humanities (DH), which can be broadly characterized by the application of computational approaches to Humanities research. A fundamental aspect of Digital Humanities is the creation of new artifacts, which are digitally born and require a rigorous
2 Chapter 1. Introduction
study and understanding (Schreibman et al., 2004). However, most of these approaches, as initially are envisaged, require considerable technical expertise, and therefore are normally unavailable to Humanities scholars. This often results in the collaboration with technologists who, in turn, have little training in the Humanities disciplines (Schreibman et al., 2004). Nevertheless, experts from both sides must have enough comprehension of available technologies and grasp of the research needs, in order to judge the suitability and possibilities of the resources to use (Schreibman et al., 2004). Still, there is an ongoing discussion as to what the extent humanists (and Digital Humanists) should be proficient in programming languages, in order to facilitate collaboration and understand the possibilities of research of certain tools (Svensson & Goldberg, 2015). Still, collaboration in the Digital Humanities is, currently, more important than ever, to the extent that Kaplan, (2015) questions if we should still distinguish between computer scientists and humanists, in Digital Humanities communities.
However, instead of the tailoring of tools for research questions, the analysis of artifacts is frequently conditioned by those that are available. Schreibman et al., (2004) identifies this concern with visualization tools, where instead of being used for presenting information, they are used to create information. This matter is of importance, for quantitative exploration is gaining importance within the analysis of digitized manuscripts. While codicologists can collect massive amounts of heterogeneous datasets, often accompanied by digitized in high-resolution images of the artifacts, they still lack efficient and intuitive means to explore data and answer domain-specific research questions. That is, a new approach is needed to enable codicologists and other book experts with the quantitative exploration of large data (Chandna, Rindone, Dachsbacher, & Stotzka, 2016). Moreover, the collation of high-quality metadata data is still considered a fundamental step in the process. Spending time and effort expended at the creation stage, recording high-quality metadata, is likely to save users from future problems, and will result in a well-formed digital object, which will survive for the long term (Schreibman et al., 2004).
As we have seen, Digital Humanities have been using computation for a long time, to store information, collecting data, and analyze it with the goal of creating knowledge. Nowadays, information is intrinsically scattered and yet available in an immediate way. Huge amounts of information are capable of being stored in any device and the computational power has increased a lot. As such, Big Data has, inevitably, become a trend to be considered. However, can Digital Humanities embrace Big Data? The
Chapter 1. Introduction 3
challenges are posed by the term itself, ‘Big’ Data. To what extent does this apply to the Digital Humanities and to the Humanities? Understanding what is meant by ‘Big’ Data in this context will help to address the concerns on how the concept can be adapted, and even become a structured research field (Kaplan, 2015). The definition of Big Data is not always clear, but it can be interpreted as the field dedicated to the analysis of large amounts of information, that most of times are available in different sources, without any linkage between them (Erl, Khattak, & Buhler, 2016). It is, therefore, necessary to link these sources and process them to verify existing studies, that made the same analysis manually, and encounter potential new patterns.
Given the growing importance of large and networked cultural datasets, it is likely that Big Data will become an integral part of the Digital Humanities field (Erl et al., 2016; Kaplan, 2015). The challenge is how to make these cultural datasets ready to be networked. Given the heterogeneity of sources and lack of common standards, the gathered data is often unstructured. That is, it lacks a pre-defined model, that could be easily disseminated among different disciplines (Clark, 2014). In the specific context of manuscripts, their digitisation has long been under way and there is already a large corpus available. However, they still often lack metadata regarding the categorization of each object, or the semantic linkage between the different collections. This means that the existing data is devoid of intuitive means to be explored or to let the researcher explore domain-specific research questions. Moreover, the descriptive nature of data gathered by ‘traditional’ humanists lacks consistency in the process of gathering and registering data. Making this data devoid of intuitive means to be used as analytical sources. This is a current obstacle between Digital Humanities and classical approaches, since computing methods are gradually causing profound transformations that call for a reconsideration of its fundamental concepts (Gold, 2012).
One of the main challenges of Big Data lies in capturing, storing, analyzing, sharing, searching, and visualizing data. Yet one of the major aspects of Big Data analysis is that we can find interesting patterns in huge data sets, even though the results of the analysis are usually raw numbers, and by those numbers alone it is difficult to interpret anything. But if those numbers are represented visually, then it becomes much easier for our brain to find meaningful patterns and take decision accordingly (Ali, Gupta, Nayak, & Lenka, 2016). Data insights through visualization within the Big Data trend is a hot topic and the problems are cross-domain rather than domain-specific. The huge amounts of data, plus the high dimensionality linkage in terms of features, represent a challenge in terms of
4 Chapter 1. Introduction
exploratory analysis (Xie, Chenna, He, Le, & Planteen, 2016). Data visualization has had a critical role within the Digital Humanities, not only for knowledge extraction, but also for sharing experiences and to detect outliers. However, the same issues apply, and handling such massive amounts of information and characteristics makes it harder to perform proper visualizations, if the dimensionality goes beyond three dimensions. Nonetheless, it should be considered an area of study on its own (Kaplan, 2015).
This data science field, which is intertwined with other important concepts also of growing importance, such as Big Data and data-driven decision making (Provost & Fawcett, 2013), is itself an area of expertise which includes techniques for data cleaning, structuring, storage and analysis/visualization. Furthermore, most of the techniques derive from statistics, algebra and mathematics, and there is still a lack of a unified theorem that could be applied to all kinds of data sources. As stated before, one of the concerns within Digital Humanities is the lack of proper expertise regarding computer science. If the domain-specific nature of data science is still a reality, how can we provide the proper tools for Humanities’ specific domains, such as codicology, and make proper quantitative analysis and exploration?
As stated before, the uncertainty of these domain-specific sources makes it hard to retrieve knowledge and properly communicate it. Therefore, Digital Humanities could benefit from the rising of visual analytics methods to fulfill that gap. Just as information visualization has changed our view on databases, the goal of Visual Analytics (VA) is to make our way of processing data and information transparent for an analytic discourse. The visualization of these processes will provide the means of communicating about them, instead of being left with the results (Keim et al., 2008). Visual Analytics can be seen as the science of analytical reasoning facilitated by visual representations of data. This implies the use of different types of analysis, data and a systematic research method to provide new and deeper insights about a certain problem or domain improving the knowledge extraction. Moreover, as a research field it combines the skills and knowledge from different disciplines and is deeply related to decision support and Business Intelligence (BI) systems.
1.1 Motivation and Research Context
In the Humanities/Digital Humanities, although still in an early stage, data visualization is increasingly shaping the field. Its potential is shown in the fostering of
Chapter 1. Introduction 5
new means of data exploration, often heterogeneous and uncertain in nature, and by opening new research questions across its various fields. Due to the heterogeneity in the high volume of the information collected by experts of different areas and its intrinsic uncertainty, as stated before, the data lacks standards and patterns, making the computing analysis harder to process, and restricting the exploration of manuscripts (Chandna et al., 2016). What can we do with huge amount of heterogeneous data? If we consider that each manuscript’s metadata is information, if that information is not properly structured, we cannot extract knowledge. This is because knowledge appears from the linkage between information sources, and from the patterns it might have. Furthermore, exploration and visualization are critical to extract knowledge. Challenges, therefore, are still seen at a methodological level, particularly in the emphasis on quantitative analysis (Graham, 2017), but also in terms of the acceptance of results by the experts (although gradually less so). Some arguments must be considered, particularly the distinction that ‘while the scientist’s methods can be paraphrased without any loss, in the Humanities the description itself is understood to be part of the method’ (Graham, 2017). The inter- and multidisciplinary nature of Digital Humanities is, therefore, the perfect background for a collaboration between BI and VA with Humanities disciplines.
Together with this dissertation, the project CodicoDaViz was created, by establishing a partnership between ISCTE-IUL and the University of Münster, in Germany.
CodicoDaViz was developed with the goal of applying data visualization techniques to
the field of codicology. Furthermore, this dissertation discusses the implementation of all the technical artifacts of the CodicoDaViz project. The initial motivation of this project concerns a specific research need regarding the transition from manuscript format to print, of books in Hebrew script and type. The substantial amounts of metadata already available regarding the material aspects of books, but also the heterogeneity and dispersion of availabledata, opened up the possibility of adopting data visualization techniques. Therefore, a central goal of this project is to categorize, clean, analyze, and visualize the raw metadata that already exists in relevant data sources. This research project also focuses on the implementation of an analytical environment that can be used by Humanities experts to explore the existent information. Leveraging experts’ capabilities from the analysis of a single historical object at each time to a bigger picture of, perhaps, cultural insights of several manuscripts.
6 Chapter 1. Introduction
1.2 Research Methodology
The proposed approach uses the Design Science Research Methodology (DSRM) principles proposed by (Hevner & Chatterjee, 2010) as seen in Figure 1.1 which helps to define the scope of the proposed work. To contextualize, as stated in the Environment from Figure 1.1, the domain of this dissertation is within the Humanities field, more specifically, Codicology and Palaeography of Hebrew Manuscripts. Therefore, it is intended to help experts of this area with their studies providing a proper exploration model (knowledge base) solving the uncertainty within the currently available data sources.
Figure 1.1 - Design science research cycles. (Retrieved from (Hevner & Chatterjee, 2010), p. 16)
We will focus on the design, development, demonstration and evaluation of artifacts using the nominal process sequence proposed by Peffers, Tuunanen, Rothenberger, & Chatterjee, (2007) as displayed in Figure 1.2. These artifacts are expected to, when applied, help us achieve a solution for our perceived problem.
Figure 1.2 - Design Science Research Methodology in nominal process sequence form. (Retrieved from
Chapter 1. Introduction 7
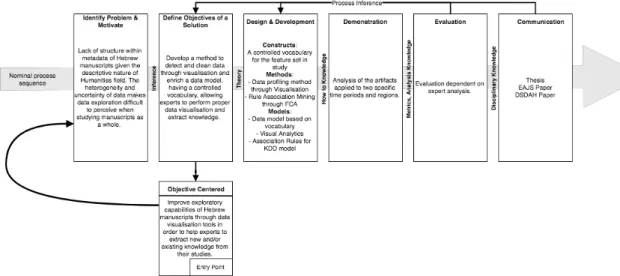
Hevner & Chatterjee, (2010) maps the seven DSRM guidelines into a checklist grouped by Relevance, Design and Rigor cycles. In Figure 1.3 below we describe and schematize these questions in the form of a nominal process sequence to provide an easier understanding of the proposed artifacts, solutions, audience and planned entry points.
Figure 1.3 - DSRM adopted in this thesis. (Adapted from Figure 1.2)
We have an objective centered solution entry point since our research started based on the goal of, through visual analytics, extract knowledge to confirm existing studies or to raise new evidences.
Figure 1.4 - CRISP-DM reference model. (Retrieved from (Chapman et al., 2000), p. 10)
Additionally, in the design and development phase, the Big Data analytics lifecycle proposed by (Erl et al., 2016) is used to structure and plan the implementation phase. The Big Data analytics lifecycle, as proposed, has nine stages, which are very similar to the flow of CRISP-DM from Figure 1.4 and may be seen as a higher order model which includes data visualization, acquisition and extraction (Erl et al., 2016).
8 Chapter 1. Introduction
1.2.1 Identify Problem and Motivate
Currently, experts from the Humanities analyze each manuscript one by one tracing its characteristics and attributes manually. The descriptive nature of this field of study often leads to the lack of a controlled vocabulary that makes quantitative analysis impossible to achieve. Consequently, retrieving knowledge from a set of manuscripts describing trends and cultural patterns is very difficult to achieve. Moreover, the heterogeneity and uncertainty within data (caused by the lack of a proper data collecting standard) makes the application of computational methods rising within Digital Humanities, as well as linking sources from interdisciplinary study groups, nearly impossible to accomplish.
1.2.2 Define Objectives for Solution
Within the Codicological studies, more specifically the Hebrew manuscripts around the 15th century, an approach is proposed to address the problematic of heterogeneous
metadata and inherent uncertainty providing a toolset to extract, process and store data from several sources into a structured model capable of storing this information in such way it is able of being explored and properly visualized, giving the experts a bigger picture of the available collections. This multidimensional model aims to reduce the uncertainty and heterogeneous concerns by storing the processed data with a controlled vocabulary that can be explored and visualized. To achieve this, a method for data profiling through the use of visualization is proposed, in order to achieve a controlled vocabulary.
Data visualization with exploratory analysis should, afterwards, be available online for experts to easily use. Being able to computationally analyze the entire corpus of manuscripts to discover cultural trends, by tracing behaviors along the centuries through visual analytics could provide new insights that could verify known assumptions as well as raise new ones. All of this could be presented in a richer way across study groups within the Humanities, since scholars would be able to showcase insights to their colleagues.
However the amount of metadata available even if we categorize and standardize it, the feature space is too big to manually infer meaningful visualizations and/or relations. Without previous input in terms of key metrics and/or indicators, the experts should have available a tool that could suggest associations for further exploration and analysis of
Chapter 1. Introduction 9
specific feature relations. To help the exploratory and analytical analysis, concept analysis and association methods are used, aiming to find trends and relevant patterns and/or associations in data that would suggest visualizations of most relevant features.
Based on the proposed approach, during the present dissertation, we will try to answer the following questions:
RQ1. Is it possible to easily harvest data from several sources and build a common data model to hold the information for codicological analysis of Hebrew books?
RQ2. Does the data model enable the discovery of new and relevant patterns to art history researchers?
1.2.3 Design and Development
To achieve our goals, we will create six artifacts. Each artifact addresses a part of our problem:
1. (Construct) A controlled vocabulary of specific terms based on relevant features – The goal of this artifact is to address the uncertainty and lack of structure that currently exists in order to build a categorized corpus capable of being explored.
2. (Method) A methodology for data cleaning and integration – design a set of rules and standards to clean the data based on the built vocabulary doing several iterations through data visualization to spot inconsistencies within the acquired corpus.
3. (Method) Rule Association Mining through Concept Analysis – since we don’t have requirements in terms of indicators to perform visualizations, it is hard to foresee which visualizations, which analysis or which dashboards are relevant to answer the expert’s questions. Moreover, the feature space of available metadata within each manuscript makes it impossible to achieve, by manually designing meaningful visualizations. The proposed method applies a mathematical algorithm called Formal Concept Analysis to the corpus to build a context tree of concepts.
4. (Model) A multidimensional model based on vocabulary – A model to store the data standardized with the applied methods and based on the designed vocabulary in order to be available for analytical explorations.
10 Chapter 1. Introduction
5. (Model) Visual Analytics – Build templates that could be applied to different collections of manuscripts sharing the same vocabulary to allow experts to have a richer perception and insights through visualization that could raise new or verify existing knowledge.
6. (Model) Association Rules for Knowledge Discovery – from the method of applying Concept Analysis this model stores the association rules in such way that experts can have insights of data relations and even enhance the visualization templates with new insights.
1.2.4 Demonstration
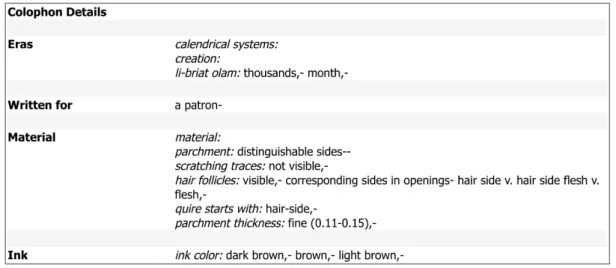
To demonstrate our artifacts, our initial corpus was taken from the online platform Sfardata (Beit-Arié, 2017) and afterwards enriched through the method of data profiling by using personal catalogues. This platform “locates all the medieval codices written in
the Hebrew script, which contained explicit production dates or at least scribe names; to study and document all their visual and measurable material features and scribal practices in situ, i.e. in the libraries in which they were kept; and classify these features and practices in order to expose a historical typology of the hand-produced Hebrew book and provide users of Hebrew manuscripts with a tool for identifying the production region and assessing the period of the studied manuscripts. Indeed, since the initiation of the project, almost all the dated manuscripts that were located have been studied and documented in some two hundred and fifty libraries and private collections”1.
We will use two different datasets, all of them produced in the Sephardi region, from different periods. Our initial dataset was retrieved from the codicological descriptions of almost all dated Hebrew manuscripts that have been collected and stored in Sfardata (Beit-Arié, 2017) between periods 1400 and 1500 for Sephardi scripts. This dataset was the baseline of work where we applied and built the methodology of data cleaning and visualization. The second dataset increases the period from 900 to 1400 and from 1500 to 1540 were used to evaluate the effectiveness of the data cleaning process through visualization measured in terms of effort and to apply association rule mining and concept analysis to extract knowledge and enhance our visualizations through dashboards. Moreover, experts are expected to include printed books from this extended period for the same region.
Chapter 1. Introduction 11
1.2.5 Evaluation
The evaluation of our proposed framework is still undergoing and will not be completed in the timeframe of this dissertation. However, in the context of this research work, an assessment will be made by our expert within the Humanities to see if the proposed work can enhance the experience of knowledge extraction through visualization.
1.2.6 Communication
The communication of this research was done through the publication of two papers within the Digital Humanities field:
• Marques de Matos, D., Pateiro, T. & Cardoso, E. (2018). Crossing the Line: Data visualization of Codicological Data of Hebrew Manuscripts and Incunabula. 11th Congress of the European Association of Jewish Studies
(EAJS, 2018)
• Pateiro, T., Cardoso, E. & Marques de Matos, D. (2018). Visual analytics of Hebrew manuscripts codicological metadata. In 1st KDD Workshop on Data Science for Digital Art History: tackling big data Challenges, Algorithms, and Systems, organized in the ACM SIGKDD 2018. London
The first publication was presented at the conference from the European Association of Jewish Studies (EAJS), where we demonstrated how Humanities experts and computer scientists could work together to provide richer visualizations of Hebrew manuscripts collections. The second publication is a full paper presented at the Workshop of Data Science for Digital Art History (DSDAH), organized as part of the ACM KDD2018 conference. The proceedings of this workshop will be published as a special issue at the International Journal of Digital Art History (due in November 2018). This paper presents our methodology of data preparation and discusses how visualization can provide richer insights and even spot incoherencies during the data cleaning process.
1.3 Document Structure
This document is structured as follows:
• Chapter 2 presents the Related Work, introducing concepts as well as similar work on other DH fields and how they could help to address our problem;
12 Chapter 1. Introduction
• Chapter 3 presents our Case Study and the Big Data Lifecycle method used to describe how the problem was tackled and how the DSRM artifacts were built; • Chapter 4 applies the Visual Analytics templates in the perspective of Humanities experts to demonstrate the impact of these tools in the story telling of the data;
• Chapter 5 summarizes our research made so far, the limitations raised and how we intend to address them in future work.
Chapter 2. Related Work 13
Chapter 2
Related Work
In this chapter we will present some of the research about the subjects that will be needed for the Design and Development chapter (Chapter 3). The research includes some works within the Digital Humanities field using computational methods for knowledge discovery as well as data structuring which we believe will serve as an input, alongside with other gained knowledge, to the next research steps.
Similar to other fields, digital approaches to Hebrew manuscripts have focused primarily on text, i.e., authorship identification, linguistic patterns, digital editions, text encoding, and so on (Gold & Klein, 2016). The most relevant exception is the work on automatic identification of join fragments developed by the Genizah projects (Wolf, Potikha, Dershowitz, Shweka, & Choueka, 2011). In the context of Hebrew books, the main collections of manuscripts such as those at the National Library of Israel (NLI), British Library (BL), or the Bodleian Library in Oxford, (BLO) to name but a few, have made a substantial part of their materials available online. These and many other collections around the world have made their materials available in an online platform for digital access to manuscripts around the world, known as Ktiv (NLI, n.d.), hosted by the NLI. However, metadata provided by most collections does not go beyond catalogue descriptions, often lacking codicological metadata. In contrast, the materiality of Hebrew manuscripts is thoroughly described and available in a database known as Sfardata (Beit-Arié, 2017; Sfardata, n.d.). In many senses, Sfardata (Beit-(Beit-Arié, 2017; Sfardata, n.d.) is a unique tool. It has no counterpart in other book cultures, it hosts substantial amounts of descriptions of dated Hebrew manuscripts until 1540, and has drawn methodologies with impact in material culture studies (Bausi et al., 2015). That being said, these tools still lack intuitive means to explore domain-specific research questions dealing with codicological metadata.
To some extent, this can be understood by the very nature of codicological data, which is intrinsically descriptive and heterogenous. In other words, it can be quantitative (measurements), and simultaneously subjective and qualitative (for instance, in terms of palaeographical descriptions). Particularly the visualization of uncertainty is still in
14 Chapter 2. Related Work
discussion, and a much pertinent one within the Humanities (Jänicke & Wrisley, 2012). Although codicological metadata still lacks a systematic set of rules, other adjacent fields such as palaeography are already setting a broad frame of work where Big Data can be processed by computers, but experts are as necessary, particularly to deal with ambiguous and complex datasets. As such, the process flow is semi-automatic, interactive and iterative, and results can be re-used (Hassner, Rehbein, Stokes, & Wolf, 2013). The potentiality of quantitative analysis and/or exploration of codicological units can be seen in platforms such as eCodicology (Chandna et al., 2016) for medieval manuscripts where we can see an effort to solve the heterogeneity and uncertainty using computational methods and visualization tools. Similar to companies, the Humanities face the same challenges when talking about Big Data. Although the volume might not be the same, the variety and veracity are key topics to consider when working with these inter-disciplinary collections of metadata.
Figure 2.5 Four V's of Big Data. Taken from IBM (2018)2
The challenges, as seen in Figure 2.5, are clearly the same given the descriptive and uncertain nature of the available data from Hebrew manuscripts. The variety can be seen as the number of collections available, the dispersion of information, from Sfardata to Ktiv, and the problematic veracity of information, given the collaborative nature lacking a common method (Graham, 2017).
Chapter 2. Related Work 15
Visual Analytics can play an important role when talking about veracity, complementing the Big Data Analytics nowadays. The driver for this is increasingly higher volume and, most of all, complexity of the data (L. Zhang, Stoffe, & Behrisch, 2012).
Visual analytics is the science of analytical reasoning facilitated by visual representations of data. This implies the use of different types of analysis, data and a systematic research method to provide new and deeper insights about a certain problem or domain. Visual Analytics is a recent research area that combines the skills and knowledge from different disciplines and is deeply related to decision support and business intelligence systems. It has been applied to a diverse set of contexts, for instance, in precision agriculture to improve decisions about crops (Wachowiak, Walters, Kovacs, Wachowiak-Smolkov, & James, 2017), in healthcare to compare drug information enabling a faster integration into practice of new drugs (Lamy et al., 2017), or in software engineering (Staron, Sahraoui, & Telea, 2018). In the Humanities, although still in its early stages, data visualization is increasingly marking the field. Its potential is shown in the fostering of new means of data exploration, often heterogeneous in nature, and by opening up new research questions across its various fields. Challenges are still seen at a methodological level, particularly in the emphasis on quantitative analysis (Graham, 2017), but also as in terms of acceptance of results by the experts (although gradually less so). Some arguments must be taken into account, particularly the distinction that “while the scientist’s methods can be paraphrased without any loss, in the Humanities the description itself is understood to be part of the method” (Graham, 2017). If “mapping data to visual representations has been used for centuries to reveal patterns, to communicate complex ideas, and to tell stories” (Bailey & Pregill, 2014), current tools bring to the table this new aspect of interaction and iteration with the experts. Whilst visualization can be a discovery tool, it is primarily a means to refine arguments and illustrate conclusions already drawn (Wulfman, 2014). That is, graphic representations such as charts are not the actual data but an interpretation of it, to answer a specific research query, even if visualization allows complex findings to be presented in an informative and engaging way (Radich, 2017). For instance, radial trees and parallel coordinates seem to have a wide use when exploring high dimensional data (Hinrichs, Forlini, & Moynihan, 2016). This is a useful solution when data is categorical, but standard plotting based on numerical axis are harder to use in this case. Chandna et al., (2016) propose a framework for visual analysis of medieval manuscripts, where the system uses image segmentation and feature extraction from digitised manuscripts to
16 Chapter 2. Related Work
create measurements that are combined with other metadata to visualize the information in a radial tree or parallel coordinate plot.
Ali et al., (2016), explore commercial solutions for Big Data visualization such as Tableau, Microsoft Power BI, and propose the usage of link/network analysis techniques as useful visualization tools for high dimensional data (i.e., a dataset with a high number of features).
These proposed techniques (i.e., link/network analysis) still require manual tuning and do not always allow the development of a storytelling type of narrative. Communicating results through data visualization and engaging with an audience should not be overlooked. Windhager et al., (2018), try to go beyond the traditional approaches to visualization on grid-based interfaces, and instead explore them as complex and comprehensive information spaces by the means of interactive visualizations in the scope of cultural heritage collections.
The remainder of this chapter is organized in the following sections:
• Section 2.1 introduces the Big Data Lifecycle and how it relates to the CRISP-DM model;
• Section 2.2 covers the major task of data cleaning and preparation for source integration;
• Section 2.3 describes some Data Visualization techniques for visualizing high dimensional sources;
• Section 2.4 introduces knowledge discover and some computational techniques for pattern analysis.
2.1 Big Data Lifecycle
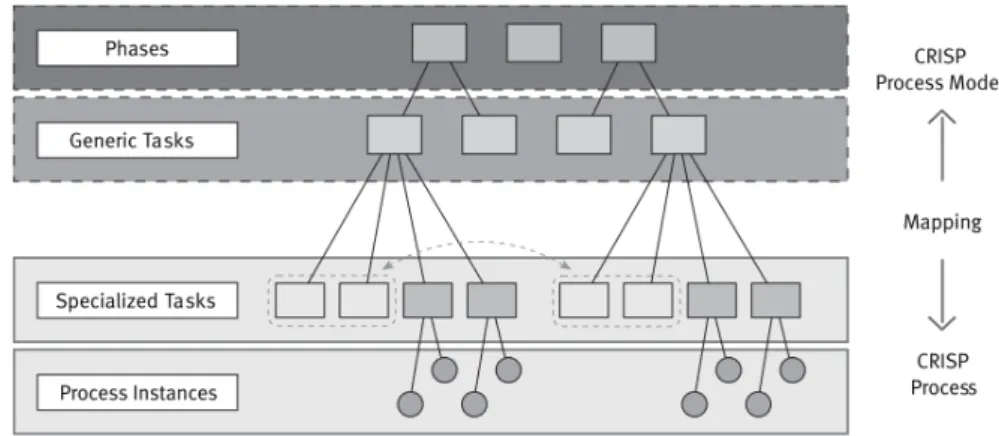
The CRISP-DM (Cross Industry Standard Process for Data Mining) methodology is described in terms of a hierarchical process model, consisting of sets of tasks described at four levels of abstraction (from general to specific, as in Figure 2.6): phase, generic task, specialized task, and process instance. As a standard process model it was created to address data mining concerns (Chapman et al., 2000).
Chapter 2. Related Work 17
Figure 2.6 - Four level breakdown of the CRISP-DM methodology. Retrieved from (Chapman et al.,
2000), p. 6
The data mining context drives mapping between the generic and the specialized level in CRISP-DM. Currently, we distinguish between four different dimensions of data mining contexts as seen in Figure 2.7.
Figure 2.7 - Dimensions of data mining contexts and examples. Taken from (Chapman et al., 2000), p.7
With this model we can foresee the contexts that will need to be addressed in future work, namely dependency analysis, missing values, and decision trees (association rules). Making the bridge from this method, as already shown in Figure 1.4, to Big Data Lifecycle is possible and makes a strategic approach to the problem, where the data scientist is required to follow a step-by-step approach to guarantee the data is accurate providing truthful insights, meaning, achieving veracity (Berwind, Bornschlegl, Kaufmann, & Hemmje, 2016), as seen in Figure 2.8.
Big Data analysis differs from traditional data analysis primarily due to the volume, velocity and variety characteristics of the data being processes. To address the distinct requirements for performing analysis on Big Data, a step-by-step methodology is needed to organize the activities and tasks involved with acquiring, processing, analyzing and repurposing data (Erl et al., 2016).
18 Chapter 2. Related Work
Figure 2.8 - CRISP4BigData Reference Model Version 1.0 from Kaufman 2016. Taken from (Berwind et
al., 2016), p.5
2.2 Data Cleaning and Preparation
Data can be unstructured without any indication of validity, making the data cleaning one of the most important steps in the lifecycle since it can provide wrong decisions (Erl et al., 2016). It is estimated that due to the importance of this step, it should usually take 80 percent of the time invested in any data project (S. Zhang, Zhang, & Yang, 2003).
Several techniques exist to address the problems regarding this critical stage. However, a good context knowledge is of utmost importance to determine which techniques to apply. Moreover, as seen in Figure 2.8, data understanding plays an important role in such way that the analyst should look at the features and correct the values (Abbot, 2004). Variable Cleaning (transforming variables to standardize the vocabulary) and Feature Creation (adding value to our dataset) are some of the techniques available (Abbot, 2004).
2.2.1 Missing Values
One of the most common concerns when handling unstructured sources is the presence missing values. Taking the Humanities as example, its descriptive and its collaborative nature may have multiple representations for the same value, as we will demonstrate in section 3.3.4 (Chapter 3). Moreover, the presence of null values and or unknown values is a possibility.
Abbot, (2004) provides several approaches to deal with missing values, such as: (1) deletion, which is the simplest solution. A previous knowledge of the scope is required in order to decide whether or not to delete entire columns or entire rows, (2) mean and
Chapter 2. Related Work 19
median imputation, where we analyze the mean/median of a feature and based on these statistical calculations we perform the filling of the calculated value, (3) imputation with a constant, where we assign a specific value as a constant, for example, assuming “unknown” as a valid and analyzable value, (4) business specific rules imputations, where an empty cell might be caused for a specific value in another feature.
2.3 Data Visualization of high dimensional sources
Visualizing high-dimensional data is a challenging process, and the visualization of uncertainty is still a topic for discussion within the community (Jänicke & Wrisley, 2012). Visualization allows us to take complex findings and present them in a way that is informative and engaging (Radich, 2017). However, it becomes more complex on larger amounts of information, and as it grows the effective communication must remain easy to the users (Radich, 2017). Not only for the users, understanding the data at this stage of the lifecycle through data visualization might help to have a glance of the state of those sources (Keim et al., 2008).
One of the biggest challenges in data visualization is to find general representations of data that can display the multivariate structure of more than two variables. Several graphic types like mosaic plots or parallel coordinate plots, and the grand tour, have been developed over the course of the last three decades. But all of them lack interactivity, the ability to engage the user in such way slicing the information should be easy and available (Theus, Chen, & Unwin, 2008).
Among the most classical plots, Theus et al., (2008) identifies the ones that are more useful (although lacking interactivity):
1. Mosaic Plots (purely for categorical data);
2. Parallel Coordinate Plots (only for continuous data);
3. Projection Pursuit and Grand Tour (only for continuous data); 4. Trellis Displays (for mixed scales);
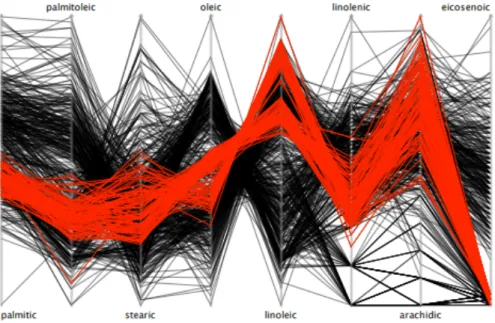
However, as show in Figure 2.9, for example the parallel coordinate plots, the problem of over plotting is much more serious as it is with scatterplots.
20 Chapter 2. Related Work
Figure 2.9 - Example of over plotting through parallel coordinates, taken from (Theus et al., 2008)
Since features are only visible at adjacent axes, a flexible permutation mechanism is needed to get a comprehensive view on all data (Theus et al., 2008).
Decision support systems are often built on top on known indicators and metrics, however, when no previous input is well defined, building dashboards with random features might cause noise instead of building understandable knowledge.
Users should be able, therefore, to explore data associations and have quick insights. Data-Driven Documents (D3) is a novel representation approach to visualization for the web. Rather than hide the underlying scene graph within a toolkit-specific abstraction, D3 enables direct inspection and manipulation (Bostock, Ogievetsky, & Heer, 2011). Allowing these designed tools to interactively engage the user to explore data associations, as seen in Figure 2.10 which could help finding patterns in the data.
Figure 2.10 Example of Geographic D3 and Radial Tree in D3 for content exploration. Taken from
Chapter 2. Related Work 21
2.4 Knowledge Extraction
The history of Data Mining (DM) and Knowledge Discovery (KD) is not much different. In the early 1990s, when the KDD (Knowledge Discovery in Databases) processing term was first coined, there was a rush to develop DM algorithms that were capable of solving all the problems of searching for knowledge in data. Apart from developing algorithms, tools were also developed to simplify the application of DM algorithms. From the viewpoint of DM and KD process models, the year 2000 marked the most important milestone: DM was published (Chapman et al., 2000). CRISP-DM is the most used methodology for developing CRISP-DM and KD projects (Marbán, Mariscal, & Segovi, 2009).
KDD is defined as the non-trivial extraction of valid, implicit, potentially useful and ultimately understandable information in large databases (Han, Kamber, & Pei, 2011)
Knowledge based support as addressed before in Figure 2.5 from Chapter 2 Related Work (page 13) is the ability to make decisions based on the gained knowledge, whether from visual analytics tools, or from automatic computational methods such as pattern analysis and data mining. Knowledge, unlike information, is useful, whereas information is just refined data. Extracting knowledge enables the observer to clearly understand the outcome and make decisions on top of it.
Most of the times, the researcher might not have the necessary knowledge to know for what and for whom he wants to produce a specific set of dashboards over specific set of features (Keim et al., 2008). Having machine learning or data mining tools to find patterns and associations without having such input might become useful to extract unknown information. Machine learning and data mining are research areas of computer science whose quick development is due to the advances in data analysis research, growth in the database industry, and the resulting market needs for methods that are capable of extracting valuable knowledge from large data stores (Fürnkranz, Gamberger, & Lavrač, 2012). Moreover, the complexity of the problem is exponential in the size of all of the possible combinations within the dataset feature/value relation, and since this relation has to be scanned several times during the process, efficient algorithms for mining frequent item sets are required (Lakhal & Stumme, 2005).
22 Chapter 2. Related Work
2.4.1 Data Mining and Unsupervised Learning Algorithms
Unsupervised learning algorithms concerns the analysis of unclassified examples. Moreover, it is used when the goal is not to predict but yet to find relationships within the unlabeled dataset (Fürnkranz et al., 2012). Data mining methods are typically unsupervised. They are used to induce interesting patterns (such as association rules) from unlabeled data. The induced patterns are useful in exploratory data analysis (Fürnkranz et al., 2012).
Frequent itemset and pattern mining leads to the discovery of associations and correlations among items in large transactional or relational data sets. With massive amounts of data continuously being collected and stored, many industries are becoming interested in mining such patterns from their databases. The discovery of interesting correlation relationships among huge amounts of business transaction records can help in many business decision-making processes such as catalog design, cross-marketing, and customer shopping behavior analysis (Han et al., 2011).
2.4.1.1 K-Means Algorithm
K-Means are considered as one of the simplest algorithms in machine learning to solve the clustering problem, in which the number of clusters k is chosen in advance, after which the goal is to partition the inputs into sets in !", … , !% a way that minimizes the total sum of squared distances from each point to the mean of its assigned cluster. In this algorithm the number of clusters are predefined as 'K', which refers to the number of centroids. The algorithm iteratively calculates the closeness between points to each centroid and as a result compact groups of items are formed as clusters. K-Means uses a squared error function as the objective function, and it minimizes the squared error distance between items and chosen centroid (Grus, 2015). Partition based algorithms are iterative and use a distance formula to measure similarity between items (Bhargav & Pawar, 2016).
The accuracy of a clustering algorithm is dependent of the shape of the produced cluster in space. It is known that K-Means only handles circular convex shapes and performs what is called hard clustering. This type of clustering indicates that one point in space either belongs or not to a cluster. Hierarchical clustering is still a hard-clustering algorithm but allows non-convex shapes (Bhargav & Pawar, 2016).
Chapter 2. Related Work 23 2.4.1.2 Hierarchical Clustering
An alternative approach to clustering is to “grow” clusters from the bottom up. At the end, we will have one giant cluster containing all the inputs. If we keep track of the merge order, we can recreate any number of clusters by unmerging. For example, if we want three clusters, we can just undo the last two merges. Unlike K-Means, Hierarchical Clustering requires a measure of similarity between groups of data points (Grus, 2015).
In Hierarchical clustering, data is organized according to hierarchy of proximity which are generated by the intermediate nodes. As such, the entire dataset can be represented by a dendrogram in which the leaf nodes represent the data itself. Like a tree, a data-class can have a subclass and this division can continue to the leaves.
Hierarchical Clustering strategies can be of two types (Bhargav & Pawar, 2016) , which in turn might be suitable for the previously proposed visualizations:
• Agglomerative (“bottom-up”) – each row starts as a cluster and then pairs of clusters are merged;
• Divisive (“top-down”) – every row starts as one cluster and then splits are performed in a recursive way.
2.4.1.3 Association Rule Mining
Association rule learning is an unsupervised learning method, with no class labels assigned to the examples (Fürnkranz et al., 2012). It finds all the rules existing in the database that satisfy some minimum support and minimum confidence constraints. For association rule mining, the target of mining is not predetermined (Liu, Hsu, & Ma, 1998). The problem of association rule mining has first been stated in 1993. Five years later, several research groups discovered that this problem has a strong connection to Formal Concept Analysis (FCA) (Lakhal & Stumme, 2005).
This type of algorithm is often used for recommendation systems, from e-commerce platforms to marketing segmentation (Lin, Alvarez, & Ruiz, 2002). Cases like “If a
customer buys bread, he’s 70% likely of buying milk.”3 might help researchers finding
unlikely association within data.
3 Example taken from
24 Chapter 2. Related Work
2.4.2 Formal Concept Analysis
Since determining the frequent item sets is the computationally most expensive part, most research has focused on this aspect. Most algorithms follow the way of the well-known Apriori algorithm (Han et al., 2011). Other algorithms are based on the extraction of maximal frequent item sets. They combine a level wise bottom-up traversal with a top-down traversal in order to quickly find the maximal frequent item sets (Han et al., 2011). However, all of these algorithms have to determine the supports of all frequent item sets becoming computationally expensive. As such, some infrequent item sets could be discarded from these computation to increase performance (Han et al., 2011).
Using basic results from Formal Concept Analysis (FCA), it is possible to derive a concept hierarchy (ontologies) from an item set of object and their attributes. The use of FCA allows not only an efficient computation, but also to drastically reduce the number of rules that have to be presented to the user, without any information loss (Han et al., 2011). Formal concept analysis can be considered as one of the best formalization of the Data Mining field (Buzmakov, 2015).
Formally, FCA is a method based on mathematical theories oriented at applications in knowledge representation, knowledge acquisition, data analysis and visualization (known as conceptual clustering) (Obiedkov, 2018) where each concept intent is exactly the largest itemset of the equivalence class of & it belongs to. For any itemset ' ⊆ *, the concept intent of its equivalence class is the set '′′. The concept intents can hence be considered as ‘normal forms’ of the (frequent) item sets. In particular, the concept lattice4
contains all information to derive the support of all (frequent) item sets (Han et al., 2011). Formal Concept Analysis operates by encoding the data set transforming the feature space as true or false values where the categorical values are transposed to new features using the Feature Creation method proposed by (Abbot, 2004) and presented in section 2.2.
4 A concept lattice is an abstract structure as part of order theory and algebra. It can be seen as an ordered
Chapter 2. Related Work 25
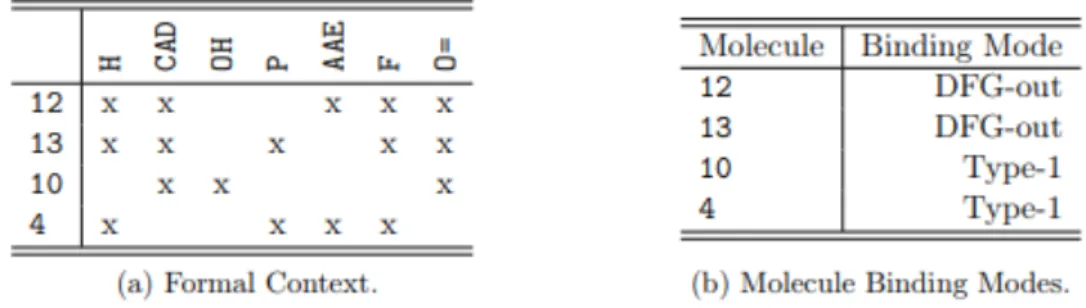
Figure 2.11 - Set of formal concepts using binary encoding of dataset. Example taken from (Buzmakov,
2015), p. 27
As seen in Figure 2.11, the formal context transposes the categorical values for each preselected object (in the present case, the molecule) to new features and assigns a ‘X’ if that category is present or not for the given object.
A formal concept corresponds to a pair of maximal sets of objects and attributes, i.e. it is not possible to add an object or an attribute to the concept without violating the maximality property (Buzmakov, 2015).
Figure 2.12 - A set of formal concepts w.r.t context on Figure 2.11. Example taken from (Buzmakov,
2015), p. 27
Figure 2.12 shows all concepts that can be found for the context. Formal concepts can be partially ordered with respect to the extent inclusion (dually, intent inclusion). For example, ({13}; {234, 5 =, 57}) ≤ ({13,10,12}, {234, 5 =}). This partial order of concepts is shown in Figure 1.2. The number of formal concepts for a given context can be exponential with respect to the cardinality of the set of objects or the set of attributes. Moreover, even the problem of computing the size of the concept lattice is #P-complete5
(Buzmakov, 2015).
26 Chapter 2. Related Work
Figure 2.13 - The FCA-lattice for the context on Figure 2.12. Example taken from (Buzmakov, 2015), p. 28
This network-based representation, as seen in Figure 2.13, demonstrate a potential use for richer visualizations and exploration of associations and patterns. In fact, in the Humanities fields there are already applications of FCA to Museum Collections (Cole, Fritjov, Ducrou, Eklund, & Wray, 2018).
FCA can, therefore, be used to think with the data as it allows the researchers to explore the feature space following a philosophical logic of human thought (Cole et al., 2018). Cole et al., (2018), starts the process by defining the scope of the phenomenon, the objects of study and their features by asking the following questions:
• What is the scope of the work? The entire collection available or a subset
based on specific categories or periods?
• What are the objects in study? Should we consider all the available
metadata from all fields around an object or just a subset of them?
• What characteristics of the objects do we aim to study? And how do we
define and extract those characteristics? What features of our objects interest us?.
Chapter 2. Related Work 27
Figure 2.14 - Central pane showing the current concept: intent as thumb-nails. Example taken from (Cole
et al., 2018)
Within Formal Concept Analysis, we define the scope of our objects and their features as attributes. This conceptual approach allows a semantic analysis of the data set which, consequently, leads to better information retrieval using visualization tools as seen in Figure 2.14. The obtained conceptual graph, more than allowing an exploratory visualization, allows the researchers to extract ontologies based on associative rules (as mentioned in section 2.4.1.3 Association Rule Mining) and which we can verify in Figure 2.15.
Figure 2.15 - Example of associative rules in natural language from "A Place of Art". Example taken from (Cole et al., 2018)
A similar approach could be taken for the Hebrew manuscripts, mapping such questions to our work to define the scope. Moreover, retrieving ontologies could leverage the semantical analysis made by the experts. As we will describe in the next sections, the use of this concept clustering technique was applied to the Hebrew manuscript in order to extract relevant ontologies and to visualize such hierarchies.
28 Chapter 3. Design and Development
Chapter 3
Design and Development
In this chapter we will describe the design and development of the built artifacts and their use. The case study will be a subset of Sephardi (individual handwriting) Hebrew manuscripts, between year ≈ 900 and 1540. The rationale taken for these specific periods will be described in the next sections, where we describe our case study. Furthermore, this was the initial set of study that will support the development of our environment as well as to assess its effectiveness. This chapter is organized as follows:
• Section 3.1 introduces the technologies and programming languages used within this research;
• Section 3.2 briefly describes the scope of the collected data retrieved from Sfardata (Beit-Arié, 2017) and address initial concerns of the data;
• Section 3.3 presents the proposed framework, CodicoDaViz, along with its artifacts built to achieve the goals of this research following Big Data Lifecycle;
• Section 3.4, although still part of CodicoDaViz, presents the visualization artifacts as templates to be used by the experts and how this research modelled them;
• Section 3.5, addressing the high dimensionality and categorical nature of our data, this section explores the approaches taken to perform knowledge retrieving using both unsupervised learning and data mining techniques to enrich the visualizations.
3.1 Development Languages
The nature and scope of this thesis inserted within the Digital Humanities field led us to use tools from the Data Science field. No unified language could be found that would fit all the needs, therefore, several languages and tools were used. For data extraction and