doi: 10.4114/intartif.vol20iss59pp32-41
ISSN: 1137-3601 (print), 1988-3064 (on-line) ©IBERAMIA and the authors
INTELIGENCIA ARTIFICIAL
http://journal.iberamia.org/
Mining Users Mobility at Public Transportation
Nuno Baeta
1, Agnelo Fernandes
1, João Ferreira
2,31
ADEETC at ISEL, Lisbon, Portugal
njbaeta@gmail.com;
agnelo.fernandes@pandora.com.pt
;
2
Instituto Universitário de Lisboa (ISCTE-IUL), ISTAR-IUL, Lisboa, Portugal
3Centro ALGORITMI, University of Minho, 4800-058, Guimarães, Portugal
jcafa@iscte.pt
Abstract In this research work we propose a new approach to estimate the number of passengers in a public transportation and determinate the users’ route path based on a passive approach without user intervention. The method is based on the probe requests of users mobile device through the collected data in wireless access point. This data is manipulated to extract the information about the numbers of users with mobile devices and track their route path and time. This data can be manipulated to extract useful knowledge related with users’ habits at public transportation and extract user mobility patterns.
Keywords: Wi-Fi, Mobile Device, Tracking, GPS, Artificial Intelligent, Knowledge.
1 Introduction
With the proliferation of mobile devices among the population, wireless sensor networks have recently received a lot of attention due to a diversity of applications such as objects or persons tracking. Access Points (AP) allows passive tracking and this collected big data can be mined to extract useful knowledge about persons tracking movements. Location-Based Services (LBS) is increasing the number of publication and available related services [1] and the use of Wi-Fi network of mobile devices is increasing rapidly. More and more public places are offering (free) Wi-Fi, which enables people to use their location sensitive smartphones and several business opportunities raises with this reality [2]. One of these success applications is the track of shoppers in a shopping centre, which shops they visited, through their phones. They only need the Wi-Fi turned on, which are instantly picked by the system, which logs the unique ID of the phone. These unique IDs to phones are similar to fingerprints. It is common policy at commercial areas for users to use free Wi-Fi, they are asked to hand over information. To sign in, they are encouraged to use social media services such as Facebook, and agree to give Wi-Fi access to elements of their Facebook account, including their email address and likes. This information can then be used to target bespoke emails. This allows users identification and other business opportunities like advertisement at users Facebook posts about shopping. On this research work we propose to apply this concept to public transportation because it is important to get users mobility patterns to optimize public transportation offers. In 2015 the number of mobile phone users is around 4.5 billion [3], the majority of apps in the store have access to the list of routers around you (scanned every 20 seconds) and the Android smartphone by default scans for Wi-Fi routers even if you disable Wi-Fi. Also based on Wi-Fi it is possible to count people [4] and pattern tracking [5]. The collected data is very important to several entities from city planners, public transportation operator, business owners and police, interested in crowd control to civilians both as a form of intelligence-gathering or everyday problem relief. This mobility patterns are collected passively without user intervention based on the probe request of mobile devices. These probes request are sent periodically broadcasting packets, which contain the unique MAC address of the client and (sometimes) the name of a network to which it had previously connected. This can be used to determine the owner of mobile device in a range of an AP. We propose a passive Wi-Fi tracking
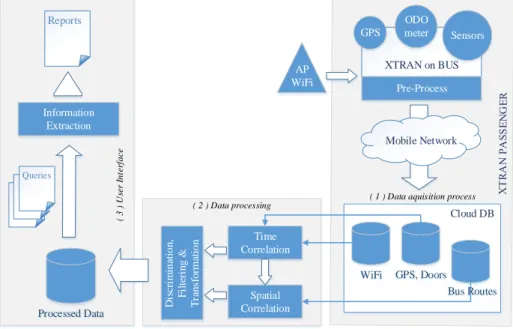
system based on AP in each public transportation mean (e.g bus in our study) and a central tracking cloud server. The focus of this research is on the collection and processing of Wi-Fi probe request detections, like the identified in Fig. 1, used to identify the number of persons with mobile devices and find their route path and timing in a public transportation. This approach is integrated in a bus fleet program management Xtran of a Portuguese Company Tecmic [6], so this data can be combined with other like the information of bus door (open/close), location (GPS) and day/time. Unfortunately, passive Wi-Fi detection is an unreliable and highly noisy source of location information by modern localization standards. Phones are unmodified, and thus transmit at their discretion. Wi-Fi transmissions from a mobile device may range up to 300 meters, or may be too faint to detect at 20 meter range depending on transmit power, path loss and fading effects. Fig. 2 gives a general overview of the passive Wi-Fi tracking system for public transportation integrated with XtraN.
*Mar 1 00:27:04.675: 000357, 008, -11b, ffff.ffff.ffff, bcd1.d344.a696 SSID: NULL *Mar 1 00:27:44.347: 0002AF, 008, -11b, ffff.ffff.ffff, bcd1.d344.a696 SSID: Casa-BAMJ *Mar 1 00:27:44.351: 0002AF, 008, -11b, ffff.ffff.ffff, bcd1.d344.a696 SSID: NULL *Mar 1 00:28:11.367: 0001C1, 008, -11b, ffff.ffff.ffff, 98d6.f79a.9875 SSID: FON_ZON_FREE
Fig. 1. Debug Probe request on AP in monitor mode
Another work contribution is the field application, because this approach is one of the first applications in public transportation and the output (number of passengers in a bus and user’s route path and time) are important information for public transportation operator to enable them to tune their offer to users’ needs. Number of passengers in a bus can be used for bus drivers’ fuel consumption ranking in an Eco-Driving program, because the number of passengers is related with weight and time in idle at bus stops, details of this can be found in [7]. Mobility user patterns have been widely studied [8-10]. The majority of the work in this area relies on GPS information available from users’ mobile devices. Wi-Fi monitoring detects the signal that Wi-Fi-enabled devices send out all the time in their search for a Wi-Fi access point (AP). The user is not actively involved in this a kind of passive localization. The information that can be derived from these signals can be useful for crowd control, marketing purposes or real time monitoring of public space use. Most of these approaches are based on a series of Wi-Fi monitors deployed in the region of interest and users mobile devices sends their Wi-Fi probe request. The server processes data from the monitors to reproduce the device most likely trajectory, which is exported in the form of a second by second location trace. Alternatives to this approach are Bluetooth based on mobile device signal receive from beacon, working in a low energy mode (BLE). Basically this BLE have the advantage of no installation need, working in a simple configuration, but Wi-Fi have the advantage of providing more user interaction. Example of this BLE is the work [11] in partnership with the public transportation operator of Funchal in Madeira Island, who explored the Bluetooth technology for passenger counting.
XTRAN on BUS GPS ODO meter Sensors AP WiFi GPS, Doors Mobile Network WiFi Queries Processed Data Reports Information Extraction Time Correlation Pre-Process Spatial Correlation D is cr im in at io n , F il te ri n g & T ra n sf o rm at io n Bus Routes ( 1 ) Data aquisition process
( 3 ) U se r I nt er fac e ( 2 ) Data processing Cloud DB
Fig. 2. Proposed System, (1) Data Acquisition, (2) Data Process at cloud Server, (3) user interface for information access
2 Developed System
As illustrated in Fig. 2, our approach is split in three steps: (1) data collection, (2) data processing and (3) user interface to show the results and available reports.
2.1 Data Collection
For the WiFi sensor we installed an AP Cisco series 1250, because no AP with monitor capability could be used. Due to commercial reason (because the project is connected to a company) we have used Cisco, but with other brands the process is less complex because Cisco blocks without payment or without additional equipment some AP’s features. This is the case for obtaining the Received Signal Strength Indicator (RSSI) from every client’s Probe Requests, which requires a Wireless LAN Controller (WLC).
The AP1250 series can be controlled from the WLC versions from 5 to 8. We used the 7.3.101.0 version, graciously borrowed from Cisco during 90days, which matched the AP version 15.2(2).
For the sake of cost reduction, the intention is to use only one Access Point, so the project was developed to find the best results with only the counting from Probe Requests. Later we added the received signal information from the WLC as one option to improve the results.
From XtraN, we use GPS data, sensor information door open/close, date and time.
The information from each sensor device is sent to XTraN controller module via Syslog. This module wraps all the log files that are produced by each trip with some identifiers like bus_id, route_id, route_way, trip_nbr, etc, so they can be tracked after being sent to the cloud server database. All events from the XTraN sensor devices are also referenced by a timestamp value.
2.2 Pre-processing
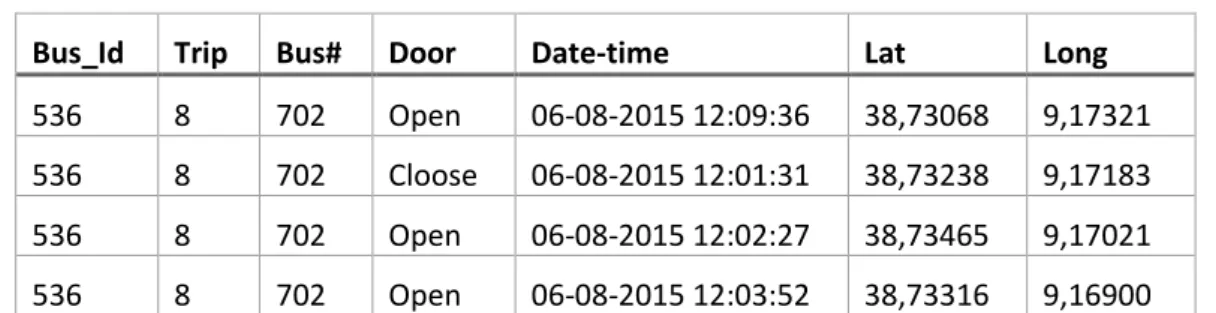
Wi-Fi data is aggregated and filtered to reduce the amount of information to be sent to the database server. The Wi-Fi log file has several entries per second for each client for a single scanning event due to the private SSID list saved on each terminal – it sends a probe request message for each saved SSID. All this entries can be aggregated to a single one, reducing information volume. If information about RSSI is present, an average value can be saved. Data from XTraN sensors are also filtered to pass only relevant fields. Table 1 shows GPS data with information or door open/close.
Table 1. Excerpt of a pre-processed GPS log file
Bus_Id
Trip
Bus#
Door
Date-time
Lat
Long
536
8
702
Open
06-08-2015 12:09:36
38,73068
9,17321
536
8
702
Cloose
06-08-2015 12:01:31
38,73238
9,17183
536
8
702
Open
06-08-2015 12:02:27
38,73465
9,17021
536
8
702
Open
06-08-2015 12:03:52
38,73316
9,16900
There is no direct link between the MAC address and the user, that identifies, but it is possible to extract information regarding the individual's habits and potential social connections. Crossing this information obtained temporally with other information (basically from logins through mobile devices in social network), it is possible to identify the user through his terminal’s MAC. To avoid this we perform a hash function on each MAC before we store the information, see Table2.
Table 2. Collected user MAC address transformed by a Hash function for privacy issues
Timestamp
Hash_mac
07-09-2015 19:01:40
e29eb50b762d4b7bcdf2cd1c4635f641
2.3 Data Processing at cloud server
AP data from client probe request and XtraN data are sent to a SQL database in a cloud environment. All that data will be processed and related to produce a single table with summarized data. This process of data correlation consists on the following steps: XTraN data from GPS and Door sensors are correlated in the time domain so that a GPS position can be added for each door open/close event.
With the identified position, more information is added relating it with the static XTraN data about the BUS routes and its stops, so we can identify the name and number of that bus-stop.
Fig. 3. Data Correlation based on time and position
The WiFi data was previously filtered and has now one event per probe request and per terminal, consisting basically from a hash code and a timestamp. This data will be sampled in a timely manner and related with GPS and Door sensor events.
The advantage of this method is that practically we have a way of tracking individual passenger’s routes and count them stop by stop. The chosen method for the counting is by sampling WiFi data segment by segment. One segment is the distance in time or space between consecutive stops. This distance gives the longest time sampling duration, which is necessary to increase terminal detection chances, because of the unpredictable probe request nature of the terminal WiFi scanning method. The drawback is when the bus reaches the bus-stop where many passengers may be waiting for the bus and can be counted as inside the bus (false positives). To solve this problem, several sampling and filtering functions were implemented as described below.
Figure 4 resumes several use cases of passengers in and out of the bus among with the two main sampling functions:
by segment (from stop to stop, triggered by open door event), represented with blue ellipses; by location (bus stop area, centered on its GPS position), represented with orange ellipses.
Those functions were merged into one (intersection of the two) in order to avoid the bus stop region. Two new variants functions were implemented in order to compare the results, namely:
Function A: sampling by segment minus a time-delta - time-delta is a user definable function parameter, in seconds, which will subtract the time of door open event, avoiding the stop region in some cases. This method is easy to implement and works even if no access to GPS information;
Function B: sampling by segment until reaching the stop zone. stop zone is a user definable function parameter, radius in meters, from the stop position center. The time of a matching bus GPS position is used as the sampling end time, avoiding the stop region in all cases. This method works for all cases but needs precise GPS information.
The Figure 4 above represents a subset of theoretical use cases we found initially to be problematic to this project. The Figure is split into three parts: bus state, WiFi terminals in and out of the bus. For the WiFi terminals, we can have true or false detections and/or true or false exclusions depending on when the terminal was detected regarding the bus state and its position. For the outside of bus terminals, we are admitting that some can be moving along with the bus – G and H use cases.
WiFi terminals are represented with “V” for the ones that in fact are in the bus and with “X” for the ones that are out of the bus. The double dash “--“ means that the terminal did not sent any probe request for that sampling period. This exercise explores tow sampling methods: by segment, between each door open activity (blue ellipses) and by position, when the bus arrives and leaves the bus stop zone (orange ellipses). We are representing with color letter green/red when a probe request is counted. Considering that the main rule for a detection is having two consecutive counts, we represent a true/false detection in green and a true/false exclusion in red. The presented use cases (which do not address all possibilities) tries to explore the limits for a true and false detection/exclusion which was very useful for the design of the sampling and filtering functions.
A B C D E F G H stopped V1 -- V1 -- V2 -- V2 -- X1 X1 Doors o/c V1 -- V1 -- V2 -- V2 -- X1 X1 X3 X3 stopped V1 -- V1 -- V2 -- V2 -- X1 X1 moving V1 -- V1 -- V2 V2 X3 X3 stopped V1 V1 V2 -- V2 -- X2 X2 X3 X3 Doors o/c V1 -- V1 -- V2 -- V2 -- X2 X2 X3 X3 stopped V1 -- V1 -- V2 -- V2 -- X2 X2 moving V1 -- V1 -- V2 V2 stopped V1 V1 V2 -- V2 --Doors o/c V1 -- V1 -- V2 -- V2 --stopped moving stopped
LEGEND: Blue elipse: segment sampling function
X1, X2, X3: out of BUS terminals Orange elipse: stop zone sampling function V1, V2: in BUS terminals
- - : terminal not detected
GREEN: Valid terminal detection - 2 consecutive detections RED: Excluded terminal
WiFi Terminals Se gm e n t X Se gm e n t Y
out of BUS use cases in BUS use cases
BUS Activity true positives false negatives true negatives false positives BU S ro u te d ir ec ti o n BU S ST O P B U S ST O P B U S ST O P
Fig. 4. Sampling terminals use cases
3 Case Study
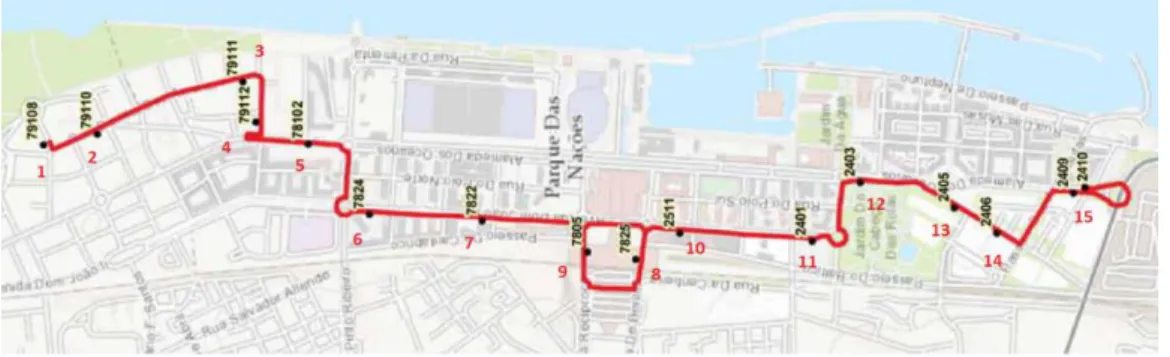
We performed tests during a week period in a series of buses. We chose buses with few passengers to facilitate the manual counting and the manual identification of each route path performed by each passenger. These requirements were made because we wanted to evaluate our current proposal with real metrics. We chose routes with loops and nearby stops (separated by a straight distance around 150 meters), as the example of bus 400 shown in Fig. 5.
Fig. 5. Bus route 400, bus stops and route path representation
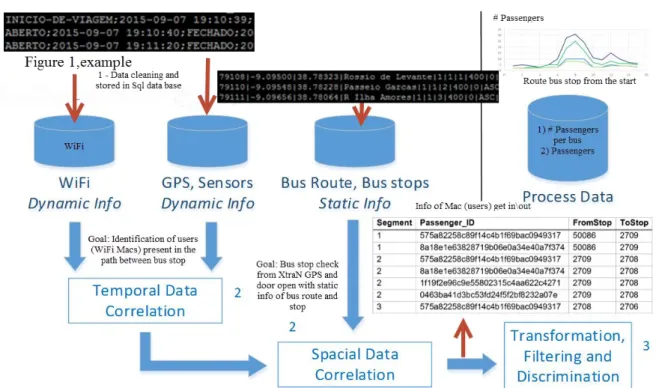
In Fig 6, we show a small extract of data collected by XtraN regarding GPS data and door sensor. Process started with data collection, cleaning and store in a SQL database. Data is available from the probe requests in AP, XtraN sensors door (open/close), timestamps and GPS, bus route schedule and route information. Second process step is the temporal and spatial correlation, where the output are hashed mobile device MAC address with information about the stop he gets in and out. Last process is the manipulation of this data towards the information (number of passengers and route path of passengers).
Fig. 6. Data collected through XtraN regarding bus stop, GPS position, door sensor, Wifi data after cleaning is sent to data base, then correlation process (special and temporal) and last process is the transformation, filtering
and discrimination towards final number of passengers in a bus or their route path.
3.1 Main Problems
Several field tests have been performed; we will highlight some of the major findings: Unpredictable nature of the terminal WiFi scanning for networks;
Bus routes with route loops; Crowded areas near bus-stops.
There is no standard for active scanning for wireless networks. Each manufacturer implements their method of WiFi scanning which may differ among operating system software versions, device models, etc,. Although we found that the majority of devices make a probe each second in average, if the terminal is in active state (with active processes which need internet access). In other modes like battery save mode or sleep mode, or if all processes and applications that needs internet communication are disabled (email, social networks, weather forecast, etc) then it is most likely that the terminal will not scan for WiFi networks even if WiFi interface is enabled. This pointed us into the way of sampling the probe messages between stops, which gave us the maximum time for terminal detection without compromising counting precision.
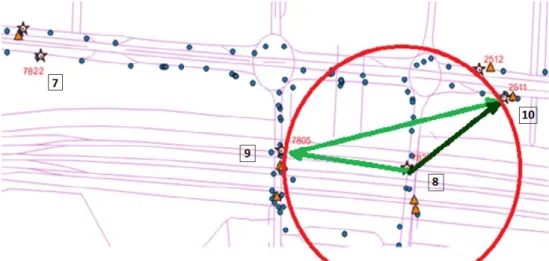
Nearby stops because route loops, as the example showed in Fig. 7, where the stops identified by the numbers 7825 (8) and 2511 (10) are in a distance around 150m.
To overcome these problems, we used an algorithm based on the vector distance between three consecutive stops that detects this kind of situations. If the sum vector (dark green in Fig.7) is smaller than a pre-defined distance - we used the minimum distance between stops of 300 meters – it signals the system to use an extra segment to the next stop. Based on this information, we apply the best filter: with 2 or 3 obligatory and consecutive segments, at which a passenger must be detected to be considered inside the bus.
Crowded areas near bus-stops are a big problem because they can introduce many erroneous counting for bus passengers. It was clearly a zone to avoid and so we decided to change the sampling function to anticipate the stop time. Two alternatives were implemented and can be used exclusively, for instance:
If GPS information is present and precise, we register the time when the bus enters on the bus-stop zone, defined by a radius of 100meters. This time will be used as the sampling end period - function B referenced in 3.3;
If no precise GPS information is available, we use a fixed time interval of 10 seconds, which subtracts the bus-stop open door time. This time will be used as the sampling end period - function A referenced in 3.3.
Fig. 7. BUS route and stops at Oriente station (GPS data)
3.2 Main results
Figure 8 represents passenger counting for each segment of a route path (route no. 400, ascending way). There are plotted 4 different curves, each one is the result for different combinations of segmentation and filtering functions:
Function A: sampling by segment minus a time-delta (10 seconds);
Function B: sampling by segment until reaching the stop zone (100m radius); 2 segment Filter: passenger valid only if present on 2 consecutive segments; 3 segment Filter: passenger valid only if present on 3 consecutive segments.
Figure 8 shows clearly that trying to avoid the stop zone does not help much on crowded places, especially on a circular route path (stops 7 to 10). On the other hand, applying the correct filter on this particular case - filter with 3 segments (light blue and light green curves) - will help to discriminate the outlier terminals, filtering-out about 20 units. From the manual counting process, results from the table above shows an average precision of 61%, although the overall precision from all tests reached up to 70%. Precision was defined by:
Comparing the inferred counts with the real ones, we noted that there were terminals that were not detected. This is probably caused by terminals in sleep mode or with its WiFi interface disconnected. It could also be caused because in the sampling period the terminal did not sent any probe request: since there is no standard in terms of frequency of probe request messages – for each manufacturer, for each model and device version, the behavior can be different. Another reason can be the exclusion of terminals that eventually made only a few scarce probe requests, which did not comply with the required filter parameters.
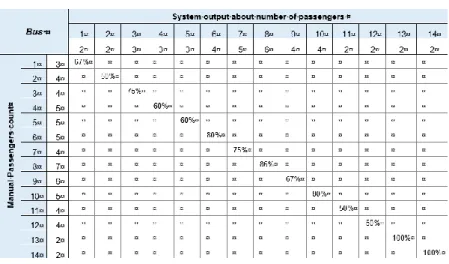
Table 3 shows exactly the same information, in a tabular format, where we identify the number of passengers per segment and associated precision
The fact of choosing a route with too few passengers (necessary for manual counting) implies that one unit error makes a big precision decrease.
Knowing the fact that not all people have smartphones, nor all smartphones have Wi-Fi interface active, the results of this simple system based purely on passive terminal Wi-Fi detection from an AP in monitor mode, reached a precision of 70%. This result was possible to achieve thanks to the sampling and filtering methods used. The sampling functions used maximises the detection time, so a probe request message can be detected and counted.
In addition, the filtering algorithms used were very effective to eliminate outlier terminals that were not in the bus. This type of data collected anonymously represents huge data sets that with correct data pre-processing and cleansing it is possible to extract for free important user mobility patterns in a city. This approach on buses allows to collect public transportation mobility data, times, day and route occupancy rate, identify route with few passengers. This information is very important towards a public transportation and towards user needs.
Connectivity allows new opportunities as collaboration towards traffic and bus arrival times and allows transport operators to deliver information messages on time to their target population (passengers).
Fig. 8. Comparing different filters and segmentation functions for passenger counting
Table 3. Comparing different filters and segmentation functions for passenger counting
# Stop BUS-STOP Origin Filter Function Real Count Precision 2 segm. 3 segm. 2 segm. 3 segm. Sampling Function A A B B 1 Rossio de Levante 4 2 2 2 4 50% 2 Passeio Garcas 5 2 2 2 4 50% 3 R. Ilha Amores 4 2 3 2 4 50% 4 Cais Olival 3 2 3 2 4 50% 5 Cais Olival 5 3 5 3 6 50%
6 Av. Boa Esperanca 10 3 5 3 8 38%
7 Av. D. Joao II 28 10 19 8 8 100% 8 Oriente Station 31 10 25 8 4 0% 9 Oriente Station 24 10 17 7 4 25% 10 R. Caribe 11 3 7 3 3 100% 11 Av Mediterraneo 9 3 5 3 3 100% 12 Oceanario 15 5 8 4 3 67% 13 Av Fernando Pessoa 10 4 6 4 3 67% 14 H. Descobertas 7 4 6 4 3 67%
15 Parque Nacoes Sul 6 3 5 3 3 100%
172 66 118 58 64 61%
3.3 Results Discussion
Although the different tests were performed on different days, the same practical procedures were used so as not to interfere with the results. The trips were made in the same race and at the same time (although on the second day the bus was delayed about 10 minutes), corresponding to two consecutive days of work, respectively Monday and Tuesday. In order to compare the results of the car and bus tests, the graphs of Figures 9 present the two functions A and B with the 3 segment filters for the ascending and descending paths, respectively.
Fig. 9. Comparing different carrier paths. Left path in upper direction, right path in lower direction. VP means AP outside and AC means AP inside bus.
It is found that, due to the reduced detection rate, a small variation of 1 or 2 units makes the error very significant. This situation does not allow drawing very assertive conclusions, although some phenomena can be explained between the two experiments. The AP on the outside of the bus, the registration of mobile terminals was more comprehensive in the periphery of the bus and it was necessary to use the filters to obtain more reliable results, as evidenced by the difference between the full curves vs. dashed lines. In the case of the AP inside the bus, it is possible that the noise caused by the equipment from the exterior has decreased slightly, but it is certain that the registration of the terminals inside it has improved substantially.
Fig. 10. Comparing real counting for different carrier paths
.
Fig. 11. Confusion matrix, that represent the average of our results
After analysing the values of the counts and inferences, we conclude that after the filtering process, the total number of inferred passengers is close to the count, but there is a variation of the error of the inferences along the
route, being visible, for example, an offset of the curve of the ascending course inferences. This error can be explained by the non-recurrence of Probe Request messages, causing late detection of the terminals in the following segments. Confusion matrix is presented on Figure 11
4 Conclusions
We described a passive tracking system to acquire users’ habits in public transportation. This approach applied to public transportation is new with several problems associated, like the need for a significant number of users with Wi-Fi interface on, problems with bus stops in route loops, and the problematic timing or scarcity of the probe request messages. An approach to solve the false positive counting was introduced with adaptive filtering techniques based on the detection of route loops. Also for maximizing the passenger detection chances, the WiFi probe sampling was made between stops - segment by segment. Our findings revealed that the proposed system has some drawbacks due to the passive nature of probing adopted, which are very dependant to the terminal WiFi probe frequency: short trips are difficult to detect and the system may incur on low precision for the exact origin and destination stop. The main advantage of the proposed solution is a very scalable and low cost implementation that gives medium-high precision of passenger habits to the bus route planners. Alternative methods will be introduced to complement this approach, like the Bluetooth low emissions beacons and the count based on camera image process. This last method is already in place in some buses and was already been tested. It has a high precision and is very expensive, but can be used to complement the proposed solution. This information and the estimation of passengers in a public transportation are important information for a better planning towards users’ effective needs. Wi-Fi can be also used to send information to passengers and all this collected data, if processed correctly, creates useful information about users’ mobility patterns. We are aware that this passive approach cannot give the exact number of passengers but the information extracted is very useful.
References
[1] Ogawa K., Verbree E., Zlatanova S., Kohtake N.,& Okhami Y. (2011). Towards Seamless Indoor-Outdoor Applications: Developing stakeholder-Oriented LocationBased Services. Geo-spatial Information Science 14(2): 109-118.
[2] John Chon, Hojung Cha, "LifeMap: A Smartphone-Based Context Provider for Location-Based Services", IEEE Pervasive Computing, vol.10, no. 2, pp. 58-67, April-June 2011, doi:10.1109/MPRV.2011.13. [3]. Number of mobile phone users worldwide. (May 2015). Retrieved from
http://www.statista.com/statistics/274774/forecast-of-mobile-phone-users-worldwide/
[4] Ya-Li Hou; Pang, G.K.H., "People Counting and Human Detection in a Challenging Situation," in Systems, Man and Cybernetics, Part A: Systems and Humans, IEEE Transactions on vol.41, no.1, pp.24-33, Jan. 2011 doi: 10.1109/TSMCA.2010.2064299.
[5] B. Bonn´e, A. Barzan, P. Quax, and W. Lamotte. Wifipi: Involuntary tracking of visitors at mass events - In World of Wireless, Mobile and Multimedia Networks (WoWMoM), IEEE 14th International Symposium and Workshops on a, pp 1–6 (2013).
[6] Tecmic website. (May 2015). Retrieved from www.tecmic.pt
[7] João Ferreira, José Almeida, Alberto Silva. “The Impact of Driving Styles on Fuel Consumption: A Data Warehouse and Data Mining based Discovery Process”, IEEE Transactions on Intelligent Transportation Systems Magazine on Intelligent Transportation Systems in March 2015. DOI 10.1109/TITS.2015.2414663. [8]. Van der Spek, S., Van Schaick, J., De Bois, P., & De Haan, R. (2009). Sensing human activity: GPS tracking.
Sensors, 9(4), 3033-3055.
[9]. Musa A.B.M., Eriksson J. (2012). Tracking Unmodified Smartphones Using WiFi Monitors. SenSys’12, Toronto, Canada.
[10]. McArdle, G., Demšar, U., van der Spek, S., & McLoone, S. (2014). Classifying pedestrian movement behavior from GPS trajectories using visualization and clustering. Annals of GIS, 20(2), 85-98.
[11]. Vassilis Kostakos (2008). “Wireless detection of passenger trips on public transport buses” LabUSE, University of Madeira, Carnegie Mellon University.