Combined e
ff
ects of gamma-irradiation and
preparation method on antioxidant activity and
phenolic composition of
Tuberaria lignosa
Jos´e Pinela,abAmilcar L. Antonio,acLillian Barros,adJo ˜
ao C. M. Barreira,abd Ana Maria Carvalho,aM. B. P. P. Oliveira,bCelestino Santos-Buelgad and Isabel C. F. R. Ferreira*a
In this study, the effect of different doses of gamma-irradiation (0, 1, 5 and 10 kGy) on colour, antioxidant activity and phenolic compounds of shade- and freeze-dried samples ofTuberaria lignosawere evaluated and compared. The last two parameters were assessed using decoctions and infusions in order to investigate the influence of the preparation method as well. In general, gamma-irradiation has no influence on colour parameter; changes caused by this technology were only identifiable on the lipid peroxidation inhibition capacity of the shade-dried samples and also on a few phenolic compounds. Differences among preparation method were significant for all assayed parameters, with decoctions being preferable over infusions, as indicated by the higher antioxidant activity and levels of phenolic compounds. Overall, the gamma-irradiation treatment (up to 10 kGy) did not significantly affect the analyzed parameters. Nevertheless, other studies are of interest to evaluate the preservation effectiveness of this technology.
1.
Introduction
During the last decades, medicinal and aromatic plants have been extensively studied and found to be excellent sources of bioactive and health-promoting compounds.1,2Actually, many
plant extracts rich in phenolic compounds are used as food complements or can be integrated into cosmetic or pharma-ceutical formulations.3,4 For this reason, the industry is very
interested in bioactive molecules from natural sources. Based on ethnobotanical surveys conducted in western regions of the Iberian Peninsula, Tuberaria lignosa (Sweet) Samp. (Fam. Cistaceae) arises as one of the most quoted medicinal plants.5,6 Aer being dried, this plant is used in
herbal preparations (infusion and decoction) for treating various diseases and ailments, such as gastrointestinal and hepato-depurative disorders and skin inammations.6 These
local practices are supported by documented biological effects, namely anti-inammatory and antiulcerogenic (cytoprotective) properties,7 as well as in vitro antioxidant8 and antiviral
activities.9 Additionally, the phenolic fraction of this plant,
mainly composed of ellagitannins and avonoids, may be linked to the above mentioned effects.8,9
During the entire production process (from harvesting and drying to packaging and storage), raw medicinal plants are prone to chemical and microbial contaminations and insect infestation, which can lead to spoilage, quality deterioration and consequent economic loss.10,11 Besides being a health
hazard to consumers, contaminated medicinal plants can also adversely affect the efficacy and stability of their bioactive compounds, especially during storage,12and lead to spoilage of
pharmaceuticals and food items to which they are added.13
Therefore, an effective and sustainable decontamination process must be followed to ensure the hygienic quality of these products, making them suitable for human consumption and commercialization.
Chemical fumigants have been used to decontaminate plant products, being now prohibited or increasingly restricted in several countries due to health, environmental or occupational safety issues.14Furthermore, once conventional thermal
treat-ments can damage many plant properties, either chemical or physical,15 new and emerging non-thermal technologies are
being investigated and applied. Among them, irradiation pro-cessing with gamma-rays is in an exceptional position. This physical method, considered safe and effective by several international authorities (namely FAO, IAEA and WHO),16has
been used for insect disinfestations and parasite inactivation (with low doses up to 1 kGy), reduction of non-spore forming aMountain Research Centre (CIMO), ESA, Polytechnic Institute of Bragança, Apartado
1172, 5301-855 Bragança, Portugal. E-mail: [email protected]; Fax: +351-273-325405; Tel: +351-273-303219
bREQUIMTE, Departamento de Ciˆencias Qu´ımicas, Faculdade de Farm´acia,
Universidade do Porto, Rua Jorge Viterbo Ferreira, no. 228, 4050-313, Portugal
cIST/CTN, Campus Tecnol´ogico e Nuclear, Instituto Superior T´ecnico, Universidade de
Lisboa, E.N. 10, 2695-066 Bobadela, Portugal
dGIP-USAL, Facultad de Farmacia, Universidad de Salamanca, Campus Miguel de
Unamuno, 37007 Salamanca, Spain
Cite this:RSC Adv., 2015,5, 14756
Received 20th November 2014 Accepted 22nd January 2015
DOI: 10.1039/c4ra14944k
www.rsc.org/advances
14756 |RSC Adv., 2015,5, 14756–14767 This journal is © The Royal Society of Chemistry 2015
RSC Advances
pathogens and spoilage microorganisms (with medium doses from 1 to 10 kGy), and reduction of microorganisms to the point of sterility (achieved at high doses above 10 kGy).13,17Likewise,
the gamma-irradiation treatment provides an alternative way to eliminate pesticide residues from plant products.18 In the
European Union, the maximum dose of gamma-irradiation approved to sanitize dried herbs is 10 kGy,19whereas in USA
the maximum is 30 kGy.20
Meanwhile, there is a growing scientic interest in irradiation-induced modications on antioxidant activity and the compounds responsible for such activity. It is known that during the irradiation process, free radicals and other reactive species are generated due to the interaction with water mole-cules, capable of breaking chemical bonds and modify various molecules.12 A previous study conducted by our team on T.
lignosashowed that it has strong antioxidant activity;8however
the effects of gamma-irradiation on the chemical and physical properties of this plant have never been studied. Therefore, the present study was undertaken to explore the effect of different doses of gamma-irradiation (0, 1, 5 and 10 kGy) on the antiox-idant activity, phenolic compounds and colour parameters of shade- and freeze-dried T. lignosa samples. The rst two parameters were performed on decoctions and infusions, forms traditionally used for therapeutic applications, in order to investigate the inuence of the preparation method as well.
2.
Materials and methods
2.1. Standards and reagents
2.1.1. For irradiation. The dose rate of irradiation was estimated by Fricke dosimetry, using a chemical solution sensitive to ionizing radiation prepared in the lab following the standards.21 The irradiation dose was estimated during the
process using Amber Perspex routine dosimeters (batch V, from Harwell Company, UK). To prepare the acid aqueous Fricke dosimeter solution the following reagents were used: ferrous ammonium sulfate(II) hexahydrate, sodium chloride and sulfuric acid, all purchased from Panreac S.A. (Barcelona, Spain) with purity PA (proanalysis), and water treated in a Milli-Q water purication system (Millipore, model A10, Billerica, MA, USA).
2.1.2. For antioxidant activity evaluation. 2,2-Diphenyl-1-picrylhydrazyl (DPPH) was obtained from Alfa Aesar (Ward Hill, MA, USA). Trolox (6-hydroxy-2,5,7,8-tetramethylchroman-2-carboxylic acid) was from Sigma (St. Louis, MO, USA). Water was treated in a Milli-Q water purication system.
2.1.3. For phenolic compounds analysis. Acetonitrile (99.9%, HPLC grade) was from Fisher Scientic (Lisbon, Por-tugal). Formic acid was purchased from Prolabo (VWR Inter-national, France). The phenolic compound standards (apigenin-6-C-glucoside, p-coumaric acid, ellagic acid, gallic acid, kaempferol-3-O-glucoside, kaempferol-3-O-rutinoside, luteolin-6-C-glucoside, 3-O-glucoside and quercetin-3-O-rutinoside) were from Extrasynthese (Genay, France). Water was treated in a Milli-Q water purication system.
2.2. Samples
Tuberaria lignosa(Sweet) Samp. (synonym ofXolantha tuberaria (L.) Gallego, Munoz Garm & C. Navarro) was collected in the
owering season in Miranda do Douro (Tr´as-os-Montes, north-eastern Portugal), considering the local medicinal uses as well as healers' and selected consumers' criteria, which are related to particular gathering sites and requirements for safe herbal dosages forms, such as infusion and decoction.
The option for wild samples, instead of ones from commercial origin, was supported by a previous work of our research team8 that highlighted wild T. lignosa samples as
having higher phenolics content and antioxidant activity than those obtained in a local herbal shop available as dried rosettes of leaves and inorescences. While the plant material collected in theeld is fresh, the commercial one from herbal shops may have been stored for a long period of time or dried differently, which leads to quality loss.
Voucher specimens were deposited in the Herbarium of the Escola Superior Agr´aria de Bragança, Portugal.
2.3. Samples drying
Tuberaria lignosaowering aerial parts (e.g., basal leaves, stems and inorescences) were submitted to two different drying methods: freeze-drying (7750031 Free Zone 4.5, Labconco, Kansas City, MO, USA) immediately aer being gathered; and
shade-drying, being stored in a dark and dry place in cellophane or paper bags kept at room temperature (21 C and 50% relative humidity) for 30 days, simulating informants' general conditions of traditional plant-use.
2.4. Samples irradiation
Freeze- and shade-dried samples were divided into four groups (conveniently packaged in sterilized polyethylene bags): control (non-irradiated, 0 kGy), sample irradiated at 1 kGy, sample irradiated at 5 kGy, and sample irradiated at 10 kGy, where 1, 5 and 10 kGy were the predicted doses.
The samples irradiation was performed in a 60Co experi-mental chamber (Precisa 22, Graviner Manufacturing Company Ltd., UK) with four sources, total activity 177 TBq (4.78 kCi), in January 2014. The estimated dose rate for the irradiation posi-tion was obtained with a Fricke dosimeter. During irradiaposi-tion process, the dose was estimated using Amber Perspex routine dosimeters, following the procedure previously described by Fernandeset al.22The estimated doses aer irradiation were:
2.5. Colour measurement
A colorimeter (model CR-400; Konica Minolta Sensing, Inc., Japan) with an adapter for granular materials (model CR-A50) was used to measure the colour of the samples. Using illumi-nant C and the diaphragm opening of 8 mm, the CIEL*,a*and b*colour space values were registered through the computer-ized system using a colour data soware“Spectra Magic Nx”
(version CM-S100W 2.03.0006). The instrument was calibrated using the standard white plate before analysis.
The colour of the shade- and freeze-dried irradiated and non-irradiated samples was measured in three different points on each set of samples, being considered the average value to determine the colour coordinatesL*(lightness4darkness),a* (redness4greenness), andb*(yellowness4blueness).
2.6. Preparation of decoctions and infusions
To prepare decoctions, each sample (1 g) was added to 200 mL of distilled water, heated on a heating plate (VELP Scientic, Usmate, Italy) and boiled for 5 min. The mixture was leto stand at room temperature for 5 min more, and thenltered through Whatman No. 4 paper.
To prepare infusions, each sample (1 g) was added to 200 mL of boiling distilled water and leto stand at room temperature for 5 min, and thenltered through Whatman No. 4 paper.
A portion of the obtained decoctions and infusions was frozen and lyophilized (Free Zone 4.5, Labconco, Kansas City, MO, USA) for subsequent analysis of phenolic compounds. The antioxidant properties were evaluated directly on the decoc-tions/infusions.
2.7. In vitroantioxidant properties
2.7.1. General. The decoctions and infusions were redis-solved in water (nal concentration 1 mg mL 1) and further diluted to different concentrations to be submitted to distinctin vitroassays8to evaluate their antioxidant properties. The extract
concentration providing 50% of antioxidant activity or 0.5 of absorbance (EC50) were calculated from the graphs of antioxi-dant activity percentages (DPPH,b-carotene bleaching inhibi-tion and TBARS formainhibi-tion inhibiinhibi-tion assays) or absorbance at 690 nm (reducing power assay) against extract concentrations. Trolox was used as standard.
2.7.2. DPPH radical-scavenging activity.This methodology was performed using an ELX800 Microplate Reader (Bio-Tek, Potton, UK). The reaction mixture in each one of the 96-wells consisted of one of the different solution concentrations (30mL) and methanolic solution (270mL) containing DPPH radicals (6 10 5M). The mixture was leto stand for 30 min in the dark.
The reduction of the DPPH radical was determined by measuring the absorption at 515 nm. The radical scavenging activity (RSA) was calculated as a percentage of DPPH discol-oration using the equation: RSA (%)¼[(ADPPH AS)/ADPPH] 100, whereASis the absorbance of the solution when the sample extract has been added at a particular level, andADPPHis the absorbance of theDPPHsolution.
2.7.3. Reducing power. This methodology was performed using the microplate reader described above. The different solution concentrations (0.5 mL) were mixed with sodium phosphate buffer (200 mM, pH 6.6, 0.5 mL) and potassium ferricyanide (1% w/v, 0.5 mL). The mixture was incubated at 50 C for 20 min, and trichloroacetic acid (10% w/v, 0.5 mL) was added. The mixture (0.8 mL) was poured in 48-well plates, with deionised water (0.8 mL) and ferric chloride (0.1% w/v, 0.16 mL), and the absorbance was measured at 690 nm.
2.7.4. Inhibition of b-carotene bleaching.A solution ofb -carotene was prepared by dissolvingb-carotene (2 mg) in chlo-roform (10 mL). Two millilitres of this solution were pipetted into a round-bottomask. Aer the chloroform was removed at 40C under vacuum, linoleic acid (40 mg), Tween 80 emulsier (400 mg), and distilled water (100 mL) were added to theask with vigorous shaking. Aliquots (4.8 mL) of this emulsion were transferred into different test tubes containing different concentrations of the samples (0.2 mL). The tubes were shaken and incubated at 50C in a water bath. As soon as the emulsion was added to each tube, the zero time absorbance was measured at 470 nm in a Model 200 spectrophotometer (Ana-lytikJena, Jena, Germany). b-Carotene bleaching inhibition (CBI) was calculated using the following equation: CBI (%)¼ (Abs aer 2 h of assay/initial Abs)100.
2.7.5. Inhibition of thiobarbituric acid reactive substances (TBARS) formation. Porcine (Sus scrofa) brains were obtained from official slaughtered animals, dissected, and homogenised with a Polytron in ice-cold Tris–HCl buffer (20 mM, pH 7.4), to produce a 1 : 2 (w/v) brain tissue homogenate which was centrifuged at 3000g for 10 min. An aliquot (0.1 mL) of the supernatant was incubated with the different solution concen-trations (0.2 mL) in the presence of FeSO4(10mM; 0.1 mL) and ascorbic acid (0.1 mM; 0.1 mL) at 37C for 1 h. The reaction was stopped by the addition of trichloroacetic acid (28% w/v, 0.5 mL), followed by thiobarbituric acid (TBA, 2%, w/v, 0.38 mL), and the mixture was then heated at 80 C for 20 min. Aer
centrifugation at 3000gfor 10 min to remove the precipitated protein, the colour intensity of the malondialdehyde (MDA)– TBA complex in the supernatant was measured by its absor-bance at 532 nm. The inhibition ratio (%) was calculated using the following formula: Inhibition ratio (%)¼[(A B)/A]100, where A and B were the absorbance of the control and the compound solution, respectively.
2.8. Phenolic compounds
Each lyophilised decoction/infusion (1 mg) was dissolved in water : methanol (80 : 20 v/v), ltered through 0.2 mm nylon
lters from Whatman, and analysed by HPLC (Hewlett-Packard 1100 chromatograph, Agilent Technologies, Waldbronn, Ger-many) with a quaternary pump and a diode array detector (DAD) coupled to an HP ChemStation (Rev. A.05.04) data-processing station. A Spherisorb S3 ODS-2 C18 (Waters, Dinslaken, Ger-many), 3mm (4.6 mm150 mm) column thermostatted at 35 C was used. The solvents used were: (A) 0.1% formic acid in water, (B) acetonitrile. The elution gradient established was 10% B to 15% B over 5 min, 15–25% B over 5 min, 25–35% B
14758|RSC Adv., 2015,5, 14756–14767 This journal is © The Royal Society of Chemistry 2015
over 10 min, isocratic 50% B for 10 min, and re-equilibration of the column, using aow rate of 0.5 mL min 1. Double online detection was carried out in the DAD using 280 nm and 370 nm as preferred wavelengths and in a mass spectrometer (MS) connected to the HPLC systemviathe DAD cell outlet.
MS detection was performed in an API 3200 Qtrap (Applied Biosystems, Darmstadt, Germany) equipped with an ESI source and a triple quadrupole-ion trap mass analyser that was controlled by Analyst 5.1 soware. Zero grade air served as the
nebuliser gas (30 psi) and turbo gas for solvent drying (400C, 40 psi). Nitrogen served as the curtain (20 psi) and collision gas (medium). The quadrupoles were set at unit resolution. The ion spray voltage was set at 4500 V in the negative mode. The MS detector was programmed to perform a series of two consecu-tive scan modes: enhanced MS (EMS) and enhanced product ion (EPI) analysis. EMS was employed to obtain full scan spectra, to give an overview of all the ions in sample. Settings used were: declustering potential (DP) 450 V, entrance potential (EP) 6 V, collision energy (CE) 10 V. Spectra were recorded in nega-tive ion mode betweenm/z100 and 1500. EPI mode was per-formed in order to obtain the fragmentation pattern of the parent ion(s) of the previous experiment using the following parameters: DP 50 V, EP 6 V, CE 25 V, and collision energy spread (CES) 0 V.
The phenolic compounds present in the decoctions/ infusions were characterised according to their UV and mass spectra and retention times, and comparison with authentic standards when available. For quantitative analysis, calibration curves were prepared by injection of known concentrations (2.5–100mg mL 1) of di
fferent standard compounds: apigenin-6-C-glucoside (y¼246.05x 309.66;R2
¼0.9994);p-coumaric acid (y¼321.99x+ 98.308;R2¼0.9984); ellagic acid (y¼35.695x 265.7;R2¼0.9991); gallic acid (y¼556.94x+ 738.37;R2 ¼ 0.9968); kaempferol-3-O-glucoside (y¼190.75x 36.158;R2¼ 1); kaempferol-3-O-rutinoside (y ¼ 17 5.02x 43.877; R2 ¼ 0.9999); luteolin-6-C-glucoside (y ¼ 365.93x + 17.836; R2 ¼ 0.9997); quercetin-3-O-glucoside (y¼316.48x+ 2.9142;R2¼1), and quercetin-3-O-rutinoside (y ¼ 222.79x + 243.11; R2 ¼ 0.9998). The results were expressed in mg per g of lyophilised decoction/infusion.
2.9. Statistical analyses
In all cases, analyses were carried out using three samples separately processed, each of which was further measured three times. Data were expressed as meanstandard deviation. All statistical tests were performed at a 5% signicance level using IBM SPSS Statistics for Windows, version 22.0 (IBM Corp., USA). An analysis of variance (ANOVA) with type III sums of squares was performed using the GLM (General Linear Model) procedure of the SPSS soware. The dependent variables were
analyzed using 2-way ANOVA, with the factors“irradiation dose” (ID) and “preparation method” (PM). When a statistically signicant interaction (IDPM) was detected, the two factors were evaluated simultaneously by the estimated marginal means plots for all levels of each single factor. Alternatively, if no statistical signicant interaction was veried, means were
compared using Tukey's honestly signicant difference (HSD), or other multiple comparison test (t-test).
Principal components analysis (PCA) was applied as pattern recognition unsupervised classication method. The number of dimensions to keep for data analysis was assessed by the respective eigenvalues (which should be greater than one), by the Cronbach's alpha parameter (that must be positive) and also by the total percentage of variance (that should be as high as possible) explained by the number of components selected. The number of plotted dimensions was chosen in order to allow meaningful interpretations.
3.
Results and discussion
3.1. Colour assessment
The results for CIE colourL*(lightness),a*(redness) andb* (yellowness) are presented in Table 1. The colour coordinateL* measures the lightness of the sample surface and ranges from black at 0 to white at 100. The chromaticity coordinate a* measures red when positive and green when negative, and chromaticity coordinateb*measures yellow when positive and blue when negative.23The reported values are given as the mean
value of each irradiation dose (ID), including results from shade- or freeze-dried samples, as well as the mean value of each drying method (DM), considering all irradiation doses in each case. The signicance of the effect of DM was evaluated using at-test for equality of means (aer checking the equality
of variances through a Levene's test), since there were fewer than three groups. The interaction among factors (ID DM) was never signicant (p> 0.05), allowing to compare the effects of each factorper se. As it can be concluded from Table 1, the effect of ID was not signicant in any case, indicating that these physical parameters are not strongly affected by gamma-irradiation. On the other hand, the effect of the DM was always signicant, showing that samples dried under shade are prone to present lower lightness and redness and higher yel-lowness. According to the literature, higherL*values and lower
Table 1 CIE colourL*(lightness),a*(redness) andb*(yellowness) of non-irradiated and irradiated T. lignosa shade- or freeze-dried samples. The results are presented as meanSDa
L* a* b*
Irradiation dose (ID) 0 kGy 475 03 173
1 kGy 466 03 183
5 kGy 455 23 182
10 kGy 437 13 183
p-Value (n¼18) Tukey's test 0.154 0.252 0.770
Drying method (DM) Shade-dried 415 22 192
Freeze-dried 494 12 173
p-Value (n¼36) t-Student's test <0.001 <0.001 <0.001
p-Value (n¼72) IDDM 0.253 0.262 0.077
aResults are reported as mean values of each irradiation dose (ID),
a*/b*values are desirable in dried products.24Therefore,
freeze-drying may be indicated as the most suitable DM forT. lignosa samples. Additionally, the lack of signicant changes observed in irradiated samples might be an advantageous feature, since the colour parameters are of great importance in food and cosmetics industry.25In fact, the colour of dried medicinal and
aromatic plants is considered as a primary quality criterion23
and is directly related to consumers' appreciation of a product as they tend to associate product colour with its taste, hygienic security, shelf-life and personal satisfaction.26
3.2. Antioxidant activity
The EC50 values obtained for each antioxidant assay are pre-sented in Table 2, both for shade-dried and freeze-dried samples. The reported values are given as the mean value of each irradiation dose (ID), including results from samples submitted to infusion or decoction, as well as the mean value of each preparation method (PM), containing the results for all assayed doses in each case. The signicance of the effect of PM was evaluated using at-test for equality of means (aer checking
the equality of variances through a Levene's test), since there were fewer than three groups. The interaction among factors (ID PM) was signicant (p< 0.05) in all cases, acting as a source of variability. Thereby, no multiple comparison tests could be performed. However, some conclusions could be drawn aer analysing the estimated marginal mean (EMM) plots. For
instance, shade-dried (Fig. 1A) and freeze-dried (Fig. 1B) samples, further extracted by decoction, gave greater antioxi-dant activity than infusion ones. Concerning the effect of ID, the only identiable tendency was the apparently negative effect of the 5 kGy dose on the lipid peroxidation inhibition capacity in shade-dried samples.
The interest of decoctions and infusions from shade- and freeze-dried samples ofT. lignosawas already highlighted as a source of bioactive compounds and having appreciable antiox-idant properties.8 The same work also highlighted wild T.
lignosasamples as having higher phenolics content and bioac-tivity than those obtained in a local herbal shop available as dried rosettes of leaves and inorescences. That is why wild samples were chosen for this study instead of ones from commercial origin.
Although the antioxidant activities of different medicinal and aromatic plants have already been studied,1–3nothing has been reported on the effect of gamma-irradiation on the anti-oxidant activity ofT. lignosa. However, some research studies report different effects of the gamma-irradiation treatment on the antioxidant properties of other plant materials. A study conducted by Pereira et al.11 indicated that, in general, the
antioxidant properties were increased in borututu (a folk medicine obtained from the African treeCochlospermum ango-lense) infusions and methanolic extracts with the irradiation dose of 10 kGy. Carocho et al.27 found that the antioxidant
potential of Portuguese chestnuts was increased at 3 kGy. As
Table 2 Antioxidant properties (EC50values, mg mL 1) of non-irradiated and irradiatedT. lignosashade- or freeze-dried samples, according to
the irradiation dose (ID) and preparation method (PM). The results are presented as meanSDa
DPPH scavenging activity
Reducing power
Lipid peroxidation inhibition
TBARS formation inhibition
b-Carotene bleaching inhibition
Shade-dried
Irradiation dose (ID) 0 kGy 0.30.1 0.20.1 0.30.1 0.040.02
1 kGy 0.20.1 0.170.05 0.20.1 0.020.01
5 kGy 0.30.1 0.20.1 0.40.1 0.070.04
10 kGy 0.30.1 0.160.04 0.30.1 0.030.01
p-Value (n¼18) Tukey's test 0.242 0.160 <0.001 <0.001
Preparation method (PM) Infusion 0.390.05 0.250.04 0.40.1 0.050.04
Decoction 0.150.01 0.110.01 0.20.1 0.0250.002
p-Value (n¼45) t-Student's test <0.001 <0.001 <0.001 <0.001
p-Value (n¼90) IDPM <0.001 <0.001 <0.001 0.046
Freeze-dried
Irradiation dose (ID) 0 kGy 0.30.1 0.160.05 0.020.02 0.30.1
1 kGy 0.30.2 0.20.1 0.030.02 0.20.1
5 kGy 0.30.1 0.20.1 0.020.01 0.20.1
10 kGy 0.30.2 0.20.1 0.030.01 0.20.1
p-Value (n¼18) p-value (n¼18) 0.861 0.386 0.430 0.528
Preparation method (PM) Infusion 0.410.05 0.260.04 0.040.01 0.350.05
Decoction 0.150.02 0.100.01 0.010.01 0.110.05
p-Value (n¼45) t-student's test <0.001 <0.001 <0.001 <0.001
p-Value (n¼90) IDPM <0.001 <0.001 <0.001 <0.001
aResults are reported as mean values of each irradiation dose (ID), including samples submitted to infusion or decoction, as well as the mean value
of each preparation method (PM), considering all irradiation doses in each case. Therefore, SD reects values in those samples (with different ID or PM), and can be higher than mean values.
14760|RSC Adv., 2015,5, 14756–14767 This journal is © The Royal Society of Chemistry 2015
well, Hussain et al.28 reported a signi
cant decrease in EC50 values (corresponding to a higher antioxidant activity) of sun-dried irradiated (3 kGy) apricots. According to P´erezet al.,29a
30 kGy dose applied to dry sage and oregano for sanitization did not signicantly affect the capacity to inhibit the DPPH radical
or the reducing power, nor did it affect the total phenolic content of the methanolic and aqueous extract. Similarly, Mustaphaet al.30observed no signi
cant changes in the free radical scavenging activity of irradiate milletour up to 5 kGy. In contrast, Kim and Yook31observed that irradiation of
kiwi-fruit up to 3 kGy had negative effects on vitamin C content and antioxidant activity.
Regarding the use of gamma-irradiation for preservation purposes, its suitability for the hygienization of T. lignosais unknown; nevertheless some studies support its effectiveness in similar doses for comparable natural matrices, including other dried medicinal and aromatic plants, without affecting their bioactive properties. Chianget al.32demonstrated that 2 kGy is
sufficient for the inactivation of enterobacteria and 6 kGy for elimination of yeasts and fungi in Polygonum multiorum Thunb. (an herb used in traditional Chinese medicine), without adversely compromising the total phenols content or the anti-oxidant potential. Likewise, Kumar et al.33concluded that an
irradiation dose up to 10 kGy is adequate to ensure the micro-biological decontamination of Indian herbs retaining their antioxidant properties. Furthermore, in the European Union, the maximum dose of gamma-irradiation approved to sanitize dried herbs is 10 kGy, assuring its decontamination.19
3.3. Phenolic compounds
Table 3a and b shows the quantied amounts of phenolic compounds in non-irradiated and irradiated samples of T. lignosa previously freeze- or shade-dried, respectively. The results are expressed as mean value of each ID for different PM, as well as the mean value of each PM, comprising results for all the assayed ID. In general, despite slight quantitative diff er-ences, the phenolic proles described herein were coherent to those previously characterized inT. lignosa.8 The most
abun-dant compounds were punicalagin isomers (compounds 1 and 3) and punicalagin gallate isomers (compounds 2 and 4) (Fig. 2), which accounted for more than 90% of the quantied phenolic compounds. In fact, T. lignosa was previously reported as an important source of this type of compounds.9 The interaction
among factors (IDPM) was again signicant (p< 0.05) in all cases; thus, no multiple comparison tests could be performed. Nevertheless, some observations can be made. In general, shade-dried samples contained lower levels of phenolic compounds than freeze-dried ones. Also a tendency to a decrease in the concentrations of phenolic compounds, espe-cially ellagitannins, was observed in the irradiated samples in relation to non-irradiated ones, which was more accused in the shade-dried samples, although the changes were not statisti-cally signicant. Signicant differences existed, however, in the levels of compounds depending on the preparation procedure (Fig. 2). With no exception, higher contents of ellagitannins,
avones and avonols were found in samples extracted by decoction than by infusion, both in shade- and freeze-dried products.
According to Khattaket al.34
the effects of gamma-irradiation on the phenolic content and antioxidant activity would be inuenced by plant type and composition, state of the sample Fig. 1 Estimated marginal mean plots representing the effect of the
preparation method on the antioxidant properties of shade-dried (A) and freeze-dried (B) samples ofT. lignosa. A – DPPH scavenging
activity; B–reducing power; C–b-carotene bleaching inhibition; D–
Table 3 a. Phenolic compounds (mg g 1) of non-irradiated and irradiatedT. lignosafreeze-dried samples. The results are presented as mean
SD. b. Phenolic compounds (mg g 1) of non-irradiated and non-irradiatedT. lignosashade-dried samples. The results are presented as meanSDa
Compound
Irradiation dose (ID) Tukey's test Preparation method (PM) t-Student's test IDPM
0 kGy 1 kGy 5 kGy 10 kGy p-Value (n¼18) Infusion Decoction p-Value (n¼36)
p-Value (n¼72)
a
(1) Punicalagin (isomer) 232 2010 219 227 0.776 154 283 <0.001 <0.001 (2) Punicalagin gallate (isomer) 2811 2514 2212 248 0.561 143 363 <0.001 <0.001 (3) Punicalagin (isomer) 475 3713 4314 4311 0.058 327 533 <0.001 <0.001 (4) Punicalagin gallate (isomer) 3313 2715 2712 289 0.520 173 413 <0.001 <0.001 (5) Luteolin-6-C-glucose-8-C-glucose 0.270.05 0.250.05 0.280.05 0.290.05 0.198 0.220.02 0.330.02 <0.001 <0.001 (6) 5-O-p-Coumaroylquinic acid 0.60.1 0.60.1 0.70.1 1.00.4 <0.001 0.80.3 0.60.1 0.001 <0.001 (7) Luteolin-8-C-glucoside 1.30.4 1.50.5 1.50.5 1.40.4 0.634 0.90.1 1.90.2 <0.001 <0.001 (8) Apigenin-8-C-glucoside 1.30.1 1.30.2 1.30.1 1.30.1 0.111 1.20.1 1.40.1 <0.001 0.025 (9) Quercetin-3-O-rutinoside 0.20.1 0.30.1 0.20.1 0.20.1 0.349 0.160.01 0.300.04 <0.001 <0.001 (10) Apigenin-6-C-glucoside 1.30.1 1.20.1 1.40.2 1.30.1 0.003 1.20.1 1.40.1 <0.001 <0.001 (11) Kaempferol-3-O-rutinoside 0.370.04 0.430.05 0.440.05 0.410.05 0.014 0.350.03 0.470.05 <0.001 <0.001 (12) Luteolin-6-C-glucoside 0.010.01 0.030.03 0.010.01 0.010.01 <0.001 nd 0.020.02 — — (13) Kaempferol-O-rhamnoside-O-rutinoside nd 0.10.1 0.10.1 0.10.1 0.002 nd 0.20.1 — — (14) Kaempferol-p
-coumaroylglucoside-glutarate
nd 0.20.2 0.10.1 0.10.1 0.001 nd 0.20.1 — —
(15) Kaempferol-p-coumaroylglucoside nd 0.10.1 0.10.1 0.10.1 0.001 nd 0.20.1 — — Phenolic acids 0.60.1 0.60.1 0.70.1 1.00.4 <0.001 0.80.3 0.60.1 0.001 <0.001 Flavonols 0.60.1 1.10.5 1.10.5 1.00.5 0.005 0.510.02 1.40.4 <0.001 <0.001
Flavones 41 41 41 41 0.680 3.50.2 5.00.3 <0.001 <0.001
Ellagitannins 13030 10952 11447 11835 0.469 7817 1584 <0.001 <0.001
b
(1) Punicalagin (isomer) 2614 173 178 1313 0.003 95 277 <0.001 <0.001 (2) Punicalagin gallate (isomer) 2113 144 1910 1313 0.086 74 276 <0.001 <0.001 (3) Punicalagin (isomer) 5020 326 3314 2424 <0.001 1912 5012 <0.001 <0.001 (4) Punicalagin gallate (isomer) 2315 155 2112 1515 0.097 74 307 <0.001 <0.001 (5) Luteolin-6-C-glucose-8-C-glucose 0.30.1 0.20.1 0.30.1 0.090.02 <0.001 0.140.04 0.30.1 <0.001 <0.001 (6) 5-O-p-Coumaroylquinic acid 1.10.2 0.70.2 0.80.2 0.60.2 <0.001 0.60.2 1.00.2 0.001 <0.001 (7) Luteolin-8-C-glucoside 11 11 11 11 0.503 0.40.2 2.00.3 <0.001 <0.001 (8) Apigenin-8-C-glucoside 1.30.1 1.20.1 1.30.1 1.20.2 0.056 1.10.1 1.30.1 <0.001 <0.001 (9) Quercetin-3-O-rutinoside 0.20.1 0.20.1 0.20.1 0.20.2 0.479 0.080.03 0.320.05 <0.001 <0.001 (10) Apigenin-6-C-glucoside 1.30.2 1.20.2 1.40.2 1.30.3 0.218 1.10.1 1.50.1 <0.001 <0.001 (11) Kaempferol-3-O-rutinoside 0.50.1 0.40.1 0.40.1 0.40.2 0.188 0.30.04 0.530.05 <0.001 <0.001 (12) Luteolin-6-C-glucoside 0.020.02 0.0020.002 0.0020.002 0.020.02 <0.001 nd 0.020.02 — — (13) Kaempferol-O-rhamnoside-O-rutinoside 0.20.2 nd nd nd — nd 0.10.1 — — (14) Kaempferol-p
-coumaroylglucoside-glutarate
0.20.2 0.10.1 0.10.1 nd 0.001 nd 0.20.1 — —
(15) Kaempferol-p-coumaroylglucoside 0.10.1 0.10.1 0.10.1 nd 0.002 nd 0.20.1 — —
14762
|
RSC
A
dv.
,2
0
15
,
5
,1
4
75
6
–
14767
Thi
s
jo
urna
l
is
©
The
Roy
al
Soc
iet
y
o
f
C
hemi
st
ry
2015
RSC
Advances
(fresh or dry), extraction solvent and procedures, and dose of gamma-irradiation. Furthermore, the irradiation treatment of plant products previously dehydrated under a selected drying method may be a strategy to maintain or improve some chem-ical or physchem-ical parameters.
In general, from the obtained results, it might be concluded that the decoction methodology is preferable to infusion, as indicated by the higher antioxidant activity and levels of phenolic compounds. Thisnding may be linked to the higher extraction yield achieved with the longer extraction time of decoction compared to infusion. However, local medicinal uses as well as healers' or selected consumers' criteria should be taken into account during the preparation and use of these herbal beverages. Indeed, infusions are commonly used for internal use while decoctions are used for external and topical application. Furthermore, T. lignosa preparations should be avoided during long-term treatments in order to prevent possible side effects or toxicity, which can vary considerably according to the preparation method, doses and physical condition of the individual.6 That is why the folk medicine
recommends specic dosages and controlled periods of intake with ritual healing practices.6
The obtained results are in agreement with those of Martins et al.,35,36who concluded that decoction preparations are
pref-erable over infusions or even hydroalcoholic extracts to achieve higher concentration of avonoids and total phenolic compounds, as well as greater antioxidant activity, from oregano and thyme plants. Vergara-Salinaset al.37reported that
for extracting phenolics from thyme with water, 100C and 5 min are appropriate operating conditions, whereas antioxidant-active non-phenolic compounds were favored at higher temperatures and exposure times. Another recent study, con-ducted by Mart´ınez-Las Heraset al.,38concluded that the drying
method (including shade- and freeze-drying) and preparation procedures have a great inuence on the stability and extract-ability of bioactive compounds from persimmon leaves. The authors showed that increasing the extraction time (up to 60 min) and temperature (from 70 C to 90 C) during water extraction of the herbal beverage increases the concentration of
avonoids and phenolic compounds. Similarly, He et al.39
studied the subcritical water extraction of phenolic compounds from pomegranate seed residues and showed that increasing the same variables (extraction time up to 30 min and temper-ature up to 220C) increases the content of these compounds.
3.4. Principal component analysis (PCA)
In Sections 3.2. and 3.3., the effects resulting from ID or PM were compared considering antioxidant properties and phenolic composition separately. Despite, some statistically signicant changes were observed in both cases, the true effects of the evaluated factors were not completely clear. Accordingly, the results for those parameters were evaluated simultaneously through principal components analysis (PCA). Chromatic parameters were not considered in this analysis since they were measured before the preparation of extracts; furthermore,
colour parameters aer decoction or infusion of herbs are less
relevant.
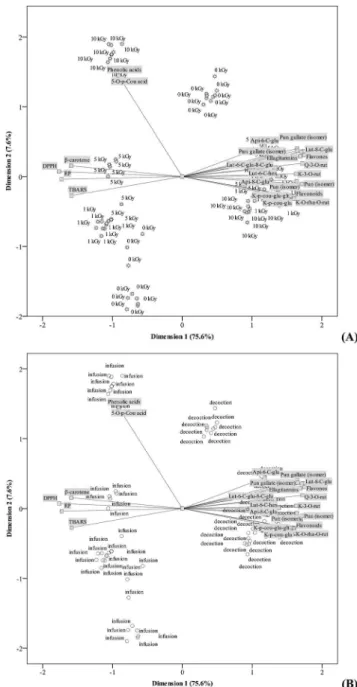
It was intended to verify if differences observed in each evaluated parameter were high enough to correlate with the dened principal components in a way that the geometric distribution of their loadings would lead to the individual clustering of each ID or PM. Regarding shade-dried samples, therst two dimensions (rst: Cronbach'sa, 17.060; eigenvalue, 0.984; second: Cronbach'sa, 2.671; eigenvalue, 0.654) accoun-ted for most of the variance of all quantied variables (74.2% and 11.6%, respectively). Groups corresponding to each gamma-irradiation dose (0 kGy, 1 kGy, 5 kGy and 10 kGy) were not individualized, as it could be hypothesized from Tables 2, 3a and b. In fact, only the group corresponding to those samples irradiated with 10 kGy and prepared by decoction (please confront Fig. 3A and B) were clearly separated from the remaining cases. The other dened groups include objects corresponding to non-irradiated and irradiated samples
distributed in a random manner. This mixed grouping did not allow to dene which of the assayed parameters better describe each one of applied ID, which might be considered as an indi-cation of the lack of signicant effects of gamma-irradiation at the assayed doses (except samples extracted by decoction and further submitted to a 10 kGy ID) on the antioxidant and phenolic proles ofT. lignosa. On the other hand, object points corresponding to each PM were clearly separated, proving that the previously highlighted signicant differences were high enough to prole each of these methodologies (Fig. 3B). In an overall analysis, it is clear that samples obtained by decoction have higher amounts of phenolic compounds as also stronger antioxidant activity, as indicated by the diametrically opposed position of their component loadings and the antioxidant activity assays object points.
Concerning freeze-dried samples, therst two dimensions (rst: Cronbach's a, 17.383; eigenvalue, 0.985; second: Cron-bach'sa, 1.739; eigenvalue, 0.444) also accounted for most of Fig. 2 HPLC profile of phenolic compounds in decoction (A) and infusion (B) ofT. lignosafreeze-dried samples irradiated with 1 kGy, recorded at 280 nm.
14764|RSC Adv., 2015,5, 14756–14767 This journal is © The Royal Society of Chemistry 2015
the variance of all quantied variables (75.6% and 7.6%, respectively). The obtained outcomes were quite similar, with no separation of object scores according to each of the applied ID (Fig. 4A). Curiously, a small group of objects was individually clustered, as it was veried in shade-dried samples. Neverthe-less, in this case, this group corresponded to non-irradiated samples prepared by decoction. This dissimilarity among samples dried using different methodologies is in agreement with the observed signicant interaction among factors (ID PM). As it can be easily deduced from Fig. 4B, object points corresponding to each PM were clearly separated. Once again,
infusions showed lower levels in phenolic compounds, as also weaker antioxidant activity.
In general, the preparation method (infusion or decoction) had higher inuence in the phenolic prole and antioxidant activity than the irradiation treatment at the applied doses. In addition, CIE colour parameters were also more sensitive to the drying method than irradiation. Differences among infusions and decoctions were signicant for all assayed parameters, while changes caused by gamma-irradiation were only signi -cant in TBARS formation inhibition, b-carotene bleaching inhibition and a few phenolic compounds. Besides their effects in individual cases, when all parameters were evaluated Fig. 3 Biplot of object scores (gamma-irradiation doses) and
component loadings (evaluated parameters) using gamma-irradiation (A) and preparation method (B) as labelling variables for shade-dried samples.
together, modications caused by the preparation method were clearly higher than those observed for gamma-irradiation. As it might be depicted from the PCA plots, object points corre-sponding to different irradiation doses were grouped arbi-trarily, while those corresponding to infusions and decoctions were completely separated. The obtained results indicate that the decoction should be the preferable choice to prepare beverages from this plant, in order to obtain the higher anti-oxidant activity and phenolic content. Furthermore, the gamma-irradiation treatment (up to 10 kGy), if applied as a preservation technology, will not signicantly affect the anti-oxidant properties of dried T. lignosa samples. Nevertheless, other studies are of interest to evaluate the preservation eff ec-tiveness of this technology.
Acknowledgements
The authors are grateful to PRODER research project no. 53514, AROMAP, fornancial support of the work and to the Foun-dation for Science and Technology (FCT, Portugal) fornancial support to CIMO (PEst-OE/AGR/UI0690/2011), J. Pinela (SFRH/ BD/92994/2013), J.C.M. Barreira (SFRH/BPD/72802/2010) and L. Barros (research contract). The GIP-USAL isnancially sup-ported by the Consolider-Ingenio 2010 Programme (FUN-C-FOOD, CSD2007-00063).
References
1 R. Guimar˜aes, L. Barros, M. Duenas, R. C. Calhelha,˜ A. M. Carvalho, C. Santos-Buelga, M. J. R. P. Queiroz and I. C. F. R. Ferreira,Food Chem., 2013,136, 947–954. 2 C. L. Roriz, L. Barros, A. M. Carvalho, C. Santos-Buelga and
I. C. F. R. Ferreira,Food Res. Int., 2014,62, 684–693. 3 M. R. Barroso, L. Barros, M. Due˜nas, A. M. Carvalho,
C. Santos-Buelga, I. P. Fernandes, M. F. Barreiro and I. C. F. R. Ferreira,Ind. Crops Prod., 2014,53, 330–336. 4 A. Martins, L. Barros, A. M. Carvalho, C. Santos-Buelga,
I. P. Fernandes, M. F. Barreiro and I. C. F. R. Ferreira,Food Funct., 2014,5, 1091–1100.
5 S. Castroviejo and F. Iberica, Plantas vasculares de la Peninsula Iberica e Islas Baleares, Consejo Superior de Investigaciones Cienticas, Real Jardin Botanico, Madrid, 2005, vol. III.
6 A. M. Carvalho, Persistence of Wild Food and Wild Medicinal Plant Knowledge in a North-Eastern Region of Portugal, in Ethnobotany in the New Europe: People, Health and Wild Plant Resources, Berghahn Books, ed. M. Pardo de Santayana, A. Pieroni and R. Puri, Oxford, UK, 2013, pp. 147–171.
7 S. Martin-Arag´on, J. Benedi and A. Villar,Int. J. Pharmacogn., 1994,32, 27–32.
8 J. Pinela, L. Barros, M. Due˜nas, A. M. Carvalho, C. Santos-Buelga and I. C. F. R. Ferreira, Food Chem., 2012, 135, 1028–1035.
9 L. M. Bedoya, M. J. Abad, S. Sanchez-Palomino, J. Alcami and P. Bermejo,Phytomedicine, 2010,17, 69–74.
10 B. Darfour, S. Agbenyegah, D. O. Ofosu, A. A. Okyere and I. K. Asare,Radiat. Phys. Chem., 2014,102, 153–158. 11 C. Pereira, R. C. Calhelha, A. L. Antonio, M. J. R. P. Queiroz,
L. Barros and I. C. F. R. Ferreira, Innovative Food Sci. Emerging Technol., 2014,26, 271–277.
12 F. Aouidi, H. Ayari, H. Ferhi, S. Roussos and M. Hamdi,Food Chem., 2011,127, 1105–1113.
13 H. Machhour, I. El Hadrami, B. Imziln, M. Mouhib and M. Mahrouz,Radiat. Phys. Chem., 2011,80, 604–607. 14 UNEP, Montreal Protocol on Substances that Deplete the
Ozone Layer, Report of the Methyl Bromide Technical Options Committee. Nairobi, Kenya, United Nations Environment Programme, 2006.
15 A. Rawson, A. Patras, B. K. Tiwari, F. Noci, T. Koutchma and N. Brunton,Food Res. Int., 2011,44, 1875–1887.
16 WHO, High-dose irradiation: Wholesomeness of food irradiated with doses above 10 kGy, Report of a joint FAO/ IAEA/WHO study group, WHO technical Report Series 890, World Health Organization, Geneva, Switzerland, 1999. 17 ICGFI, Facts about Food Irradiation: A series of Fact Sheets
from the International Consultative Group on Food Irradiation, International Consultative Group on Food Irradiation, Vienna, Austria, 1999.
18 H.-W. Wen, M.-F. Hsieh, Y.-T. Wang, H.-P. Chung, P.-C. Hsieh, I.-H. Lin and F.-I. Chou, J. Hazard. Mater., 2010,176, 280–287.
19 Directive 1999/3/EC, Off. J. Eur. Communit., 1999, 66, 24–25. 20 FDA, 21CFR 179, Irradiation in the production, processing and handling of food, Revised as of April 1, Federal Registration, 2012.
21 ASTM, Practice for using the Fricke reference standard dosimetry system, ASTM E1026. Annual book of ASTM standards, 12.02, American Society for Testing and Materials, Philadelphia, PA, 1992.
22A. Fernandes, A. L. Antonio, J. C. M. Barreira, M. L. Botelho,ˆ M. B. P. P. Oliveira, A. Martins and I. C. F. R. Ferreira,Food Bioprocess Technol., 2013,6, 2895–2903.
23 D. Argyropoulos and J. M¨uller,J. Appl. Res. Med. Arom. Plant., 2014,1, 15–22.
24 M. Rahimmalek and S. A. H. Goli,Ind. Crops Prod., 2013,42, 613–619.
25 C. Jo, J. H. Son, M. G. Shin and M.-W. Byun,Radiat. Phys. Chem., 2003,67, 143–148.
26 B. Sturm, A.-M. N. Vega and W. C. Hofacker,Appl. Therm. Eng., 2014,62, 455–460.
27 M. Carocho, A. L. Antonio, L. Barros, A. Bento, M. L. Botelho, I. Kaluska and I. C. F. R. Ferreira,Food Chem. Toxicol., 2012,
50, 3452–3455.
28 P. R. Hussain, S. Chatterjee, P. S. Variyar, A. Sharma, M. A. Dar, A. M. Wani and J. Food Compos,Analyst, 2013,
30, 59–66.
29 M. B. P´erez, S. A. Banek and C. A. Croci,Food Chem., 2011,
126, 121–126.
30 M. B. Mustapha, M. Bousselmi, T. Jerbi, N. B. Betta¨ıeb and
S. Fattouch,Food Chem., 2014,154, 230–237.
31 K.-H. Kim and H.-S. Yook,Radiat. Phys. Chem., 2009,78, 414– 421.
14766|RSC Adv., 2015,5, 14756–14767 This journal is © The Royal Society of Chemistry 2015
32 Y.-C. Chiang, G.-J. Huang, Y.-L. Ho, P.-C. Hsieh, H.-P. Chung, F.-I. Chou and Y.-S. Chang,Process Biochem., 2011,46, 777– 782.
33 S. Kumar, S. Gautam, S. Powar and A. Sharma,Food Chem., 2010,119, 328–335.
34 K. F. Khattak, T. J. Simpson and Ihasnullah, Food Chem., 2008,110, 967–972.
35 N. Martins, L. Barros, C. Santos-Buelga, M. Henriques, S. Silva and I. C. F. R. Ferreira,Food Chem., 2014,158, 73–80.
36 N. Martins, L. Barros, C. Santos-Buelga, S. Silva, M. Henriques and I. C. F. R. Ferreira, Food Chem., 2015,
167, 131–137.
37 J. R. Vergara-Salinas, J. P´erez-Jim´enez, J. L. Torres, E. Agosin and J. R. Pe´erez-Correa,J. Agric. Food Chem., 2012,60, 10920– 10929.
38 R. Mart´ınez-Las Heras, A. Heredia, M. L. Castell´o and
A. Andres,Food Biosci., 2014,6, 1–8.