Agronomic Evaluation of a Fertilizer with D-CODER
Technology: A New Mechanism for the Slow
Release of Nutrients
M. Arrobas
1*, and M. Ângelo Rodrigues
1ABSTRACT
D-CODER is a fertilizer with a new slow-release mechanism consisting of an organo-mineral matrix that releases the nutrients only in the presence of growing plants. Pot and field experiments were carried out to study the release pattern of N from D-CODER. The experiments included grown and bare soil plots. The fertilizer treatments were D-CODER, ammonium nitrate (ANpreplant), and the control. A fourth treatment was added to the cultivated plots, consisting of splitting the ammonium nitrate application of 25% at preplant and 75% as top-dressing (ANsplit). In the bare soil pots, 35 days after the fertilizer application (DAFA), NO3-N concentrations in the extracts of anion exchange
membranes incubated in the soil for ANpreplant, D-CODER, and the control treatments were 118.5, 82.5 and 34.5 mg L-1, respectively, suggesting that part of N from D-CODER
had not yet been released. In the pots cultivated with ryegrass, 209 DAFA, N recoveries for D-CODER, ANpreplant, and control treatments were 0.94, 0.86 and 0.20 g pot-1, respectively, suggesting that in the presence of the growing plants the release of N from D-CODER had not been restricted. Furthermore, soil NO3-N levels in the bare soil plots of
the field experiment were significantly higher in D-CODER (38.1 and 6.8 mg kg-1 on November and March) in comparison to ANpreplant (26.3 and 5.1 mg kg-1 on Nov. and
March) treatments, suggesting that N from D-CODER was better protected from leaching. In the absence of growing plants, D-CODER provided some protection of N at least until 65 DAFA. In cultivated soils, it seemed less effective, particularly if the risk of nitrate leaching persisted for a long period of time. In these situations, a split application of N was a better strategy.
Keywords: Anion exchange membranes, Nutrient bioavailability, Rhizosphere-controlled fertilizers, Slow-release fertilizers.
_____________________________________________________________________________
1 Mountain Research Centre (CIMO), Polytechnic Institute of Bragança, Ap 1172, 5301-855 Bragança,
Portugal.
*Corresponding author; e-mail: [email protected]
INTRODUCTION
Losses of nitrates from agriculture to groundwater and release of several hazardous N gases into the atmosphere,
particularly nitrous oxide (N2O), are major
environmental concerns associated with agricultural activities (Smil, 2001). One approach receiving attention to mitigate the problem has been the use of slow- and controlled-release fertilizers (Guertal, 2000;
Carreres et al., 2003) and nitrification and
urea hydrolysis inhibitors (Macadam et al.,
2003; Di and Cameron, 2005) as a means of increasing N use efficiency.
polymers, which gradually release the nutrients into the soil solution (Trenkel, 2010). The nitrification inhibitors act on Nitrosomonas, which slows the oxidation of
NH4+ to NO2- during nitrification, and
extends the presence of the ammoniacal form in soil. Urease inhibitors, in turn, retard the hydrolysis of urea (Trenkel, 2010). Slow- and controlled-release fertilizers may
have advantages over conventional
fertilizers in environments of difficult N management, such as in flooded rice fields
(Carreres et al., 2003), sandy soils (Guertal,
2000), nurseries, pots and containers (Walker and Huntt, 1999;
Fernández-Escobar et al., 2004; Oliet et al., 2004) and
vegetated roofs (Emilsson et al., 2007), or
when a part of N fertilizer is applied at
preplant (Malakouti et al., 2008).
Nitrification inhibitors may improve crop
productivity (Pasda et al., 2001), but they
have usually been proposed as a means of
reducing N2O emissions to the atmosphere
during nitrification and subsequent
denitrification (Linzmeier et al., 2001;
Macadam et al., 2003; Hatch et al., 2005)
and nitrate leaching (Williamson et al.,
1998; Di and Cameron, 2005). Urease inhibitors, in turn, can be effective in reducing N losses by ammonia volatilization
(Zaman et al., 2009).
A new range of fertilizers which control the bioavailability of nutrients in the soil have been developed by Timac
AGRO-INABONOS (Erro et al., 2007b). The
nutrients are present in a water-soluble fraction and also in a fraction not soluble in water but soluble in organic acids. The fertilizer retains the insoluble fraction of the nutrients in a molecular matrix where the nutrients are inserted. The matrix consists of metallic phosphates prepared in the presence of a humic acid: metal-humic phosphates
(Erro et al., 2007b). The nutrients are made
available as the matrix disintegrates by the action of rhizospheric organic acids released by plants and microorganisms. The fertilizers with such a mechanism were
classified as rhizosphere-controlled
fertilizers (Erro et al., 2007a). From a
theoretical point of view, it seems to be a very significant forward step within the group fertilisers that restrict nutrient availability, since the nutrients will be available only in the presence of growing plants. The rhizosphere-controlled fertilizers are sold as compound fertilizers under the
commercial trade D-CODER (Erro et al.,
2007b).
Taking into account that D-CODER fertilizers are currently on the market, it is of interest to test their agronomic performances under field conditions. Thus, the objective of this work was to examine the release pattern of nitrogen from a D-CODER fertilizer in field and pot experiments and also in bare soil and in the presence of growing plants. The performance of D-CODER will be compared with a conventional fertilizer, whose nutrients are fully available after soil application, and a non-fertilized control. Measurements included soil inorganic-N, plant N nutritional status indices, dry matter
yield and plant N recovery
.
MATERIALS AND METHODS
Pot Experiments
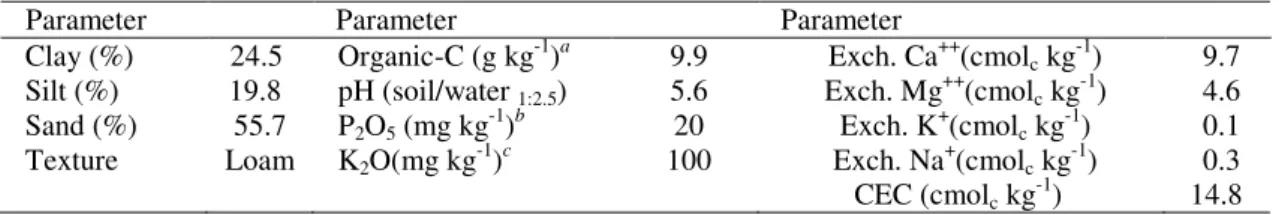
The soil used for pot experiments was collected near the location the field experiments were carried out. The soil was sieved (6 mm mesh) and dried at 40ºC. Selected soil physical and chemical properties are presented in Table 1.
Pots filled with 15 kg of dry soil were subjected to three fertilizer treatments, and organized as three independent experiments with reference to how the soil N availability was monitored. Each treatment included six replications (6 pots). The fertilizer treatments consisted of: (1) D-CODER
(Timac AGRO-INABONOS, European
Patent EP 1612200), a NPK compound
fertilizer with 20% N (2.5% NH4-N and
17.5% urea-N), 7% P2O5 and 10% K2O; (2)
Table 1. Selected physical and chemical soil properties.
Parameter Parameter Parameter
Clay (%) 24.5 Organic-C (g kg-1)a 9.9 Exch. Ca++(cmol
c kg-1) 9.7
Silt (%) 19.8 pH (soil/water 1:2.5) 5.6 Exch. Mg++(cmolc kg-1) 4.6
Sand (%) 55.7 P2O5 (mg kg-1)b 20 Exch. K+(cmolc kg-1) 0.1
Texture Loam K2O(mg kg-1)c 100 Exch. Na+(cmolc kg-1) 0.3
CEC (cmolc kg-1) 14.8
a Walkley-Black, b, c Egner-Rhiem.
Table 2. Sequential steps and activities carried out on pot experiments from March 31st 2009 to August 19th
2010.
Apr Jun Aug Oct Mar Aug
Mar May Jul Sep Dec Jul
31 1 4 1 4 6 26 2 5 17 16 17 16 3 3 19 19
Pot experiment 1 a c c c c c b d d d d d
Pot experiment 2 a b d d d d
Pot experiment 3 a b d f c c c b d d d d d
(a) Mixture of soil and fertilisers; (b) Ryegrass sowing; (c) AEM removed; (d) Ryegrass cut, (f) Glyphosate application.
was equivalent to 75 mg kg-1 dry soil. The pots
of ANpreplant and control treatments were supplemented with superphosphate 18% and potassium chloride to balance phosphorus (P) and potassium (K) levels with D-CODER treatment. The three experiments subjected to the above-mentioned treatments were: (1) bare soil, where the soil nitrate levels were monitored by anion exchange membranes (AEM) inserted directly into the soil; (2)
ryegrass (Lolium multiflorum Lam.), where
soil N availability was determined by plant N recovery through sequential cuts during the growing season; and (3) ryegrass, grown for 62 days until the first cut, followed by the application of a non-selective
glyphosate-based herbicide (N-(phosphonomethyl)
glycine; 360 g L-1 of active ingredient, applied
at the rate of 1 L ha-1), and soil nitrate levels
monitored by AEM. In experiments 1 and 3, after a long period of monitoring soil nitrate levels, ryegrass was sown (reseed in experiment 3) at 170 days after the fertiliser application (DAFA), which was followed by two cuts of biomass.
The pot experiments started on March 31, 2009, with the mixture of soil and fertilizer. On April 1, ryegrass was sown in the experiments 2 and 3. Thereafter, several cuts
of ryegrass and incubation periods of AEM were carried out. The sequence for those steps is presented in Table 2.
The pots were kept under a sheet of corrugated asbestos cement to avoid the direct incidence of precipitation that could have reduced soil aeration and also an excessive exposure to sunlight that could have overheated the soil. The pots were regularly watered with distilled water to allow plant growth and soil microbial activity.
The AEM methodology consisted of the burial of 1 by 2 cm AEM strips directly into the soil at a depth of 10 cm and kept under incubation for a period of five days. After being removed from the soil, the AEM were washed thoroughly with distilled water and
subsequently eluted in 20 ml 0.5M HCl
(Rodrigues et al., 2006; Arrobas et al.,
2011). The AEM were regenerated in 0.5M
NaHCO3 for reuse. Nitrate concentrations in
the AEM extracts were determined by
UV-visible spectrophotometry (Clesceri et al.,
0 5 10 15 20 25 30 35 40 0 50 100 150 200 250
O N D J F M A M J J A S
M e a n t e m p e r a tu r e ( ⁰⁰⁰⁰ C ) M o n th ly p r e c ip it a ti o n ( m m ) Precipitation Temperature 0 5 10 15 20 25 30 35
16 19 22 25 28 31 3 6 9 12 15 18
D a il y p r e c ip it a ti o n ( m m )
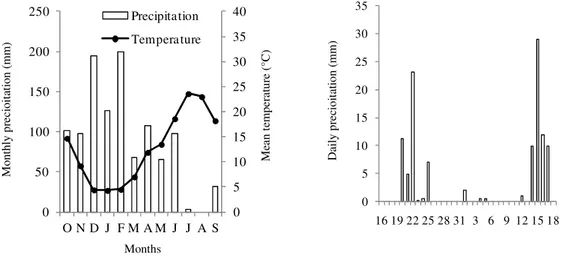
Figure 1. Cumulative monthly precipitation and average air temperature between October 2009 and
September 2010 (Left) and daily rainfall from October 16 to November 18, 2009 (Right).
Field Experiments
The experiments were conducted in the Sta Apolónia farm in Bragança (41º49’N, 6º46’W), NE Portugal, in a Eutric Cambisol, whose main properties are presented in
Table1. The cumulative monthly
precipitation and average air temperature during the experimental period as well as the daily precipitation in the period between October 16 and November 18, 2009 are presented in Figure 1.
Two independent experiments were
carried out. In one of the experiments, the
fertilizer treatments were applied to a winter forage crop and in the other the soil was kept uncultivated for the autumn/winter growing season. The experiments started on October 16, 2009. The winter forage received four fertilizer treatments: D-CODER, applied at
preplant (100 kg N ha-1); ammonium nitrate
applied at preplant (100 kg N ha-1)
(ANpreplant); ammonium nitrate split into
two applications (25 kg N ha-1 at preplant
and 75 kg N ha-1 as topdress in March 31,
2010) (ANsplit); and the control, with no N added. The experiment on the bare soil did not receive the ANsplit treatment. Both experiments were arranged as completely randomized designs with three replications. As D-CODER is a compound NPK
fertilizer, the P and K rates of the other
treatments were balanced with
superphosphate 18% and potassium
chloride. In the uncultivated plots, weeds were controlled with two applications of glyphosate on November 12, 2009, and March 31, 2010. Soil nitrate levels were monitored in both experiments on November 19, 2009, and March 26, 2010. Soil samples were taken from the 0-20 cm layer and frozen until analysis. Inorganic-N was
extracted using 20 g soil and 40 ml 2 M KCl,
shaking for an hour and filtering through a Whatman 42 filter paper. The extracts were
analyzed for NH4+ and NO3- by UV-Vis.
spectrophotometry. Plant N recovery was determined for the winter forage from
samples taken (from 0.25 m2) on March 30
and May 26, 2010, after drying at 70ºC, ground and analyzed for total N.
On June 7, 2010, maize (Zea mays L.) was
sown both in the experiment previously cropped with the winter forage and in the experiment where the soil was kept uncultivated during the winter. Maize was sown with a precision vacuum seeder after seed-bed preparation by chisel plough and roller. A solid set sprinkler system irrigated the crop during the growing season. Nitrogen nutritional status of maize was monitored with the portable SPAD-502
0 40 80 120 160
0 30 60 90 120 150 180
N
O3
-N
i
n
A
E
M
e
x
tr
a
c
ts
(
m
g
/l
)
Days after fertilisers application
a)
AN D-Coder Control
0.0 0.2 0.4 0.6 0.8 1.0 1.2
0 100 200 300 400 500
N
r
e
c
o
v
e
r
y
(
g
/p
o
t)
Days after fertilisers application
b)
AN D-Coder Control
Figure 2. (a) Nitrate concentrations in anion exchange membranes (AEM) extracts during the initial period
where the pots were kept uncultivated, and (b) Nitrogen recovered by ryegrass in the cuts performed from 209 to 476 DAFA in the second part of experiment 1. Error bars indicate confidence limits for the mean ( < 0.05).
chlorophyll meter (Minolta, Japan) on July 24 and Aug. 26, 2010. Soil inorganic-N levels were determined on July 7, 2010. At harvest, the stalk nitrate test was also
performed as proposed by Binford et al.
(1990). Dry matter yield and N recovery
were determined from field samples of 1 m2.
Data analysis was carried out using JMP
statistical software. After ANOVA
examination, the means with significant differences ( < 0.05) were separated by the Tuker–Kramer HSD test.
RESULTS
Pot Experiments
In the bare soil pots, soil nitrate levels were significantly higher ( < 0.05) in ANpreplant in comparison with D-CODER for the first two sampling dates (Figure 2a). Following 93 DAFA, soil nitrate levels remained the highest in ANpreplant pots, but they were not significantly different than that of D-CODER. Soil nitrate levels in control pots were always significantly lower than those in the fertilized treatments. Nitrogen recovery in the sequential cuts of ryegrass at 209 to 476 DAFA was consistently higher in D-CODER in comparison with the other treatments
(Figure 2b). In control pots, significantly less N was recovered than in fertilized treatments from the second cut at 247 DAFA.
In the pots sown with ryegrass, N recovery in the D-CODER treatment was significantly higher than that of ANpreplant from the sampling date of 87 DAFA (Figure 3). In the last sampling date (209 DAFA), N recovery in the D-CODER treatment was 0.94 to 0.86
g pot-1 higher than ANpreplant. In the
control pots, N recovery was lower than that of the fertilized treatments from the first cut in 62 DAFA.
In the pots where the ryegrass was controlled with glyphosate after the first cut, nitrate concentrations in AEM extracts were not significantly different in the fertilized treatments (Figure 4-a). In the control pots, soil nitrate levels and N recovery were always very low in comparison with fertilized treatments. Nitrogen recovery in the above-ground biomass was higher in D-CODER than in ANpreplant, but the means were only statistically significant at 247 and 317 sampling dates (Figure 4-b).
Field Experiments
On November 19, soil NO3-N levels in the
cultivated plots were significantly higher
Days after fertilisers application
Days after fertilisers application
N
O3
-N
in
A
E
M
e
xt
ra
ct
s
(m
gl
-1)
N
r
ec
ov
er
y
(g
p
ot
0.0 0.2 0.4 0.6 0.8 1.0 1.2
0 30 60 90 120 150 180 210 240
N
r
e
c
o
v
e
r
y
(
g
/p
o
t)
Days after fertilisers application AN D-Coder Control
Figure 3. Nitrogen recovered by ryegrass in
five cuts performed between sowing and 209 days after fertilizer application. Error bars indicate confidence limits for the mean ( < 0.05).
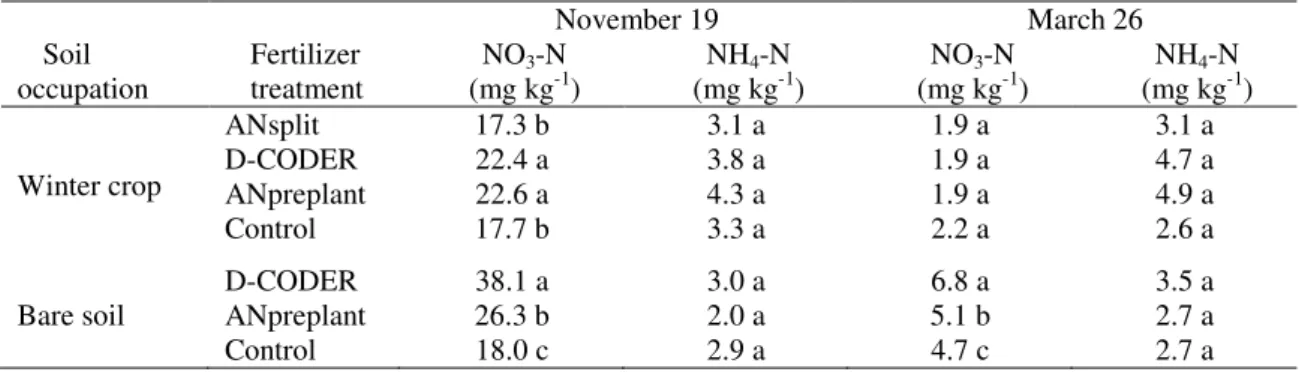
Table 3. Soil inorganic-N in November and March in the winter-cultivated plots and in those kept as bare
soil through the application of a glyphosate-based herbicide.
November 19 March 26
Soil occupation
Fertilizer treatment
NO3-N
(mg kg-1)
NH4-N
(mg kg-1)
NO3-N
(mg kg-1)
NH4-N
(mg kg-1)
Winter crop
ANsplit 17.3 b 3.1 a 1.9 a 3.1 a
D-CODER 22.4 a 3.8 a 1.9 a 4.7 a
ANpreplant 22.6 a 4.3 a 1.9 a 4.9 a
Control 17.7 b 3.3 a 2.2 a 2.6 a
D-CODER 38.1 a 3.0 a 6.8 a 3.5 a
Bare soil ANpreplant 26.3 b 2.0 a 5.1 b 2.7 a
Control 18.0 c 2.9 a 4.7 c 2.7 a
Mean values followed by the same letter in columns, within each soil occupation, are not significantly different by Tukey-Kramer HSD test ( <0.05).
( < 0.05) in ANpreplant and D-CODER treatments in comparison with ANsplit and the control (Table 3). From November to
March, soil NO3-N levels decreased and no
significant differences were found among treatments on the last date. November and
March soil NO3-N levels in the bare soil
plots were significantly higher in D-CODER than in ANpreplant (Table 3). In the control
plots, soil NO3-N levels were lower
compared to the fertilized treatments. No significant differences were found in soil
NH4-N levels among treatments in any
sampling date.
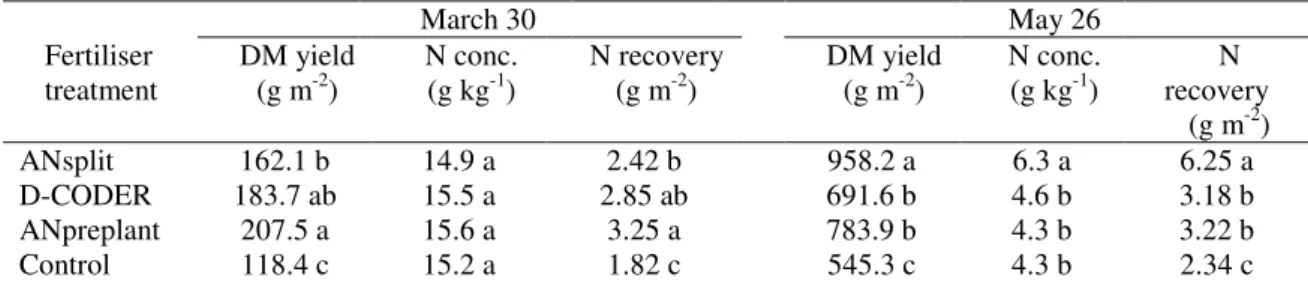
Mean dry matter yields and N recoveries by winter forage from March sampling were slightly higher in ANpreplant in comparison to D-CODER (Table 4. The mean values of ANsplit were significantly lower than that of ANpreplant. On the contrary, mean dry matter yields and N recoveries from May sampling were significantly higher in ANsplit than in any of the other fertilized treatments. The mean dry matter yield and N recovery values of the control treatments were significantly lower than that of the fertilized treatments.
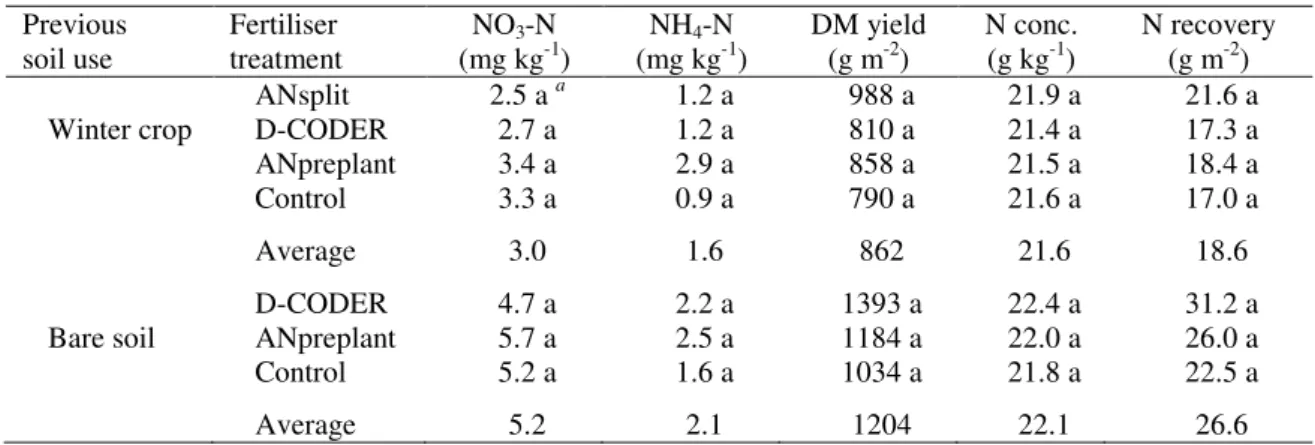
No significant treatment differences were noted in maize analyses (soil inorganic-N, stalk nitrate test, SPAD readings, dry matter yield and N recovery) (Table 5). During the maize growing season, soil nitrate levels, dry matter yields, and N recoveries in the plots previously kept as bare soil were higher than the cultivated ones.
DISCUSSION
The pot experiments demonstrated that D-CODER was able to restrict N release in the absence of growing plants, since soil nitrate levels in D-CODER pots were significantly lower than that recorded in ANpreplant until 65 DAFA. Even in the further analyses performed at 93, 127 and 169 DAFA, soil nitrate levels in D-CODER never reached the values recorded in ANpreplant, suggesting that a little fraction of N persisted and was not Days after fertilisers application
N
r
ec
ov
er
y
(g
p
ot
0 30 60 90 120 150
0 30 60 90 120 150 180
N
O3
-N
i
n
A
E
M
e
x
tr
a
c
ts
(
m
g
/l
)
Days after fertilisers application
a)
AN D-Coder Control
0.0 0.3 0.6 0.9 1.2 1.5
0 100 200 300 400 500
N
r
e
c
o
v
e
r
y
(
g
/p
o
t)
Days after fertilisers application
b)
AN D-Coder Control
Figure 4. (a) Nitrate concentrations in anion exchange membranes (AEM) extracts in experiment 3, that
started with the sown ryegrass which was controlled with glyphosate after the first cut, and (b) nitrogen
recovered in the above-ground biomass in the first cut and in several other cuts performed after the reseeding of the ryegrass. Error bars indicate confidence limits for the mean ( < 0.05).
Table 4. Dry matter yield, tissue N concentration and N recovery by the winter crop on March and May as a function of fertilizer treatment.
March 30 May 26
Fertiliser treatment
DM yield
(g m-2) N conc. (g kg-1) N recovery (g m-2) DM yield (g m-2) N conc. (g kg-1) recovery N
(g m-2)
ANsplit 162.1 b 14.9 a 2.42 b 958.2 a 6.3 a 6.25 a
D-CODER 183.7 ab 15.5 a 2.85 ab 691.6 b 4.6 b 3.18 b
ANpreplant 207.5 a 15.6 a 3.25 a 783.9 b 4.3 b 3.22 b
Control 118.4 c 15.2 a 1.82 c 545.3 c 4.3 b 2.34 c
Mean values followed by the same letter are not significantly different by Tukey-Kramer HSD test ( < 0.05).
released in bare soils. The results of the field experiments showed that November soil nitrate levels were higher in D-CODER than in ANpreplant plots. However, the results of pot and field experiments are not necessarily contradictory, they may be explained by heavy precipitation (60 mm) occurring in the week preceding soil sampling (Figure 1). Thus, it seems that N from D-CODER was better protected from leaching in comparison to that of ammonium nitrate, which in that period would have been entirely in the nitrate form. Nitrogen protection from leaching by D-CODER technology was demonstrated from
the early work of Erro et al. (2007a). March
soil nitrate levels were much lower than November levels, likely due to the heavy rains that fell in December, January, and February,
which created favourable conditions for N losses from leaching (Mulla and Strock, 2008) and/or biological denitrification (Coyne,
2008). Soil NH4-N levels were always low and
no significant differences were found among treatments. Nitrification may occur very
quickly, limiting NH4+ accumulation in soil, as
recorded by Rodrigues (2004) from an incubation experiment conducted in similar agro-ecological conditions.
In the cultivated pots, N recovered by ryegrass was significantly higher in D-CODER than ANpreplant treatments. In the presence of growing plants, D-CODER did not restrict N release, which is in accordance with
product advertising (Erro et al., 2007b). In
addition, the higher values of N recovery in D-CODER pots may mean that soil N losses Days after fertilisers application Days after fertilisers application Days after fertilisers application
N
r
ec
ov
er
y
(g
p
ot
-1 )
N
O3
-N
in
A
E
M
e
xt
ra
ct
s
(m
gl
Table 5. Soil inorganic-N, dry matter yield, tissue N concentration, and N recovery by maize as a function of fertilizer treatments and previous soil use.
Previous soil use
Fertiliser treatment
NO3-N
(mg kg-1) (mg kgNH4-N -1) DM yield (g m-2) N conc. (g kg-1) N recovery (g m-2)
ANsplit 2.5 aa 1.2 a 988 a 21.9 a 21.6 a
Winter crop D-CODER 2.7 a 1.2 a 810 a 21.4 a 17.3 a
ANpreplant 3.4 a 2.9 a 858 a 21.5 a 18.4 a
Control 3.3 a 0.9 a 790 a 21.6 a 17.0 a
Average 3.0 1.6 862 21.6 18.6
D-CODER 4.7 a 2.2 a 1393 a 22.4 a 31.2 a
Bare soil ANpreplant 5.7 a 2.5 a 1184 a 22.0 a 26.0 a
Control 5.2 a 1.6 a 1034 a 21.8 a 22.5 a
Average 5.2 2.1 1204 22.1 26.6
a Mean values followed by the same letter in columns, within each previous soil use (winter crop or bare
soil), are not significantly different by Tukey-Kramer HSD test ( < 0.05).
were reduced. The slow release of N from D-CODER may have lowered the nitrification rate and consequently the accumulation of
NO3- in soil, which are conditions that can
reduce N losses during nitrification (Norton, 2008) and biological denitrification (Coyne, 2008). In the field, differences in soil nitrate levels between D-CODER and ANpreplant were not significant, likely due to the heavy rainfall that occurred in the week before sampling. Dry matter yields and N recoveries in winter forage were also similar in D-CODER and ANpreplant treatments. Dry matter yields and N recoveries in the final harvest in May were significantly higher in ANsplit than in any of the other treatments. It is well-known that splitting the N rate is one of the best ways to increase N use efficiency
(Havlin et al., 2005; Raun and Schepers,
2008). The field results may also suggest that plant root activity solubilized N from D-CODER that was not readily absorbed by plants and, subsequently, leached out or denitrified.
In the pots where ryegrass was sown (or reseeded) after a long period of bare soil, N recovery was slightly higher in D-CODER than in ANpreplant pots, but the mean values were not statistically different. The results are attributed to greater N losses during nitrification and denitrification in ANpreplant pots, as discussed above. The results from the pots kept uncultivated suggest the presence of
a persistent N fraction in D-CODER fertilizer that was not available in the absence of plants. It was probably the solubilization of this persistent fraction that explains the slight increase of N recovery observed in D-CODER pots in the experiment consisting of the late sown (or reseeded) ryegrass. Trends observed in the pots of late sowing were not confirmed in maize, probably due to the largest experimental variability and N losses during winter from all plots. Maize dry matter yields and N recoveries were higher in the plots kept uncultivated during winter in comparison with those previously cultivated with winter forage. In spite of the effect of winter rains on N losses, the residual fertility was slightly higher in the uncultivated plots.
ACKNOWLEDGMENTS
The authors thank Rita Diz and Ana Pinto for laboratory assistance and José Rocha for fieldwork. Financial support was provided by the Mountain Research Centre– Polytechnic Institute of Bragança.
REFERENCES
1. Arrobas, M., Parada, M. J., Magalhães, P. and Rodrigues, M. A. 2011. Nitrogen-use Efficiency and Economic Efficiency of Slow-release N Fertilisers Applied to Irrigated Turfs in a Mediterranean Environment. Nutr. Cycl. Agroecosyst, 89: 329–339.
2. Binford, G. D., Blackmer, A. M. and El-Hout, N. M. 1990. Tissue Test for Excess Nitrogen during Corn Production. Agron. J., 82:
124-129.
3. Clesceri, L. S., Greenberg, A. E. and Eaton, A. D. 1998. Standard Methods for the Examination of Water and Wastewater. 20th Edition, American Public Health Assocation. Washington, DC, PP. 4-415.
4. Carreres, R., Sendra, J., Ballesteros, R., Valiente, E. F., Quesada, A., Carrasco, D., Leganés, F. and Cuadra, J. G. 2003. Assessment of Slow Release Fertilizers and Nitrification Inhibitors in Flooded Rice. Biol. Fertil. Soils, 39: 80–87.
5. Coyne, M. S. 2008. Biological Denitrification. In: "Nitrogen in Agricultural Systems", (Eds.): Schepers, J. S. and Raun, W. R.. Agron. Monograph 49, ASA, CSSA, SSSA, Madison WI, PP. 201-253.
6. Di, H. J. and Cameron, K. C. 2005. Reducing Environmental Impacts of Agriculture by Using a Fine Particle Suspension Nitrification Inhibitor to Decrease Nitrate Leaching From Grazed Pastures. Agric. Ecosys. Environ.,109:
202–212.
7. Emilsson, T., Berndtsson, J. C., Mattsson, J. E. and Rolf, K. 2007. Effect of Using Conventional and Controlled Release Fertilizer on Nutrient Runoff from Various Vegetated Roof Systems. Ecol. Eng., 29: 260-271.
8. Erro, J., San Francisco, S., Urrutia, O., Yvin, J. C. and Garcia-Mina, J. M. 2007b. El Fertilizante D-CODER de Timac AGRO-INABONOS. Agricola Vergel, 1-3.
9. Erro, J., Urrutia, O., San Francisco, S. and Garcia-Mina, J. M. 2007a. Development and
Agronomic Validation of New Fertilizer Compositions of High Bioavailability and Reduced Potential Nutrient Losses. J. Agric. Food Chem., 55: 7831-7839.
10. Fernández-Escobar, R., Benlloch, M., Herrera, E. and García-Novelo J. M. 2004. Effect of Traditional and Slow-release N Fertilizers on Growth of Olive Nursery Plants and N Losses by Leaching. Sci. Hort.,101: 39-49.
11. Guertal, E. A. 2000. Preplant Slow-Release Nitrogen Fertilizers Produce Similar Bell Pepper Yields as Split Applications of Soluble Fertilizer. Agron. J., 92: 388-393.
12. Hatch, D., Trindade, H., Cardenas, L., Carneiro, J. Hawkins, J., Scholefield, D. and Chadwick, D. 2005. Laboratory Study of the Effects of Two Nitrification Inhibitors on Greenhouse Gas Emissions from a Slurry-treated Arable Soil: Impact of Diurnal Temperature Cycle. Biol. Fertil. Soils, 41:
225-232.
13. Havlin, J. L., Beaton, J. D., Tisdale, S. L. and Nelson, W. L. 2005. Soil Fertility and Fertilizers: An Introduction to Nutrient Management. 7th Edition, Pearson Prentice Hall, New Jersey, PP.515.
14. Linzmeier, W., Gutser, R. and Schmidhalter, U. 2001. Nitrous Oxide Emission from Soil And from A Nitrogen-15-labelled Fertilizer with the New Nitrification Inhibitor 3,4-Dimethylpyrazole Phosphate (DMPP). Biol. Fertil. Soils,34: 103-108.
15. Macadam, X. M. B., Prado, A., Merino, P., Estavillo, J. M., Pinto, M. and González-Murua1, C. 2003. Dicyandiamide and 3,4-dimethyl Pyrazole Phosphate Decrease N2O
Emissions from Grassland but Dicyandiamide Produces Deleterious Effects in Clover. J. Plant Physiol., 160: 1517-1523.
16. Malakouti, M. J., Bybordi, A., Lotfollahi, M., Shahabi, A. A., Siavoshi, K., Vakil, R., Ghaderi, J., Shahabifar, J., Majidi, K., Jafarnajadi, A., Dehghani, F., Keshavarz, M. H., Ghasemzadeh, M., Ghanbarpouri, R., Dashadi, M., Babaakbari, M. and Zaynalifard, N. 2008.Comparison of complete and sulfur coated urea fertilizers with pre-plant urea in ncreasing grain yield and nitrogen use efficiency in wheat. J. Agr. Sci. Technol. 10:
173-183.
18. Norton, J. M. 2008. Nitrification in Agricultural Soils. In: "Nitrogen in Agricultural Systems", (Eds.): Schepers, J. S. and Raun, W. R.. Agron. Monograph 49, ASA, CSSA, SSSA, Madison WI, PP. 173-199.
19. Oliet, J., Planelles, R., Segura, M. L., Artero, F., and Jacobs, D. F. 2004. Mineral Nutrition and Growth of Containerized Pinus halepensis Seedlings under Controlled-release Fertilizer. Sci. Hort., 103: 113-129.
20. Pasda, G., Hähndel, R. and Zerulla, W. 2001. Effect of Fertilizers with the New Nitrification Inhibitor DMPP (3,4-dimethylpyrazole Phosphate) on Yield and Quality of Agricultural and Horticultural Crops. Biol. Fertil. Soils, 34: 85-97.
21. Raun, W. R. and Schepers, J. S. 2008. Nitrogen Management for Improved Use Efficiency. In: "Nitrogen in Agricultural Systems", (Eds.): Schepers, J. S. and Raun, W. R.. Agron. Monograph 49, ASA, CSSA, SSSA, Madison, WI, PP. 675-693.
22. Rodrigues, M. A. 2004. An In situ Incubation Technique to Measure the Contribution of Organic Nitrogen to Potatoes. Agronomie, 24:
249-256.
23. Rodrigues, M. A., Pereira, A., Cabanas, J. E., Dias, L., Pires, J. and Arrobas, M. 2006. Crops Use-efficiency of Nitrogen from Manures
Permitted in Organic Farming. Europ. J. Agron., 25: 328-335.
24. Smil, V. 2001. Enriching the Earth: Fritz Haber, Carl Bosch, and the Transformation of World Food Production. Massachusetts Institute of Technology, PP.338.
25. Trenkel, M. E. 2010. Slow-and Controlled-release and Stabilized Fertilizers. An Option for Enhancing Nutrient Use Efficiency in Agriculture. International Fertilizer Industry Association, Paris, France, PP.160.
26. Walker, R. F. and Huntt, C. D. 1999. Growth and Nutrition of Containerized Single Leaf Pinyon Seedlings in Response to Controlled Release Fertilization. Arid Soil Res. Rehabil.,
13: 123-132.
27. Williamson, J. C., Taylor, M. D., Torrens, R. S. and Vojvodic-Vukovic, M. 1998. Reducing Nitrogen Leaching from Dairy Farm Effluent-Irrigated Pasture Using Dicyandiamide: A Lysimeter Study. Agric. Ecosys. Environ., 69:
81-88.
28. Zaman, M., Saggar, S., Blennerhassett, J. D. and Singh, J. 2009. Effect of Urease and Nitrification Inhibitors on N Transformation, Gaseous Emissions of Ammonia and Nitrous Oxide, Pasture Yield and N Uptake in Grazed Pasture System. Soil Biol. Biochem.,41:
1270-1280.