NITROUS OXIDE AND METHANE FLUXES IN SOUTH
BRAZILIAN GLEYSOL AS AFFECTED BY NITROGEN
FERTILIZERS
(1)Josiléia Acordi Zanatta(2), Cimélio Bayer (3), Frederico C.B. Vieira(4), Juliana Gomes(5) & Michely Tomazi(5)
SUMMARY
Nitrogen fertilizers increase the nitrous oxide (N2O) emission and can reduce
the methane (CH4) oxidation from agricultural soils. However, the magnitude of
this effect is unknown in Southern Brazilian edaphoclimatic conditions, as well as the potential of different sources of mineral N fertilizers in such an effect. The aim of this study was to investigate the effects of different mineral N sources (urea, ammonium sulphate, calcium nitrate, ammonium nitrate, Uran, controlled- release N fertilizer, and urea with urease inhibitor) on N2O and CH4 fluxes from Gleysol in
the South of Brazil (Porto Alegre, RS), in comparison to a control treatment without a N application. The experiment was arranged in a randomized block with three replications, and the N fertilizer was applied to corn at the V5 growth stage. Air samples were collected from a static chambers for 15 days after the N application and the N2O and CH4 concentration were determined by gas chromatography.
The topmost emissions occurred three days after the N fertilizer application and ranged from 187.8 to 8587.4 μg m-2 h-1 N. The greatest emissions were observed for
N-nitric based fertilizers, while N sources with a urease inhibitor and controlled release N presented the smallest values and the N-ammonium and amidic were intermediate. This peak of N2O emissions was related to soil NO3--N (R2 = 0.56,
p < 0.08) when the soil water-filled pore space was up to 70 % and it indicated that N2O was predominantly produced by a denitrification process in the soil. Soil CH4
fluxes ranged from -30.1 μg m-2 h-1 C (absorption) to +32.5 μg m-2 h-1 C (emission),
and the accumulated emission in the period was related to the soil NH4+-N
concentration (R2 = 0.82, p < 0.001), probably due to enzymatic competition between
nitrification and metanotrophy processes. Despite both of the gas fluxes being
(1) Part of thesis presented by first author to obtain Soil Science Doctoral degree in Post Graduation Program of Soil Science of
Federal University of Rio Grande do Sul. Received for publication in November 2009 and approved in July 2010.
(2) Researcher of Embrapa Western Region Agriculture, CEP 79804-970 Dourados (MS). E-mail: josileia@cpao.embrapa.br (3) Professor of the Department of Soil science, UFRGS, CNPq researcher, CEP 91540-000 Porto Alegre (RS). E-mail:
cimelio.bayer@ufrgs.br
(4) Professor of Federal University of Pampa, UNIPAMPA, CEP 97300-000 São Gabriel (RS). E-mail: fredericovieira@unipampa.edu.br (5) Post doctorate student at the Department of Soil Science, Federal University of Rio Grande do Sul, UFRGS, CEP 91540-000
affected by N fertilizers, in the average of the treatments, the impact on CH4
emission (0.2 kg ha-1 equivalentCO
2-C) was a hundredfold minor than for N2O
(132.8 kg ha-1 equivalentCO
2-C). Accounting for the N2O and CH4 emissions plus
energetic costs of N fertilizers of 1.3 kg CO2-C kg-1 N regarding the manufacture,
transport and application, we estimated an environmental impact of N sources ranging from 220.4 to 664.5 kg ha-1 CO
2-C , which can only be partially offset by C
sequestration in the soil, as no study in South Brazil reported an annual net soil C accumulation rate larger than 160 kg ha-1 C due to N fertilization. The N
2O
mitigation can be obtained by the replacement of N-nitric sources by ammonium and amidic fertilizers. Controlled release N fertilizers and urea with urease inhibitor are also potential alternatives to N2O emission mitigation to atmospheric
and systematic studies are necessary to quantify their potential in Brazilian agroecosystems.
Index terms: nitrogen fertilization, environmental impacts, agriculture, greenhouse effect.
RESUMO: FLUXOS DE ÓXIDO NITROSO E DE METANO EM GLEISSOLO INFLUENCIADOS PELA APLICAÇÃO DE FERTILIZANTES NITROGENADOS NO SUL DO BRASIL
Fertilizantes nitrogenados incrementam os fluxos de óxido nitroso (N2O) e podem deprimir
a oxidação de metano (CH4) em solos agrícolas. Entretanto, não existem resultados da magnitude
desses efeitos nas condições edafoclimáticas do Sul do Brasil, tampouco do potencial de algumas fontes de N em mitigar esses efeitos. O presente estudo objetivou avaliar o impacto da aplicação de fertilizantes nitrogenados (ureia, sulfato de amônio, nitrato de cálcio, nitrato de amônio, Uran, N de liberação lenta e ureia com inibidor de urease) nos fluxos de N2O e CH4 em um
Gleissolo no Sul do Brasil (Porto Alegre, RS), em comparação a um tratamento controle sem aplicação de N. O experimento seguiu um delineamento de blocos ao acaso, com três repetições, e os fertilizantes foram aplicados, em cobertura, numa dose única de 150 kg ha-1 N, no estádio
V5 da cultura do milho. A avaliação dos gases foi feita utilizando-se o método da câmara estática, nos 15 dias que sucederam a aplicação de N, e a análise das concentrações de N2O e
CH4 nas amostras de ar foi realizada por meio de cromatografia gasosa. O pico de emissão de
N2O ocorreu no terceiro dia após a aplicação dos fertilizantes nitrogenados e a sua intensidade
variou de 187,8 a 8.587,4 μg m-2 h-1 N, destacando-se as fontes nítricas com as maiores
emissões, as fontes amoniacais e amídicas com emissões intermediárias e os fertilizantes de liberação lenta e com inibidor de urease com as menores emissões. As emissões no terceiro dia tiveram relação direta com os teores de N-NO3- do solo (R2 = 0,56, p < 0,08) e ocorreram
quando este apresentava valores de porosidade preenchida por água (PPA) maiores que 70 %, o que indica que a desnitrificação foi o processo predominante na produção de N2O. Os fluxos
de CH4 do solo variaram de -30,1 μg m-2 h-1 C (absorção) a +32,5 μg m-2 h-1 C (emissão), e a
emissão acumulada desse gás teve relação direta com os teores de NH4+ no solo (R2 = 0,82,
p < 0,001), possivelmente pela competição enzimática entre os processos de nitrificação e de metanotrofia. Apesar de os fluxos de ambos os gases terem sido alterados pela aplicação dos fertilizantes nitrogenados, na média dos tratamentos, o impacto das emissões de CH4 (0,2 kg ha-1
C-CO2 equivalente) foi centenas de vezes menor que o verificado para as emissões de N2O
(132,8 kg ha-1 C-CO
2 equivalente). Considerando as emissões desses gases no solo fertilizado
e o custo médio de 1,3 kg C-CO2 kg-1 N referente à produção, transporte e aplicação do
fertilizante, o impacto ambiental dos fertilizantes nitrogenados variou de 220,4 a 664,5 kg ha-1
C-CO2, o qual pode ser apenas parcialmente contrabalanceado pelo acúmulo de C na matéria
orgânica do solo, pois nenhum estudo realizado no Sul do Brasil evidenciou taxa anual de acúmulo de C no solo, decorrente da adubação nitrogenada, maior que 160 kg ha-1 C. A
redução das emissões de N2O do solo e, portanto, do impacto ambiental pode ser obtida pelo
uso de fontes amoniacais e amídicas em detrimento de fontes nítricas. Os fertilizantes de liberação lenta e com inibidores de urease também são alternativas potenciais visando à mitigação das emissões de N2O para atmosfera, e esforços deverão ser empreendidos numa
avaliação sistemática desse potencial em agroecossistemas brasileiros.
INTRODUCTION
Mineral N application to the soil is a key practice for achieving high crop yield in non leguminous species such as corn, sugarcane and winter cereal crops (Amado et al., 2002; Conti, 2007; Fontoura & Bayer, 2009). The Brazilian consumption of N fertilizer has increased at 5 % per year in the last decade, surpassing two million tons of annual demand (Lopes & Bastos, 2007). According to the national inventory of greenhouse gases (GHG) emission, N fertilization is one of the main sources of nitrous oxide (N2O)
emission from agriculture in the country (Brasil, 2006) and, in addition, studies have evidenced depressive effects of such practice on methane (CH4) oxidation in
agricultural soils (Mosier et al., 1991; Hütsch, 2001). Despite the tendency of increasing the use of N fertilizers, however, few efforts have been made aiming to evaluate the magnitude of these effects and the potential of different sources of N fertilizers in minimizing the GHG emissions, particularly the N2O,
in the Brazilian agricultural systems (Steudler et al., 2002; Carvalho et al., 2006).
The N fertilization increases the mineral N availability in the soil (NO3--N + NH4+-N), which is a
substrate for the nitrification and denitrification processes, which in turn are responsible for the N2O production in the soil (Khalil et al., 2004). The denitrification is the direct source of N2O from nitric N-based fertilizers, while both processes of nitrification and denitrification can be involved in N2O emissions from amidic and ammoniacal N sources (Liu et al., 2007). Although both processes can contribute to the
N2O emission from amidic and ammoniacal N
sources, several studies suggested that denitrification is the dominant process from soils in which the water-filled pore space (WFPS) is larger than 70 % (Bateman & Baggs, 2005; Liu et al., 2007). Taking such results into account, it is reasonable to infer that the application of nitric N-based sources might promote greater N2O emissions than amidic and ammoniacal sources in poorly aerated soils (> 70 % WFPS).
Oppositely, however, a decline in the potential of CH4 oxidation has been attributed to the amidic and ammoniacal sources due to their short and long term effects on soil methanotrophy rates (Hüstch, 2001; Kravchenko et al., 2002). Nitric-based fertilizers usually have a small effect on the soil CH4 oxidation capacity. However, if applied at high rates and
depending upon the accompanying cation, they can significantly enhance the CH4 emission in consequence
of the injurious effect of salinity on methanotrophic bacteria and cause the rise of NH4+ concentration in
soil solution from its displacement from exchange sites (Hüstch, 2001).
Besides the outcomes from amidic/ammoniacal and
nitric N sources regarding soil N2O and CH4
emissions, the adoption of microbial activity inhibitors and controlled-release fertilizers assume a prominent role in scenarios of mitigation of GHG emissions. Such inputs have markedly decreased the N losses by NH3 volatilization (Conti, 2007; Fontoura et al.,
2010). Moreover, their delaying effect on the N
fertilizer transformation into NH4+-N and,
consequently, into NO3--N, can possibly cause a decline in N2O emissions to atmosphere (Zaman et al., 2008;
Snyder et al., 2009).
The study is part of an endeavor of identifying strategies of mitigating GHG emission in Brazilian agricultural systems and aimed to evaluate the impact of different N fertilizers on N2O and CH4 emissions
in a South Brazilian Gleysol.
MATERIAL AND METHODS
Soil and climate characteristics
The study was performed on the experimental area of the Agronomy Faculty, at the Federal University of the State of Rio Grande do Sul - UFRGS, in Porto Alegre, RS (30 o 04 ’ S and 51 o 08 ’ W). The local
climate is subtropical humid, with warm summers and cold and rainy winters (Cfa according to Koöpen classification). The mean annual temperature is 19.4 oC and January is the hottest month – with a
mean of 25 °C. The mean annual rainfall is 1,299 mm regularly distributed over the year. The soil is classified as Gleysol (FAO) and has 260 g kg-1 clay
and 310 g kg-1 sand (0 to 0.20 m). Some chemical
attributes of the soil before the onset of the experiment are reported in table 1.
Experimental design and treatments
The experiment was carried out on an area in which, for about ten years, it has been previously cultivated with corn (Zea mays L.) under no tillage system in
the summer and ryegrass in the winter (Lolium multiflorum L.), propagated by natural re-seeding. In the occasion of the experiment establishment, in October 2007, the ryegrass dry mass (~3 Mg ha-1 DM)
was desiccated with gliphosate-based herbicide (3.5 L ha-1). Corn was manually sowed at 15 days
after herbicide application, with an inter row distance of 0.7 m and number of seeds for a final population of about 55,000 plants ha-1. Sowing fertilization was
applied for all treatments and consisted of 30 kg ha-1
of N, 60 of P2O5 and 60 of K2O, by applying urea, triple super phosphate and potassium chloride, respectively. The sidedress fertilization (150 kg ha-1 N) was
performed in a single application when corn plants reached the V5 stage. The mineral N sources
[ammonium nitrate (NH4NO3); calcium nitrate
(Ca(NO3)2); ammonium sulphate [(NH4)2SO4); urea
(CO(NH2)2); urea with urease inhibitor; controlled-release N; and Uran, a liquid formula of N, obtained from a physical mix of urea and ammonium nitrate], in addition to the control (without sidedress N fertilization), were applied according to a randomized block design, with three replicates. The corresponding fertilizer was applied on the surface, without incorporation, at about 0.10 m from the corn row. A proportional rate of each N fertilizer was applied inside the bases area (placed in the inter row region) where
the N2O and CH4 fluxes were evaluated. The
controlled-release N source (Sulfammo ®) is composed by N molecules coated by an organo-mineral double layer that slows down the N dissolution by preventing the water entrance into its interior. The urea with urease inhibitor (Super N®) is obtained from the NBPT (N-(n-butyl) thiophosphoric triamide) addition to the urea. The NBPT occupies the active site of urease, postponing the enzyme action for three to seven days. The relative composition of N chemical species in each mineral N fertilizer is reported in table 2.
Air sampling and soil N2O and CH4 analysis
Soil fluxes of N2O and CH4 were evaluated by using the static chamber method (Jantalia et al., 2008). In the inter row spacing, three aluminum bases per
treatment (constituting three replicates) were inserted into the soil at a depth of 5 cm. The bases were covered with plastic film when the fertilizers were applied to the area. Subsequently, the plastic was removed and each base received the corresponding N source proportionally to the base area (346.5 cm2). The PVC
chambers (20 cm height and 25 cm diameter) were allocated on a canal, in the top of each base, which was filled with water to hermetically close the chamber volume during the air sampling events. In the top, each chamber contained a triple valve for fastening the sampling syringes, a digital thermometer with an outside display for monitoring the inner temperature of the chamber and a hole 1cm in diameter for equilibrating the pressure during the placement of the chambers on the canal. This hole was kept closed during the air sampling by using a rubber septum.
Air sampling and N2O and CH4 analysis were
performed at 0, 1, 3, 4, 5, 6, 7, 9, 12 and 15 days after the N sidedress application in corn. On the second day after application, air was not sampled due to rain occurrence at the moment of the sampling (28 mm). The sampling events always started at 9 a.m., assuming that the emissions at that time represent the approximate daily mean of GHG emissions (Jantalia et al., 2008). Air samples from the interior of each chamber were taken at 0 (zero), 15, 30 and 45 min after closing chambers, using polypropylene syringes (20 mL) containing a triple Luer lock valve in its tip. Immediately before each sampling time, the inner atmosphere was homogenized through an internal fan for 30 s. The inner temperature of the chamber was monitored at every sampling time through the digital thermometer allocated in one replicate of each treatment. Additional information regarding the material and the sampling procedure are available in Gomes et al. (2009) and Zanatta (2009).
The syringes containing the air samples were refrigerated in thermic boxes at low temperatures and were transported to the lab of Environmental Biochemistry (UFRGS), where they were analyzed by gas chromatography up to 36 h after sampling. The
Table 2. Percentage of N in the fertilizers and total N quantity applicated of each chemical species
equipment was a Shimadzu GC 2014 model “Greenhouse”, equipped with three packed columns working at 70 °C, N2 as a carrier gas at a flow of 26 mL min-1, injector with loop for direct sampling of
1 mL and temperature set at 250 °C, electron capture detector (ECD) at 325 °C for N2O detection and flame
ionization detector (FID) at 250 ºC for CH4.
The N2O and CH4 fluxes were estimated based on the following equation.
A 1 RT PV Δt ΔQ f =
where, f is the methane or nitrous oxide flux (μg m-2 h-1
N2O or CH4), Q is the quantity of each gas in the chamber at the sampling moment (μg N2O or CH4/
chamber), P is the atmospheric pressure (atm) in the chamber, assumed as being 1 atm, V is the chamber volume (L), R is the ideal gases constant (0.08205 atm L mol-1 K-1), T is the inner temperature
of the chamber at the sampling moment (°K) and A is the chamber area (m2). The rate of gas concentration
increase in the chamber was estimated by using the angular coefficient obtained from the relationship between gas concentration and time. The daily emissions were estimated from the rates of fluxes and the total emission for the period (15 days) they were calculated from the integration of the daily N2O and
CH4 emission from soil versus time (Gomes et al., 2009). The accumulated CH4 and N2O emission for
the experiment period was converted to quantities of equivalent CO2-C per hectare by taking into account
the global warming potential of each gas in comparison to CO2 (23 times greater for CH4 and 296 greater for
N2O) (Mosier et al., 2006).
Soil and climate variables
Some soil variables were evaluated in each air sampling event in order to identify driving variables for N2O and CH4 emissions. At the 0 to 0.10 m, the
gravimetric water content, pH-H2O and the NO3--N
and NH4+-N contents were analyzed in compound
samples (5 sub-samples/plot) according to methods described by Tedesco et al. (1995). The water-filled pore space (WFPS) was estimated from the gravimetric water content and the soil bulk density (Gomes et al., 2009), which was analyzed by using the core method at the end of the period of 15 days of evaluation and whose results are reported in table 1. Local data of rainfall for the evaluated period were obtained from an Automatic Meteorological Station of the National Institute of Meteorology, located about 5 km from the experiment area.
Statistical analysis
The effects of N fertilizers on accumulated CH4 and N2O emission and on the N2O emission peak were
evaluated by orthogonal contrasts (p < 10 %). The identification of the soil driving variables for CH4 and
N2O emission was performed by evaluating the
significance of determinant coefficients (R2) of
polynomial regression and multiple linear regressions.
RESULTS AND DISCUSSION
Soil N2O fluxes
The N2O emission from soil was remarkably
affected by N fertilization (Figure 1b, Tables 3 and 4). In comparison to the unfertilized soil (control), N fertilization rised the rates of N2O emission from soil
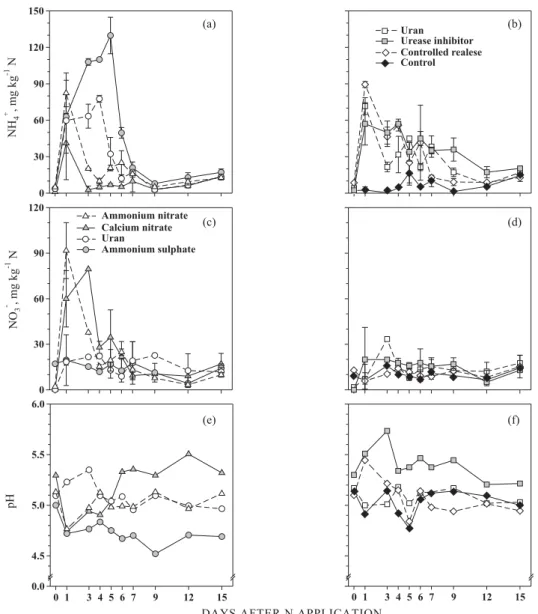
at about 4 to 400 times, reaching the upmost rates at the third day after fertilization – which coincided with WFPS values larger than 70 % (Figure 1a) and with the largest NO3--N and NH4+-N contents in the soil
(Figure 2a-b). Despite the intensity, the N2O peak of emission dropped sharply, reaching rates noticeably smaller at only one day subsequent to the peak of emission (mean for N-fertilized soils = 71.1 μg m-2 h-1 N),
but sustaining greater rates than the mean of the unfertilized soil (15.0 μg m-2 h-1 N) up to the 12th day
(see detail in Figure 1b).
Several studies have depicted the occurrence of
peaks in N2O emission following N fertilization
(Clayton et al., 1997; Dobbie & Smith, 2003; Venterea et al., 2005). In Brazil, a pioneer study performed in
the Northern region documented increases of N2O
emission rates at 15 to 18 times in an Ultisol after NO3--N based fertilization (Steudler et al., 2002).
However, in an Oxisol of the Cerrado region, a recent study did not evidence increases in N2O emissions
after the application of 60 kg ha-1 of urea, which was
attributed to the low water content in the soil at that moment (Carvalho et al., 2006), possibly enhanced by the fast drainage of that soil.
The sources of N fertilizers affected, in distinct magnitudes, the peak of N2O emission from the soil (Figure 1b). The application of nitric forms promoted
the largest N2O emission rates (8,587.4 and
3,485.8 μg m-2 h-1 Nfor ammonium nitrate and
calcium nitrate, respectively). The N2O emission for ammonium sulphate- and urea-amended soils peaked at 1,435.3 and 859.1 μg m-2 h-1 N, respectively
(Figure 1b), while the smallest peaks of emission rates were found from soils amended with controlled-release N (187.8 μg m-2 h-1 N) and with urea with urease
inhibitor (346.4 μg m-2 h-1 N). The Uran fertilizer,
composed of a mix of urea and ammonium nitrate, fostered peaks of intermediate intensity in comparison to the application of these sources individually (2,050.7 μg m-2 h-1 N). Although statistically similar,
the smaller N2O emission due to urea amendment
than ammonium sulphate might be due to the possibly larger loss of nitrogen by volatilization, which would
diminish the NH4+-N and NO
3--N generation and
Larger N2O emission rates have been described
following ammonium nitrate application than for other mineral N sources (Clayton et al., 1997; Maggiotto et al., 2000; Dobbie & Smith, 2003; Venterea et al., 2005). The magnitude of the emissions in these reports, however, were usually smaller than the emissions herein depicted, though large rates – similar to the current study – were already documented by Maggiotto et al. (2000) for soils under pasture with ryegrass in raining years (7.528 μg m-2 h-1 N). In the
current study, the large N2O emissions subsequent
to nitric-N fertilization were likely exacerbated by associated effects of rain occurrence in the beginning of the evaluation period, poor drainage of the soil and
the elevated water table. Such combination of factors, that nourished anoxic conditions due to the large values of WFPS, associated to the great soil contents of NO3--N remarkably accentuated the N loss as N2O.
In other types of soils with similar physical and chemical attributes and under analogous climatic conditions, it is possible that the N2O emissions would
be smaller than those obtained in this study. The particular features of the Gleysol regarding the drainage and the proximity to the water table determines the presence of a distinguished microbial population, which is tipical for the frequent anoxic and reduced conditions of these soils and would not dominate in soils under better drainage status. For Table 3. Statistical probabilities of orthogonal contrasts evaluating differences among the N sources in
accumulated emissions of N2O and CH4 for the 15 day period and for the peak of N2O emission Figure 1. Rainfall, water-filled pore space (WFPS) at the 0 to 0.10 m soil layer (a) and N2O emission (μg m-2 h-1 N)
Table 4. Accumulated N2O and CH4 emissions from soil in the 15 day period after nitrogen fertilizer application, their correspondent values in equivalent CO2-C, costs in CO2-C of the fertilizer and total greenhouse gases emission (N2O+CH4+custos C-CO2) as a consequence of mineral nitrogen fertilization
(1) Lal (2004). N
2O to equivalent CO2-C = kg ha -1 N
2O-N x 296. CH4 to equivalent CO2-C = g ha -1 CH
4-C x 23. Total emission = [Σ
(N2O equiv. CO2-C + CH4 equiv. CO
2-C+ Costs CO2-C) for fertilized soils] – [Σ (N2O equiv. CO2-C + CH4 equiv. CO2-C) without fertilizer].
Figure 2. Ammoniun contents (NH4+-N; a, b), nitrate contents (NO
3--N; c, d) and soil pH values (e, f) for the
the larger emissions in ammonium nitrate-amended soils than calcium nitrate, in addition to the elevated
NO3--N contents and WFPS values, the counter
ammonium ion possibly favoured the soils biological activity, especially in the presence of great quantity of crop residues with a high C/N ratio, which in turn possibly increased the oxygen consumption and enhanced the soil anaerobiosis condition (Baggs et al. 2003), favouring the N2O generation by denitrification.
The N2O emission on the third day after N
application, apart from the treatments with ammonium nitrate and calcium nitrate, had a close relation to the NO3--N contents in the soil (Equation 1,
p < 0.08), but the inclusion of NH4+ contents to a
multiple linear regression markedly decreased the significance (Equation 2, p < 0.17). Such results indicate that denitrification was the major process for N2O generation in the current study, where the NO3--N content by itself explained 56 % of the N2O
emission and the NH4+-N content in addition to NO 3
--N improved the relationship in only 13 % (R2 = 0.69).
Other evidence for the importance of the denitrification process to the N2O emission in this study was the values of coefficients in the multiple linear equation (Equation 2), indicating that the increase in one unit of soil NO3--N content promoted increases in N2O emission threefold larger than the increase of one unit of NH4+-N soil content (50.9/16.8 = 3.02), considering
the other variables steady.
N2O 3rd day (µg m-2 h-1 N) = 404.3 + 28.2 NO3--N (1)
R2 = 0.56; p < 0.08
N2O 3rd day (µg m-2 h-1 N) = -930.1 + 16.8 NH4+-N
+ 50.9 NO3--N (2)
R2 = 0.69; p < 0.17
Two main reasons, which do not exclude each other, might explain the absence of relationship between N2O
emission and fertilization with ammonium nitrate and calcium nitrate. Firstly, the soil NO3--N contents
may have surpassed the soil capacity of response in increases of N2O emission under the conditions of that soil. This hypothesis was already conjectured by Moreira & Siqueira (2006), when the authors theorized that intense N2O fluxes can occur independently of nitrate contents in soils with NO3--N > 20 mg L-1.
The second reason is that, for fertilized soils, the N2O
generation from denitrification may be hampered by the availability of labile carbon in the soil, irrespective of the nitrate content (Dobbie & Smith, 2003). This aspect is particularly important to calcium nitrate, wherein denitrification is the only process for N2O
generation.
Several studies suggest that denitrification is the major process related to N2O emission from soils, mainly under large water content conditions (Dobbie & Smith, 2003; Liu et al., 2007). Under these
favourable conditions and in fertilized soils, Batemam & Baggs (2005) estimated that the N2O amount
generated from denitrification was fivefold greater than from nitrification. In this context, many studies reported that the use of ammonium- and/or amidic-based N fertilizers instead of nitric-amidic-based sources in humid soils or in applications followed by rainfall or irrigation is an effective strategy to decrease the N2O
emissions from such soils (Clayton et al., 1997; Maggiotto et al., 2000; Dobbie & Smith, 2003; Jones et al., 2005), in addition to the split rate application of the N fertilizer (Wolschick et al., 2003; COMISSÃO..., 2004).
The relatively small peak intensities of N2O
emission from the soils amended with urease inhibitor urea and controlled-release N evidence their potencial as alternative sources efficient to diminish the N2O
emissions credited to N fertilizations (Figure 1b), corroborating the previous results of Zaman et al. (2008). The urease inhibitor presence and the restriction from the protective layer against water entrance around the fertilizer postpone and decrease the NH4+ concentration in the soil, restraining the
nitrification and, consequently, the denitrification process. However, oppositely to the expected results, the NH4+ contents in the soil amended with these N
sources were as large as those from the soil amended with normal urea, suggesting that the product did not hamper the urea hydrolysis to NH4+ at the soil
humidity conditions of the experiment. Therefore,
the smaller N2O emissions from soils of these
treatments were not necessarily due to the effects of the urease inhibitor or due to the controlled-release of N, but were probably attributed to the lesser nitrification rate of NH4+ in conditions of large soil
humidity. Batemam & Baggs (2005) reported a liquid nitrification of NH4+ of about 1 mg kg-1 d-1 N in soil
with 70 % WFPS. Similarly, Dobbie & Smith (2003) did not observe effects of urease inhibitor on NH4+
contents in the soil, reporting inclusively greater contents than in normal urea-amended soil for most evaluation events, which resulted in similar N2O emissions. In the case of the controlled-release N, Dobbie & Smith (2003) found smaller, but consistent, NH4+ concentrations in the soil than the normal urea,
which implied a greater emission due to the long term emission. Maggiotto et al. (2000), in a study of controlled-release N for three years, observed that the effect was distinct according to the year. Therefore, in spite of the promised results from the current study regarding the use of urea with urease inhibitor and the controlled-release N, the potential of such products in decreasing N2O emissions must be systematically
investigated before their recommendation for large scale. Concerning the accumulated N2O emission for the
period (15 days), the use of nitric-based N fertilizers resulted in the emission of 3.70, 1.54 and 1.04 kg ha-1 N
0.68 kg ha-1 N). The N
2O emissions from nitric-N
fertilizers corresponded to 2.46, 1.03 and 0.69 % of the total N applied to the soil for ammonium nitrate, calcium nitrate and Uran, respectively. The application of ammonium sulphate and urea, however, resulted in the loss of only 0.45 and 0.32 %, respectively. These results point that, for conditions favourable to denitrification (large WFPS), the N2O
emissions imparted from the addition of ammonium-or amidic-based fertilizer exclusively were about 50 % smaller than from nitric-based ones. The accumulated N2O emissions following the application
of urease inhibitor and controlled-release N forms were smaller than for ammonium sulphate and urea (Tables 3 and 4). Application of urea+urease inhibitors resulted in accumulated emission of 0.22 % of the total N applied (0.38 kg ha-1 N), while the controlled-release
N achieved an accumulated emission of 0.13 % (0.25 kg ha-1 N).
The range of N2O emission from soils in literature is wide and is strongly affected by the source and rate of fertilization, as well as by climate and soil characteristics (Clayton et al., 1997). The emissions found in the present study, however, can be considered as large, since the relative losses of N through N2O emission for only 15 days of evaluation are similar to annual losses from soils following application of nitric sources of N fertilizers (0.4 to 3.1 %), ammonium-based fertilizers (0.2 to 0.4 %), amidic-ammonium-based fertilizers (0.24 to 0.8 %) and with microbial activity inhibitor (0.1 to 0.52 %) (Bouwman, 1996; Maggiotto et al., 2000; Dobbie & Smith, 2003; Jones et al., 2005). One factor that can explain the large N2O emissions of
the current study is the probable anoxic condition of the soil due to its poor drainage exacerbated by the rainfall occurrence in the period subsequent to the N application (Figure 1).
Soil CH4 fluxes
The soil CH4 fluxes were affected by the sources of N fertilizer applied to the corn, but the magnitude of such fluxes were up to 300 times smaller than those for N2O (Figures 1b and 3). The CH4 fluxes ranged from an influx of -30.1 μg m-2 h-1 C to efflux of
+32.5 μg m-2 h-1 C (Figure 3). Such values represent
the difference between the methanogenesis and methanotrophy processes in the soil. The range in the CH4 flux rates was thinner than that cited by
Veldkamp et al. (1998) in Costa Rica soils under fertilization (-62.5 to +250 μg m-2 h-1 C-CH
4). In Brazil,
flux rates of -20.8 to + 54.2 μg m-2 h-1 C-CH
4 for high
lands of the Mid-West region cultivated with non-flooded rice (Metay et al., 2007) and of -40 to +62 µg m -2 h-1 C-CH
4 of corn-cultivated soils in the Southern
region (Gomes, 2006) were documented. Despite the relatively small rates of influx of CH4 in agriculture
soils in general, the negative fluxes evidence the occurrence of methanotrophy in such soils and highlight that, even for mineral N-fertilized soils, the
agriculture soils have the potential to act as sinks of atmospheric CH4, through the CH4 oxidation to CO2.
The biggest oscillation in CH4 flux rates in soil
were verified in the first week after N application (Figure 3). Rates increased markedly (60 to 194 %) in one day after N application in comparison to the unfertilized soil (Figure 3) and were closely and directly related to the NH4+ contents in the soil
(Equation 3).
CH41st day (µg m-2 h-1 C) = -23.3 + 0.39 NH
4+ (3)
R2 = 0.65; p < 0.02
The soil NH4+ contents were significantly large in
this first week of evaluation (> 40 mg kg-1 N in soil)
when compared to the control, inclusively in soils that received N fertilizers containing solely nitrate (Figure 2a,b), presumably due to their effect in increasing the rates of soil organic matter mineralization. The relationship between CH4 fluxes
and NH4+ contents is attributed to the inhibitory effect
of NH4+ on the methanotrophy process, responsible
for the CH4 oxidation in the soil (Hüstch, 1998).
According to Hütsch (1996), this effect is very effective and decreases larger than 30 % in the CH4 oxidation
rates can be detected only three hours after N application to the soil. The inhibitory mechanism of NH4+ on CH4 influx is complex and involves both the
enzymatic competition for the methane monooxygenase enzyme (Kravchencko et al., 2002) and the toxic effect of composts generated during nitrification (hydroxylamine and nitrite) on methanotrophic Figure 3. Daily fluxes of CH4 from soil (μg m-2 h-1 C)
microrganisms (Hütsch, 1998). Accordingly to Kravechencko et al. (2002), NH4+ concentrations
greater than 40 mg kg-1 N are sufficient to trigger
the inhibitory effect on the soil CH4 oxidation. When
the soil NH4+ avalilability is large, the methanotrophic
bacteria activity changes to the NH4+ oxidation in
detriment of CH4 oxidation, because the CH4
monooxygenase enzyme has low specificity for its substrate (Hütsch, 2001). This behavior determines, temporarily, greater liquid emission of CH4 from the
soil, but the effect can persist for days, mainly if associated to the maintenance of large NH4+ contents
in the soil.
From the third day on, in addition to the NH4+
contents, the CH4 emission was likely impacted by the WFPS, when the values reached 75 % on this date
(Figura 1). While NH4+ is responsible for the
methanotrophy decrease due to the enzymatic competition previously discussed, the larger values of WFPS make the CH4 diffusion from the soil difficult
and are responsible for the generation of anoxic microsites in the soil, which in turn increase the methanogenesis occurrence (Kessavalou et al., 1998).
After the seventh day of N application, the differences in CH4 influx/efflux rates in the soil among
the N sources decreased and, from this moment, liquid influx predominated, with rates ranging from -4.4 to -10.1 μg m-2 h-1 C, likely related to the decrease in
WFPS (> 60 %) and in soil NH4+ contents (Figures
1a and 3a-b). The decreasing effect on soil CH4
oxidation is usually short term and completely reversible (Dunfield & Knowles, 1995). In laboratory studies, Hüstch (1998) observed a gradual recomposition in the oxidation capacity after five days of fertilization, joined by the decrease in the soil NH4+
contents. However, in field experiment, Veldkamp et al. ( 1998) reported the regress of CH4 oxidation rates
to the original values only after three weeks of fertilization. According to Hüstch (2001), if conditions of low temperature, great soil water content and frequent fertilization persist for long term, the decrease
in the soil CH4 oxidation capacity can became
irreversible due to damages in the methanotrophic population. This long term effect is mainly detected when oxidation rates of agricultural soils are compared to adjacent soils under natural pastures and forests. In forest soils, CH4 oxidation rates in general are
substantially greater than in agriculture soils due to the absence of N fertilization (Hüstch, 2001).
The mean accumulated CH4 emission for the
N-amended soils was significantly larger (60 %) than for the non-amended soil (Table 3), which summed an influx of -45.1 g ha-1 C in the 15 day period of
evaluation (Table 4). The calcium nitrate (-29.2 g ha-1
C) and urea (-26.3 g ha-1 C) application promoted the
smallest injurious effects of mineral N fertilizers on the soil CH4 oxidation and were followed by ammonium
nitrate (-21.8 g ha-1 C) and urea with urease inhibitor
(-12.4 g ha-1 C). The greatest increases in the CH 4
liquid emission in comparison to the non-amended soil were found for ammonium sulphate (100 %), uran and controlled-release N (75 %) (Table 4).
The increase in the accumulated CH4 emission for the period had direct and close relation with the soil NH4+ content (Figure 4). Mosier et al. ( 1991) were
the first authors to describe the suppressive effect of NH4+ on methanotrophy, after of the observation that
the application of 22 kg ha-1 N as ammonium nitrate
decreased the CH4 influx of a pasture soil in 41 % in comparison to the non fertilized soil. Veldkamp et al. ( 1998) also reported that ammonium sulphate was the N fertilizer that nourished the biggest decrease
in the CH4 oxidation rate in the soil (60 % in
comparison to calcium nitrate and urea).
In addition the great soil NH4+ contents, another
factor that can contribute to the increase in CH4 emission from soils fertilized with ammonium sulphate is the decrease in soil pH. This fertilizer has acid reaction in the soil and, in the present study, promoted a decrease in soil pH in 0.3 units, at average for the period of evaluation (Figure 2e-f). In addition to the direct effect on the methanotrophic population, the pH decrease also prolongs the period recquired for the nitrification of the NH4+ applied to the soil, as
nitrification rates are smaller in low pH soil (Moreira & Siqueira, 2006).
Environmental impact from N fertilizers concerning greenhouse gases emission
The environmental impact of N fertilizers must take into account the N2O and CH4 emissions from the soil, as well as the emissions of all GHG (“costs in CO2”) involved with the manufacture, transport and application of the fertilizers. In table 4, the N2O and
CH4 emissions from soil are represented in quantities Figure 4. Relationship between accumulated flux of CH4 (g ha-1 C) and mean contents of ammonium
of equivalent CO2-C based on the global warming potential of N2O (296) and CH4 (23) in comparison to
CO2 (IPCC, 2007) and the costs in CO2 of the N fertilizers application (150 kg ha-1 N) equivalent to
195 kg ha-1 C-CO
2, which were estimated from the
coefficient of emission of 1.3 kg CO2-C kg-1 N, as
suggested by Lal (2004).
The magnitude of N2O and CH4 emissions, in
equivalent CO2-C, highlights that the environmental
impact from N2O emission from soil was markedly
larger than that from CH4 emission (Table 4). For
the average among the treatments, the liquid CH4
emission was equivalent to 0.2 kg ha-1 CO
2-C, which
corresponded to about 500 times smaller than the mean for N2O emission (132.8 kg ha-1 CO2-C). Among
the N-amended soils, the N2O emission range was
equivalent to the emission of 31.9 to 476.3 kg ha-1
CO2-C (Table 4). After summing the emission of both gases and the mean cost of the fertilizers in CO2-C
(195 kgha-1 CO
2-C), the mineral N fertilization
promoted total emissions of 220.4 to 664.5 kg ha-1 CO 2
-C equivalent to atmosphere (Table 4). The nitric-based fertilizers had emissions larger than 326 kg ha-1
CO2-C.
Taking into account these values, it is possible to infer that the effect of N fertilization on the enhancement in the soil organic matter stocks due to their increase in biomass production can only partially counterbalance the harmful impact on GHG emissions to the atmosphere (220.4 to 664.5 kg ha-1 CO
2-C). In
studies carried out in the South of Brazil, the uppermost rate of annual C accumulation in soil due to N fertilization was 160 kg ha-1 CO
2-C (Zanatta et
al., 2007; Weber, 2008). Oppositely, however, the results point out that there are possibilities to minimize the N2O emissions decurrent from mineral
N fertilization and that, under large water content in soil, this goal can be achieved by using ammonium-and amidic-based fertilizers in detriment of nitric sources. This potential can be even better exploited if controlled-release N and urea with urease inhibitor are adopted. Complementing these alternatives, it is worthy of mentioning that the adequate moment of application and the adoption of split rates are key strategies for maximizing the efficiency of nutrient use.
CONCLUSIONS
1. The use of N fertilizers intensified the N2O emissions from the Gleysol evaluated in this study.
The nitric-based sources promoted larger N2O
emissions under soil conditions of large water-filled pore space and denitrification was the main process involved in the gas generation. Ammonium- and amidic-based fertilizers represented better alternatives for decreasing the N2O emission in this poor drained
soil, as well as the controlled-release N and the urea with urease inhibitor.
2. Nitrogen fertilization increased the CH4
emission from the soil, but the magnitude of CH4
fluxes in consequence of N fertilization was several hundred times smaller than the N2O fluxes from soil.
The environmental impact from such increases in CH4 emissions due to nitrogen fertilization, therefore, was of low significance.
3. The main driving variables controlling the N2O
emission in the Gleysol were the nitrate content in soil and the water-filled pore space, while the NH4+-N
content was the main driving variable for the CH4
emission from soil. For both gases, the main injurious effect of N fertilizer application to the soil on their emissions was ephemeral.
AKNOWLEDGEMENTS
To the National Council for Scientific and Technological Development-CNPq (Proc. 474919/2007-2 and 478000/474919/2007-2009-0) and the State of Rio Grande do Sul Foundation for Scientific Development-FAPERGS (Pronex Proc. 04/0850-0 and 10/0054-7) for financial support of the research activities related to the Nucleus for Research in Greenhouse Gases and Development of Low Carbon Agropecuary Production Systems. J.A. Zanatta and M. Tomazi aknowledge to CNPq and Capes for the PhD and Postdoctoral fellowships awarded, respectively, and C. Bayer is grateful to CNPq for the Research Productivity fellowship.
LITERATURE CITED
AMADO, T.J.C.; MIELNICZUK, J. & AITA, C. Recomendação de adubação nitrogenada para o milho no RS e SC adaptada ao uso de culturas de cobertura do solo sob plantio direto. R. Bras. Ci. Solo, 26:241-248, 2002. BAGGS, E.; STEVENSON, M.; PIHLATIE, M.; REGAR, A.;
COOK, H. & CADISCH, G. Nitrous oxide emissions following application of residues and fertilizer under zero and conventional tillage. Plant Soil, 254:361-370, 2003. BATEMAN, E.J. & BAGGS, E.M. Contributions of nitrification
and denitrification to N2O emissions from soils at different
water-filled pore space. Biol. Fert. Soil, 41:379-388, 2005. BOUWMAN, A.F. Direct emission of nitrous oxide from agricultural soils. Nutr. Cycling Agroecosyst., 46:53-70, 1996.
CARVALHO, A.M.; BUSTAMANTE, M.M.C.; KOZOVITS, A.R.; MIRANDA, L.N.; VIVALDI, L.J. & SOUSA, D.M. Emissões de óxidos de nitrogênio associada à aplicação de uréia sob plantio direto e convencional. Pesq. Agropec. Bras., 41:679-685, 2006.
CLAYTON, H.; MCTAGGART, I.P.; PARKER, J.; SWAN, L. & SMITH, K.A. Nitrous oxide emissions from fertilised grassland: A 2-year study of the effects of N fertiliser form and environmental conditions. Biol. Fert. Soil, 25:252-260, 1997.
COMISSÃO DE QUÍMICA E FERTILIDADE DO SOLO – CQFSRS/SC. Manual de adubação e calagem para os estados do Rio Grande do Sul e Santa Catarina. Porto Alegre, Sociedade Brasileira de Ciência do Solo; Núcleo Regional Sul, 2004. 400p.
CONTI, T.L.M. Uréia tratada com o inibidor da urease NBPT na adubação de cana-de-açúcar colhida sem despalha a fogo. Campinas, Instituto Agronômico, 2007. 72p. (Tese de Mestrado)
DOBBIE, K.E. & SMITH, K.A. Impact of different forms of N fertilizer on N2O emissions from intensive grassland.
Nutr. Cycling Agroecosyst., 67:37-46, 2003.
DUNFIELD, P. & KNOWLES, R. Kinetics of inhibition of methane oxidation by nitrate, nitrite, and ammonium in a humisol. Appl. Environ. Microbiol., 61:3129-3135, 1995. EMPRESA BRASILEIRA DE PESQUISA AGROPECUÁRIA -EMBRAPA. Centro Nacional de Pesquisa de Solos. Sistema brasileiro de classificação de solos. 2.ed. Brasília, Embrapa Produção de Informação, 2006. 306p.
FONTOURA, S.M.V. & BAYER, C. Adubação nitrogenada para alto rendimento de milho em plantio direto na região Centro-Sul do Paraná. R. Bras. Ci. Solo, 33:1721-1732, 2009.
FONTOURA, S.M.V.; BAYER, C. & MORAES, R. Volatilização de amônia em plantio direto na região Centro-Sul do Paraná. R. Bras. Ci. Solo, 34:1677-1684, 2010.
GOMES, J. Emissão de gases do efeito estufa e mitigacão do potencial de aquecimento global por sistemas conservacionistas de manejo do solo. Porto Alegre, Universidade Federal do Rio Grande do Sul, 2006. 126p. (Tese de Doutorado)
GOMES, J.; BAYER, C.; PICCOLO, M.C.; ZANATTA, J.A.; VIEIRA, F.C.B. & SIX, J. Soil nitrous oxide emission as affected by long-term legume-based crop rotations in a subtropical agroecosystem. Soil Till. Res., 98:36-44, 2009. HUTSCH, B.W. Methane oxidation in soils of two long-term fertilization experiments in Germany. Soil Biol. Biochem., 28:773-782, 1996.
HUTSCH, B.W. Methane oxidation in arable soil as inhibited by ammonium, nitrite, and organic manure with respect to soil pH. Biol. Fert. Soil, 28:27-35, 1998.
HUTSCH, B.W. Methane oxidation in non-flooded soils as affected by crop production - invited paper. Eur. J. Soil Sci., 14:237-260, 2001.
IPCC. Intergovernmental Panel. Climate change 2007. In: ALLEY, R. et al., eds. Contribution of working group I to the Fourth Assessment Report of the Intergovernmental Panel on Climate Change. Cambridge, Cambridge University Press, 2007.
JANTALIA, C.P.; DOS SANTOS, H.P.; URQUIAGA, S.; BODDEY, R.M. & ALVES, B.J.R. Fluxes of nitrous oxide from soil under different crop rotations and tillage systems in the South of Brazil. Nutr. Cycling Agroecosyst., 82:161-173, 2008.
JONES, S.K.; REES, R.M.; SKIBA, U.M. & BALL, B.C. Greenhouse gas emissions from a managed grassland. Global Planet Change, 47:201-211, 2005.
KESSAVALOU, A.; MOSIER, A.R.; DORAN, J.W.; DRIJBER, R.A.; LYON, D.J. & HEINEMEYER, O. Fluxes of carbon dioxide, nitrous oxide, and methane in grass sod and winter wheat-fallow tillage management. J. Environ. Qual., 27:1094-1104, 1998.
KHALIL, K.; MARY, B. & RENAULT, P. Nitrous oxide production by nitrification and denitrification in soil aggregates as affected by O2 concentration. Soil Biol. Biochem., 36:687-699, 2004.
KRAVCHENKO, I.; BOECKX, P.; GALCHENKO, V. & van CLEEMPUT, O. Short- and medium-term effects of NH4+
on CH4 and N2O fluxes in arable soils with a different texture. Soil Biol. Biochem., 34:669-678, 2002.
LAL, R. Carbon emission from farm operations. Environ. Inter., 30:981-990, 2004.
LIU, X.J.J.; MOSIER, A.R.; HALVORSON, A.D.; REULE, C.A. & ZHANG, F.S. Dinitrogen and N2O emissions in arable
soils: Effect of tillage, N source and soil moisture. Soil Biol. Biochem., 39:2362-2370, 2007.
LOPES, A.S. & BASTOS, A.R.R. Fertilizantes nitrogenados no Brasil: Um problema de escassez. Inf. Agron., 120: 4-5, 2007. Disponível em: <http://www.inpofos.org/ppiweb / b r a z i l . n s f / 8 7 c b 8 a 9 8 b f 7 2 5 7 2 b 8 5 2 5 6 9 3 e 0 0 5 3 e a 7 0 / d 2 0 f b 4 4 d 8 5 2 5 9 b f 7 0 3 2 5 7 2 5 3 0 0 6 2 8 7 0 e / $ F I L E / Jornal120.pdf>. Acesso em: 5 junho 2008.
MAGGIOTTO, S.R.; WEBB, J.A.; WAGNER-RIDDLE, C. & THURTELL, G.W. Nitrous and nitrogen oxide emissions from turfgrass receiving different forms of nitrogen fertilizer. J. Environ. Qual., 29:621-630, 2000.
METAY, A.; OLIVER, R.; SCOPEL, E.; DOUZET, J.M.; MOREIRA, J.A.A.; MARAUX, F.; FEIGL, B.J. & FELLER, C. N2O and CH4 emissions from soils under conventional
and no-till management practices in Goiania (Cerrados, Brazil). Geoderma, 141:78-88, 2007.
MOREIRA, F.M.D.S. & SIQUEIRA, J.O. Microbiologia e bioquímica do solo. 2.ed. Lavras, Universidade Federal de Lavras, 2006. 729p.
MOSIER, A.R.; HALVORSON, A.D.; REULE, C.A. & LIU, X.J.J. Net global warming potential and greenhouse gas intensity in irrigated cropping systems in Northeastern Colorado. J. Environ. Qual., 35:1584-1598, 2006. SNYDER, C.S.; BRUULSEMA, T.W.; JENSEN, T.L. & FIXEN,
P.E. Review of greenhouse gas emissions from crop production systems and fertilizer management effects. Agric. Ecos. Environ., 133:247-266, 2009.
STEUDLER, P.A.; GARCIA-MONTIEL, D.C.; PICCOLO, M.C.; NEILL, C.; MELILLO, J.M.; FEIGL, B.J. & CERRI, C.C. Trace gas responses of tropical forest and pasture soils to N and P fertilization. Global Biogeochem. Cycles, 16:102-108, 2002.
TEDESCO, M.J.; GIANELLO, C.; BISSANI, C.A.; BOHNEN, H. & VOLKWEISS, S.J. Análises de solo, plantas e outros materiais. 2.ed. Porto Alegre, Universidade Federal do Rio Grande do Sul, 1995. 174p. (Boletim Técnico, 5) VELDKAMP, E.; KELLER, M. & NUNEZ, M. Effect of pasture
management on N2O and NO emissions from soils humid
tropics of Costa Rica. Global Biogeochem. Cycles, 12:71-79, 1998.
VENTEREA, R.T.; BURGER, M. & SPOKAS, K.A. Nitrogen oxide and methane emissions under varying tillage and fertilizer management. J. Environ. Qual., 34:1467-1477, 2005.
WEBER, M.A. Leguminosas e os estoques de carbono e nitrogênio do solo num experimento de longa duração. Porto Alegre, Universidade Federal do Rio Grande do Sul, 2008. 137p. (Tese de Mestrado)
WOLSCHICK, D.; CARLESSO, R.; PETRY, M.T. & JADOSKI, S.O. Adubação nitrogenada na cultura do milho no sistema plantio direto em ano com precipitação pluvial normal e com “el niño”. R. Bras. Ci. Solo, 27:461-468, 2003.
ZAMAN, M.; NGUYEN, M.L.; BLENNERHASSETT, J.D. & QUIN, B.F. Reducing NH3, N2O and N-NO3- losses from
a pasture soil with urease or nitrification inhibitors and elemental S-amended nitrogenous fertilizers. Biol. Fert. Soil, 44:693-705, 2008.
ZANATTA, J.A. Emissões de óxido nitroso afetadas por sistemas de manejo de solo e fontes de nitrogênio. Porto Alegre, Universidade Federal do Rio Grande do Sul, 2009. 92p. (Tese de Doutorado)