Antimicrobial activity, phenolic profile and role in the inflammation of propolis
João Carlos Silva
a, Sandra Rodrigues
a,b, Xesús Feás
c, Leticia M. Estevinho
a,⇑
aDepartment of Biology and Biotechnology, Agricultural College of Bragança, Polytechnic Institute of Bragança, Campus Santa Apolónia, E 5301-855 Bragança, Portugal bCIMO-Mountain Research Center, Portugal
cDepartment of Organic Chemistry, Faculty of Sciences, University of Santiago de Compostela, E-27002 Lugo, Spain
a r t i c l e
i n f o
Article history:
Received 26 December 2011 Accepted 28 February 2012 Available online 7 March 2012
Keywords:
Antimicrobial activity Hyaluronidase Inflammation Phenolic compounds Propolis
a b s t r a c t
Nowadays a great amount of information regarding chemical and biological aspects of bee products is available in the literature, but few data on its therapeutic uses are found. The aim of this study was to evaluate the phenolic profile, thein vitroantimicrobial activity and effect in the hyaluronidase enzyme (widely related with the inflammation process) of propolis harvested in Portugal. The efficacy of three extracts (alcoholic, methanolic and aqueous) was also compared. It was chosen the hydro-alcoholic extract, because this was the most effective for extracting phenolic compounds. The antimicro-bial activity was accessed in Gram-positive and Gram-negative bacteria and yeasts, isolated from different biological fluids and the results were then compared with the obtained for reference microor-ganisms. The propolis from Bragança was the one that possessed the highest polyphenols’ content. The sample from Beja showed the less significant inhibition of the hyaluronidase enzyme. Concerning the antimicrobial activity,Candida albicanswas the most resistant andStaphylococcus aureusthe most sensi-tive. The reference microorganisms were more sensitive than the ones isolated from biological fluids.
Ó2012 Elsevier Ltd. All rights reserved.
1. Introduction
Propolis is a beehive product prepared by bees of the
Apis
melli-fera
species, using resinous substances collected from various
plants. These substances are mixed with
b
-glycosidase enzyme of
their saliva, partially digested and added to bee wax to form the
fi-nal product (
Umthong et al., 2011
). Propolis is used, by bees, as a
sealing wax for filling cracks in beehives and as a protective barrier
against the pathogenic microorganisms. It is considered the most
important ‘‘chemical weapon’’ (
Falcão et al., 2010
).
The composition of this sticky resin and its physico-chemical
properties, biological activities and therapeutic uses depend on
the vegetation where the hives are placed, the climate and the
vari-ety of the queen (
Quiroga et al., 2006
). According to
Kumazawa
et al. (2004)
, in samples from Brazil terpenoids and prenylated
derivatives of
p-coumaric acids predominated whilst the samples
from China and Europe mostly contained phenolic acid esters
and flavonoids. In spite of the possible differences in composition,
most propolis samples share considerable similarity in their overall
chemical nature: 50% resin, 30% wax, 10% essential oils, 5% pollen
and 5% of other organic compounds (
Gómez-Caravaca et al., 2006
).
In fact, propolis has more than 300 different compounds identified,
such as: aliphatic acids, esters, aromatic acids, fatty acids,
carbohydrates, aldehydes, amino acids, ketones, chalcones,
dihydrochalcones, terpenoids, vitamins and inorganic substances
(
Bankova et al., 2000
).
This product has been used as remedy and as a food
preserva-tive by humans since ancient times (
Umthong et al., 2011
). In the
last years, this product has been the subject of intensive studies,
highlighting its biological and pharmacological properties, such
as antibacterial (
Velazquez et al., 2007
) antiviral (
Schnitzler et al.,
2010
), antioxidant (
Moreira et al., 2008
), hepatoprotective
(
Banskota et al., 2001
), cariostatic (
Libério et al., 2009
) and
antican-cer (
Valente et al., 2011
). For these reasons, propolis awakened
interest in the pharmaceutical industries, being introduced in
products for human consumption, such as drinks, food and
cosmet-ics (
Moreira et al., 2008
).
In addition, the emergence of antibiotic-resistant
microorgan-isms, that are known by their dangerous action in wounds,
de-crease the treatment options. This led to an inde-crease research of
antimicrobial activity of natural products as possible alternatives
(
Morais et al., 2011
). In fact, this was the most studied biological
property of propolis. However, European propolis studies are
scarce, and particularly in Portugal are non-existent.
This product is also used is medicine as an anti-inflammatory.
Inflammation is a process by which the body’s white blood cells
and chemicals protect us from infection and foreign substances
such as bacteria and viruses (
Park et al., 2002
). This process is
asso-ciated with the liberation of inflammatory mediators, like
prosta-glandins, through enzymatic reactions, in which are involved:
lipoxygenases, cyclooxygenases, phospholipase A2 and
hyaluroni-dase (
Braga et al., 2006
).
0278-6915/$ - see front matterÓ2012 Elsevier Ltd. All rights reserved. doi:10.1016/j.fct.2012.02.097
⇑
Corresponding author. Tel.: +351 273 303342; fax: +351 273 325405.E-mail address:[email protected](L.M. Estevinho).
Contents lists available at
SciVerse ScienceDirect
Food and Chemical Toxicology
The hyaluronic acid is an important component of articular
car-tilage and plays an important role in tissues’ renovation. Its
degra-dation, by the hyaluronidase enzyme, may cause bone loss,
inflammation and pain (
Libby et al., 2002
). As consequence, the
determination of the hyaluronidase enzyme is an indirect way to
assess the anti-inflammatory activity.
Both the anti-inflammatory and antimicrobial activities of
Por-tuguese propolis have never been studied, even though beekeeping
has great importance in the economy of this country.
In this context it is necessary to ensure the consistency of
phar-macological and clinical research, to understand the biological
activity of propolis as well as to achieve a reliable standardization
on propolis types and to enhance product quality control.
In the present work and for the first time, it is evaluated the
antimicrobial activity against multi-resistant microorganisms and
the anti-inflammatory activity, assessed by the effect on the
hyal-uronidase enzyme, of propolis samples from Portugal.
Simulta-neously, it was also studied the effect of extraction solvents on
this biological activities.
2. Material and methods
2.1. Chemicals and reagents
All the reagents were of analytical grade purity. Methanol (CH3OH) and ethanol
(CH3CH2OH) were supplied by Pronolab (Lisbon, Portugal). The Folin–Ciocalteu
re-agent, chloroform (CHCl3), sodium carbonate (Na2CO3), gentaminice and fluconazol
were obtained from Merck (Darmstadt, Germany). Gallic acid and (+)-catechin were purchased from Sigma (St. Louis, MO, USA). The bovine testicular hyaluronidase (350 units) and the potassium salt of human umbilical cord hyaluronic acid were obtained from Sigma (St. Louis, MO, USA). The culture mediums were purchased from Himedia (Mumbai, India). The TTC solution (2,3,5-triphenyl-2H-tetrazolium chloride) was supplied by Fluka (Buchs, Switzerland). The other chemicals were ob-tained from Sigma Chemical Co. (St. Louis, MO, USA). High purity water (18 MX
cm), used in all experiments, was obtained from a Milli-Q purification system (Mil-lipore, Bedford, MA, USA).
2.2. Propolis samples
Propolis samples were collected by beekeepers in the fall of 2010 fromA. melli-ferahives located in different zones of Portugal: Bragança (42°480N; 6°450W);
Coimbra (40°150N; 8°270W) and Beja (38°10 N, 7°520W). Three samples
(n= 3) were collected from each place and all the analysis were performed in trip-licate. They were obtained after the honey extraction by scratching the hive walls and frames. Upon receipt, each sample was inspected in order to find rests of bees, wood, plant, pupa of moth, among others. The major visible impurities were re-moved from the samples. Each sample was weighed and frozen at 20°C until analysis.
2.3. Palynological identification
Palynological processing of the samples followed the standard methodology, described in detail previously byMoreira et al. (2008). In briefly, 0.5 g of scraped propolis was extracted overnight with ethanol. Next, the sediment was treated with KOH (10%), sonicated for 15 min. and sieved through a 20 mesh stainless steel screen to eliminate large fragments. In this stage, three propolis microscope slides were mounted with sediment obtained after centrifugation (10,000gfor 1 min) for observation of plant trichomes and other organic residues that may be destroyed in sequence. Then acetolysis was applied, and two additional microscope slides were prepared using glycerin jelly, one stained with basic fuchsine and the other without stain. Approximately 300 pollen grains in each sample were counted. Pollen grain identification was performed by optical microscope with total magnification (400 and1000). A reference collection of CIMO – Mountain Research Centre
(Agricultural College of Bragança) and different pollen morphology guides (CUPOD, Cambridge University Palynological Online Database) were used for the recognition of the pollen types.
2.4. Extraction procedure
2.4.1. Aqueous extract
Propolis (5 g) was chopped into small pieces and extracted with 50 mL of water (80°C) for 3 h (Midorikawa et al., 2001). Afterwards, the resulting mixture was fil-tered and the residue was re-extracted in the same conditions. The next step was the mixture of both filtrated solutions, which were then frozen at 20°C.
2.4.2. Methanolic extract
The propolis samples were broken into small pieces and homogenized. The samples were extracted with 80% of methanol/water (1/10, v/v) at 70°C for 1 h. The mixtures were filtered, and the residue was re-extracted following the same procedure. After, the filtrated solutions were combined, concentrated and frozen at 20°C.
2.4.3. Hydro-alcoholic extract
Prior to the extraction, the propolis was grounded and homogenized. The sam-ples were extracted with 80% of ethanol/water (1/10, v/v) at 70°C for 1 h, the result-ing mixtures were filtered, and the residues were re-extracted in the same conditions. After the second extraction, the filtrated solutions were combined, con-centrated and frozen at 20°C.
2.5. Total phenolics and flavonoids
The total phenolic content in the extracts were recorded using the Folin–Ciocal-teu method as described byMoreira et al. (2008). Briefly, a dilute solution of each propolis in MeOH (MeOH-propolis; 500
l
L of 1:10 g/mL) was mixed with 500l
L of Folin–Ciocalteu reagent and 500l
L of Na2CO3(10% w/v). After incubation in darkat room temperature for 1 h, the absorbance of the reaction mixture at 700 nm was determined against the blank (the same mixture without the MeOH-propolis) using a Unicam Helios Alpha UV–visible spectrometer (Thermo Spectronic, Cambridge, UK). Galic Acid standard solutions (0.0110 3 0.0810 3M) were used for
con-structing the calibration curve (y= 2.3727x+ 0.0022;R2= 0.9998). Total phenols
content were expressed as mg of Galic Acid equivalents per g of propolis (GAEs). For flavonoids’ contents the aluminium chloride method was used. In briefly, MeOH-propolis (250
l
L) was mixed with 1.25 mL of distilled H2O and 75l
L of a5% NaNO2solution. After 5 min, 150
l
L of a 10% AlCl3H2O solution was added. After6 min, 500
l
L of 1 M NaOH and 275l
L of distilled H2O were added to the mixtureand vortexed. The solution was well mixed and the intensity of pink colour was measured at 510 nm. Catechin standard solutions (0.02210 3–0.34103M)
were used for constructing the calibration curve (y= 0.9689x 0.0092;
R2= 0.9987). Total flavonoids content were expressed as mg of catechin equivalents
per g of propolis (CAEs).
2.6. UV–visible absorption spectroscopy
The determination of the UV–visible spectra of the extracts (aqueous, methano-lic and hydro-alcohomethano-lic) was performed according toKoo et al. (2002). Twenty-five microlitre of each propolis extract were diluted into 30 mL of ethanol. The absorp-tion spectra were determined in the wavelength range from 200 to 500 nm.
2.7. Anti-inflammatory activity – hyaluronidase assay
The inhibition of hyaluronidase activity was determined using de method de-scribed byPark et al. (1998). The reaction mixture is constituted by 50
l
L of prop-olis’ extract and 50l
L (350 units) of hyaluronidase enzyme (Type IV-S: bovine testes), was incubated at 37°C for 20 min. Then, calcium chloride was added (1.2l
L, 2.510 3M/L) to activate the enzyme and the mixture was incubated at37°C for 20 min. To start the reaction 0.5 mL of hyaluronic acid sodium salt (0.1 M/L) were added. The mixture was incubated at 37°C for 40 min. After this, 0.1 mL of potassium tetraborate 0.8 M was added and it was incubated in water-bath at ebullition for 3 min. The mixture was placed at 10°C and 3 mL ofp -dimeth-ylaminebenzaldehyde were added. Afterwards, it was incubated at 37°C for 20 min. Finally, the absorbance was measured at 585 nm using water as control. All the tests were performed in triplicate.
2.8. Antimicrobial activity
The microorganisms used as test organisms are presented inTable 1. The micro-organisms were isolated from biological fluids (in the Hospital Centre) and identi-fied in the Microbiology Laboratory of Escola Superior Agrária de Braganca. It were also used reference strains, obtained from the authorized distributor of ATCC (LGC Standards S.L.U., Barcelona.) The isolates were stored in Muller–Hinton medium plus 20% glycerol at 70°C, before experimental use. The inoculum for the assays were prepared by diluting cell mass in 0.85% NaCl solution, adjusted to 0.5 MacFar-land scale, confirmed by spectrophotometrical reading at 580 nm for bacteria and 640 nm for yeasts. Cell suspensions were finally diluted to 104CFU/mL in order to
use them in the activity assays. Antimicrobial tests were carried out according to
concentration of propolis extract that inhibited visible growth, as indicated by the TCC staining (dead cells are not stained by TTC). All the tests were performed in triplicate (n= 3). The results are expressed as mg/mL.
2.9. Statistical analysis
Each propolis sample was analysed in triplicate. Results are shown as arithmetic mean values ± standard deviation. In each parameter, the differences between propolis were analysed using one-way analysis of variance (ANOVA) followed by Tukey’s HSD. P values less than or equal to 0.05 were evaluated as statistically sig-nificant. This treatment was carried out using SAS v. 9.1.3 program (SAS Inc., New York City, USA).
3. Results and discussion
3.1. Palynological identification
Results of bee pollens’ profile analysis allow scientists to infer
the vegetation present in the area and to date and ascertain any
biodiversity change, as for example, the presence and distribution
of invasive or exotic plants (
Morais et al., 2011
). The quantification
of the pollens’ present in propolis aims to determinate its floral
ori-gin. In fact, this origin is one of the factors that influence the
bio-active
properties
of
this
product.
In
accordance
with
melissopalynological criteria (
Louveaux et al., 1970
), the following
designations of pollen frequency were used: PD for dominant
(>45%), PA for accessory (15–45%), and PI for isolated pollen loads
but important to characterize the phytogeographical origin of the
sample (3–15%).
The pollen profiles obtained for the three samples are presented
in
Fig. 1
. Marked differences were found among the samples. In the
propolis from Bragança, with brown colour, the botanical specie
with higher percentage was
Erica
sp. (47.29% ± 5.89), followed by
Castanea sativa
(21.08% ± 2.27). Concerning the sample from
Coimbra (dark yellow propolis),
Populus tremula
was the dominant
specie
(55.10% ± 5.87),
however,
the
species
Salix
sp.
(35.82% ± 3.78) and
Rubus
sp. (9.08% ± 0.99) were also found. In
propolis from Beja (green–brown colour),
Eucalyptus
sp. was the
predominant pollen, with a percentage of 60.02 and a standard
deviation of 5.89. Pollens from
Rubus
sp. and
P. tremula
were found
in all the analysed samples. The pollens’ profile was significantly
different for all the samples under study (p
< 0.05).
3.2. Total phenolics and flavonoids
According to the literature (
Bankova et al., 2000;
Gómez-Cara-vaca et al., 2006
), the majority of compounds already identified
in propolis are polyphenols. These compounds have been extracted
using different solvents: water, methanol and ethanol. In this
con-text, the efficiency of these substances was assessed.
Table 2
shows the contents of phenolic and flavonoids
com-pounds present in the different propolis extracts (hydro-alcoholic,
methanolic and aqueous), for each place (Bragança, Coimbra and
Beja). For all the propolis studied (n
= 3), water was the less
effec-tive solvent. In fact, the concentration of phenolics and flavonoids
of the aqueous extract was lower than the concentration found in
the other extracts, which showed significantly higher amounts of
those compounds. The hydro-alcoholic extract, that is not as toxic
as methanolic, was found to be the best solvent for the compounds
under study. It extracted
4.34 times more total phenolics than
the aqueous extract and
1.52 times more than the methanolic
ex-tract. The flavonoids’ concentration obtained for the
hydro-alco-holic extract was significantly higher than the amounts extracted
by methanol and by water.
Concerning the different places, propolis from Bragança was the
one that possessed higher concentration of total phenolics
(277.17 ± 7.50) and flavonoids (142.32 ± 4.52), followed by
Coim-bra’s propolis. For a 95% confidence interval (p
= 0.05), significant
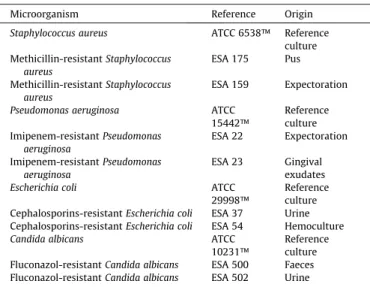
Table 1
Microorganisms used in the present study to test antimicrobial activity of propolis extacts.
Microorganism Reference Origin
Staphylococcus aureus ATCC 6538™ Reference
culture Methicillin-resistantStaphylococcus
aureus
ESA 175 Pus
Methicillin-resistantStaphylococcus aureus
ESA 159 Expectoration
Pseudomonas aeruginosa ATCC
15442™
Reference culture Imipenem-resistantPseudomonas
aeruginosa
ESA 22 Expectoration
Imipenem-resistantPseudomonas aeruginosa
ESA 23 Gingival exudates
Escherichia coli ATCC
29998™
Reference culture Cephalosporins-resistantEscherichia coli ESA 37 Urine Cephalosporins-resistantEscherichia coli ESA 54 Hemoculture
Candida albicans ATCC
10231™
Reference culture Fluconazol-resistantCandida albicans ESA 500 Faeces Fluconazol-resistantCandida albicans ESA 502 Urine
ESA (Escola Superior Agrária de Bragança); ATCC (American Type Culture Collection).
Fig. 1.Palynological spectrum of bee pollen samples. DP – Dominant Pollen (>45%);
AP – Acessory Pollen (15–45%); IP – Isolated Pollen (<15%).
Table 2
Concentration (mg/g) of phenolics and flavonoids in propolis extracts from different locations (n= 27).
Extract Phenolics (mg/g) Flavonoids (mg/g) Bragançax Hydro-alcoholic 277.17 ± 7.50a 142.32 ± 4.52a
Methanolic 181.31 ± 4.71b 135.51 ± 4.18b
Aqueous 72.15 ± 1.20c 42.30 ± 2.10c
Coimbray Hydro-alcoholic 157.31 ± 1.52a 98.30 ± 6.54a
Methanolic 102.32 ± 0.59b 55.25 ± 0.33b
Aqueous 35.15 ± 0.88c 29.0 ± 1.00c
Bejaz Hydro-alcoholic 87.15 ± 4.80a 25.15 ± 2.53a
Methanolic 58.61 ± 3.10b 13.62 ± 2.49b
Aqueous 18.52 ± 1.35c 6.34 ± 0.55c
differences were found among the samples with different origins
(
Table 2
).
Globally, our results are in agreement with the data obtained by
Moreira et al. (2008)
, who studied propolis from the northeast of
Portugal. However,
Miguel et al. (2010)
obtained inferior values
when analyzing propolis from the south of the same country. This
discrepancy may be due to the great distances between the local of
origin and the different apicultural practices. In fact, our data
sug-gest that propolis from different places have different
concentra-tions of polyphenols.
The values obtained for catechin and gallic acid, which were
used as standards, were bellow the concentration obtained in this
study for flavonoids. This is in agreement with the reported by
Fal-cão et al. (2010)
and
Popova et al. (2004)
that refer the minor
importance of gallic acid in propolis from temperate zones. This
phenolic acid is mostly found in tropical samples. In propolis from
the Mediterranean region prevailed flavonoids and esters of caffeic
and ferulic acids.
Considering that the hydro-alcoholic extract was the most
effective, it was used in all the assays performed after.
3.3. UV–visible absorption spectroscopy
The absorption spectrum of the hydro-alcoholic extracts is
shown in
Fig. 2
. The spectrums of the analysed propolis were
sim-ilar, with the maximum absorption between 290 and 370 nm. In
agreement with
Castro et al. (2007)
the absorption profile between
the 270 and 330 nm (wavelength) are attributed to flavonoids and
phenolics. This suggests that the polyphenols are the biggest
constituents of propolis. The small differences (p
= 0.103) in
absor-bance values reflect the concentrations of phenolic and flavonoids
present in each propolis: propolis from Bragança possesses the
highest amount of polyphenols and also has the highest value of
absorbance.
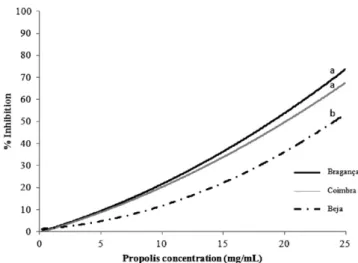
3.4. Anti-inflammatory activity
The inflammation process involves production and/or release of
mediators from neurons or damaged tissues, which are responsible
for different responses including pain. Scavenging of free radicals,
generated by neutrophils in inflammatory processes, is the
princi-pal mechanism of conventional anti-inflammatory drugs, and is
also a known property of propolis (
Paulino et al., 2003
). In this
study, we verified that all the extracts inhibited the hyaluronidase
enzyme in a dose-dependent manner (
Fig. 3
). The propolis that
showed higher inhibitory activity was the one from Bragança and
the product from Beja was the less effective. When the
concentra-tion of propolis was 25 mg/mL, the percentage of inhibiconcentra-tion was
75.79 ± 2.17% (Bragança), 70.48 ± 3.12% (Coimbra) and 53.76 ±
2.87% (Beja).
Concerning the inhibition, it were not found significant
differ-ences between the samples from Bragança and Coimbra, despite
the differences amongst the polyphenols’ concentrations. This
sug-gests that these compounds are not the only factor responsible for
the bioactive properties of this beehive product. In fact, other
con-stituents like vitamins and proteins are also involved in this
activ-ity (
Almeida-Muradian et al., 2005
).
The action mechanisms of this product haven’t yet been figured
out. However,
Hu et al. (2005)
claimed that propolis inhibited the
0 0.5 1 1.5 2 2.5 3
200 250 300 350 400 450 500
Absorbance
Wave length, nm
Bragança Coimbra Beja
Fig. 2.Absorption spectra of the ethanolic propolis extracts from different locations.
Fig. 3.Inhibition of the activity of Hyaluronidase by the propolis extracts for each
increase of prostaglandin E
2and nitric oxide production,
suggest-ing that both effects could decrease the inflammatory process.
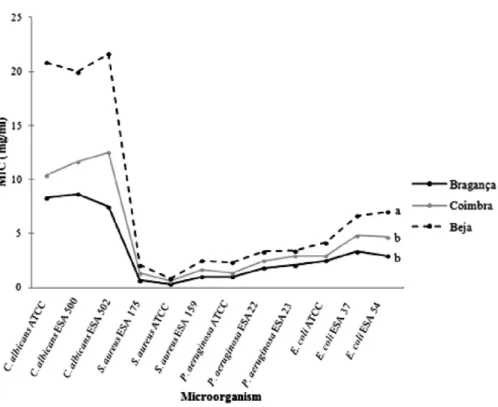
3.5. Antimicrobial activity
Some of the common nosocomial infections are urinary tract
infections, respiratory pneumonia, surgical site wound infections,
bacteremia, gastrointestinal and skin infections. According to the
Center for Disease Control and Prevention (Atlanta, USA), the most
common pathogens that cause these infections are
Staphylococcus
aureus
(Gram-positive),
Pseudomonas aeruginosa
(Gram-negative),
Escherichia coli
(Gram-negative) and
Candida albicans
(yeast). As
it is very difficult to eliminate these microorganisms, due to their
resistance to most antimicrobial agents, we decided to test the
ef-fect of propolis against them.
Table 3
and
Fig. 4
depict the obtained
results. All the propolis studied presented antimicrobial activity,
but this effect depended on the origin of the product and the
microorganism under study. Significant differences were found
be-tween the sample from Beja and the samples from Coimbra and
Bragança (p
< 0.001). The activity of the last two samples didn’t
dif-fer significantly (p
= 0.142). For all the microorganisms, the
propolis from Beja was the least effective. Concerning the
microor-ganisms, the post hoc test indicates that
C. albicans
(all the strains)
was significantly different from the others (p
< 0.001). Once its MIC
value
was
the
highest
(13.19 ± 7.21;
13.44 ± 8.23;
13.90 ± 7.512 mg/mL), it was the most resistant to the propolis’
ef-fect. The
S. aureus
was the most sensitive to the propolis’ effect
(MIC: 0.59 ± 0.30; 1.36 ± 0.74; 1.72 ± 0.87 mg/mL). As it can be
seen in
Table 3
, the propolis showed greater activity against
Gram-positive bacteria than against Gram-negative. These results
are in agreement with those of
Vardar-Ünlü et al. (2008)
and
Kim and Chung (2011)
. This may be explained by the structural
dif-ferences of the bacterial cell wall of Gram-positive and
Gram-neg-ative bacteria. Gram-negGram-neg-ative bacteria, apart from the cell
membrane, possess an additional outer layer membrane, which
consists of phospholipids, proteins and lipopolysaccharides, and
this membrane is impermeable to most molecules (
Silici and
Kutl-uca, 2005
).
Even though the action mechanisms aren’t fully understood, the
antimicrobial activity is potentially due to rutin, quercetin,
naringenin. These compounds increase the permeability of the
in-ner bacterial membrane, nullifying its potential, decreasing the
ATP production, the membrane transport and its mobility (
Tsu-chiya and Iinuma, 2000
). In addition, they inhibit the DNA gyrase
which involves in the mechanism of DNA and RNA synthesis of
bacteria (
Mirzoeva et al., 1997
).
Table 3
Minimum Inhibitory Concentration (mg/mL) for the studied microorganisms and relation between the same specie (reference culture and isolated microorganisms), independently of propolis’ origin.
Microorganism Mean ± standard deviation
Microorganism’s effect (p -value)
S. aureusATCC 0.59 ± 0.30b (<0.001)*** S. aureusESA 175 1.36 ± 0.74a
S. aureusESA 159 1.72 ± 0.87a
P. aeruginosaATCC 1.56 ± 0.67b (0.035)* P. aeruginosaESA
22
2.56 ± 1.07a
P. aeruginosaESA 23
2.81 ± 1.18a
E. coliATCC 3.19 ± 0.93b (0.043)* E. coliESA 37 4.94 ± 1.42a
E. coliESA 54 4.86 ± 1.90a
C. albicansATCC 13.19 ± 7.21a NS (0.968)
C. albicansESA 500
13.44 ± 8.23a
C. albicansESA 502
13.90 ± 7.512a
The letters a and b symbolise means that are significantly different. NS – non-significant.
*p< 0.05. ***p< 0.001.
Fig. 4.Minimum inhibitory concentration (mg/mL) for each place and microorganism. The letters (a,b) represent which samples are different by Tukey test with significance
Globally, the drug-resistance strains were more resistant to the
hydro-alcoholic extract action than the reference strains (
Table 3
).
Apart from
Candida, it were found significant differences between
the reference stains and the ones isolated from biological fluids.
These results, which are corroborated by
Onlen et al. (2007)
,
suggest that the simultaneous use of propolis and antibiotics
may reduce the acquisition of resistances and consequently avoid
the use of more powerful antibiotics.
4. Conclusions
This study is the first approach to the antimicrobial and
anti-inflammatory activities of Portuguese propolis. It was verified that
the water and ethanol is the best solvent for polyphenols
(hydro-alcoholic extract). It was demonstrated that the hydro-(hydro-alcoholic
propolis’ extract, at very low concentrations can inhibit the
hyal-uronidase enzyme. More experiments in relation to this theme
should be done to confirm the anti-inflammatory activity of
prop-olis extract. In addition, propprop-olis evidenced considerable
antimi-crobial activity, as it inhibited the growth of yeasts,
Gram-negative and Gram-positive bacteria, being the latter the most
sen-sitive to this beehive product’s action. Overall, these findings
sup-port that Portuguese propolis is a promising therapeutic agent in
diseases caused by drug-resistant microorganisms and in
inflam-mations’ prevention.
In further studies, the next step seems to be the elucidation of
the propolis’ action mechanisms and the compounds responsible
for these beneficial properties, in order to take advantage of this
natural product, which is, apparently free of any non-desirable
sec-ondary effects.
Conflict of Interest
The authors declare that there are no conflicts of interest.
References
Almeida-Muradian, L.B., Pamplona, L.C., Coimbra, S., Barth, O., 2005. Chemical composition and botanical evaluation of dried bee-pollen pellets. Journal of Food Composition and Analysis 18, 105–111.
Bankova, V.S., De Castro, S.L., Marcucci, M.C., 2000. Propolis: recent advances in chemistry and plant origin. Apidologie 31, 3–15.
Banskota, A.H., Tezuka, Y., Adnyana, I.K., Ishii, E., Midorikawa, K., Matsushige, K., Kadota, S., 2001. Hepatoprotective and anti-Helicobacter pylori activities of constituents from Brazilian propolis. Phytomedicine 8, 16–23.
Braga, P.C., Sasso, M.D., Culici, M., Bianchi, T., Bordoni, L., Marabini, L., 2006. Anti-inflammatory activity of thymol: inhibitory effect on the release of human neutrophil elastase. Pharmacology 77, 130–136.
Castro, M.L., Cury, J.A., Rosalen, P.L., Alencar, S.M., Ikegaki, M., Duarte, S., Koo, H., 2007. Própolis do sudeste e nordeste do brasil: influência da sazonalidade na atividade Antibacteriana e composição fenólica. Quimica Nova 30, 1512–1516. CUPOD, Cambridge University Palynological Online Database. The resource can be
found at: <http://www.quaternary.group.cam.ac.uk/pollen/>.
Falcão, S.I., Vilas-Boas, M., Estevinho, L.M., Barros, C., Domingues, M.R., Cardoso, S., 2010. Phenolic characterization of Northeast Portuguese propolis: usual and unusual compounds. Analytical and Bioanalytical Chemistry 396, 887–897. Gómez-Caravaca, A.M., Gómez-Romero, M., Arráez-Román, D., Segura-Carretero, A.,
Fernández-Gutiárrez, A., 2006. Advances in the analysis of phenolic compounds in products derived from bees. Journal of Pharmaceutical and Biomedical Analysis 41, 1220–1234.
Hu, F., Hepburn, H.R., Li, Y., Chen, M., Radloff, S.E., Daya, S., 2005. Effects of ethanol and water extracts of propolis (bee glue) on acute inflammatory animal models. Journal of Ethnopharmacology 100, 276–283.
Kim, Y.H., Chung, H.J., 2011. The effects of Korean Propolis against foodborne pathogens and transmission electron microscopic examination. New Biotechnology 28, 713–718.
Koo, H., Rosalen, P.L., Cury, J.A., Park, Y.K., Bowen, E.H., 2002. Effects of compounds found in propolis inStreptococcus mutansgrowth and glusyltransferaseactivity. Antimicrobial Agents and Chemotherapy 46, 1302–1309.
Kumazawa, S., Hamasaka, T., Nakayama, T., 2004. Antioxidant activity of propolis of various geographic origins. Food Chemistry 84, 329–339.
Libby, P., Ridker, P.M., Maseri, A., 2002. Inflammation and atherosclerosis. Circulation 105, 1135–1143.
Libério, S.A., Pereira, A.L., Araújo, M.J., Dutra, R.P., Nascimento, F.R., Monteiro-Neto, V., Ribeiro, M.N., Gonçalves, A.G., Guerra, R.N., 2009. The potential use of propolis as a cariostatic agent and its actions on mutans group streptococci. Journal of Ethnopharmacology 125, 1–9.
Louveaux, J., Maurizia, A., Vorwohl, G., 1970. Methods of melissopalynology by International Commission for Bee Botany of IUBS. Bee World 51, 125–138. Midorikawa, K., Banskota, A.H., Tezuka, Y., Nagaoka, T., Matsushige, K., Message, D.,
Huertas, A.A.G., Kadota, S., 2001. Liquid chromatography–mass spectrometry analysis of propolis. Phytochemical Analysis 12, 366–373.
Miguel, M.G., Nunes, S., Dandhlen, S.A., Cavaco, A.M., Antunes, M.D., 2010. Phenols and antioxidant activity of hydro-alcoholic extracts of propolis from Algarve, South of Portugal. Food and Chemical Toxicology 48, 3418–3423.
Mirzoeva, O.K., Grishanin, R.N., Calder, P.C., 1997. Antimicrobial action of propolis and some of its components: the effects on growth, membrane potential and motility of bacteria. Microbiological Research 152, 239–246.
Morais, M., Moreira, L., Feás, X., Estevinho, L.M., 2011. Honeybee-collected pollen from five Portuguese Natural Parks: palynological origin, phenolic content, antioxidant properties and antimicrobial activity. Food and Chemical Toxicology 49, 1096–1101.
Moreira, L., Dias, L.G., Pereira, J.A., Estevinho, L., 2008. Antioxidant properties, total phenols and pollen analysis of propolis samples from Portugal. Food and Chemical Toxicology 46, 3482–3485.
Onlen, Y., Duran, N., Atik, E., Savas, L., Altug, E., Yakan, S.A., Aslantas, O., 2007. Antibacterial activity of propolis against MRSA and synergism with topical mupirocin. Journal of Alternative and Complementary Medicine 13, 713–718. Park, Y.K., Alencar, S.M., Aguiar, C.L., 2002. Botanical origin and chemical
composition of Brazilian propolis. Journal of Agricultural and Food Chemistry 50, 2502–2506.
Park, Y.M., Koo, M.H., Abreu, J.A.S., Ikegagaki, M., Cury, J.A., 1998. Antimicrobial activity of propolis on oral microorganisms. Current Microbiology 36, 24–38. Paulino, N., Dantas, A.P., Bankova, V., Longhi, D.T., Scremim, A., Castro, S.L., Calixto,
J.B., 2003. Bulgarian propolis induces analgesic and anti-inflammatory effects in mice and inhibits in vitro contraction of airway smooth muscle. Journal of Pharmacological Sciences 93, 307–313.
Popova, M., Bankova, V., Butovska, D., Petkov, V., Nikolova-Damyanova, B., Sabatini, A., Marcazzan, G., Bogdanov, S., 2004. Validated methods for the quantification of biologically active constituents of poplar-type propolis. Phytochemical Analysis 15, 235–240.
Quiroga, E.M., Sampietro, D.A., Soberón, J.R., Sgariglia, M.A., Vattuone, M.A., 2006. Própolis from the northwest of Argentina as a source of antifungal principles. Journal of Applied Microbiology 101, 103–110.
Schnitzler, P., Neuner, A., Nolkemper, S., Zundel, C., Nowack, H., Sensch, K.H., Reichling, J., 2010. Antiviral activity and mode of action of propolis extracts and selected compounds. Phytotherapy Research 24, S20–28.
Silici, S., Kutluca, S., 2005. Chemical composition and antibacterial activity of propolis collected by three different races of honeybees in the same region. Journal of Ethnopharmacology 99, 69–73.
Tsuchiya, H., Iinuma, M., 2000. Reduction of membrane fluidity by antibacterial sophoraflavone G isolated fromSophora exigua. Phytomedicine 7, 161–165. Umthong, S., Phuwapraisirisan, P., Puthong, S., Chanchao, C., 2011. In vitro
antiproliferative activity of partially purifiedTrigona laevicepspropolis from Thailand on human cancer cell lines. BMC Complementary and Alternative Medicine 11, 30–37.
Valente, M.J., Baltazar, A.F., Henrique, R., Estevinho, L.M., Carvalho, M., 2011. Biological activities of Portuguese propolis: protection against free radical-induced erythrocyte damage and inhibition of human renal cancer cell growth
in vitro. Food and Chemical Toxicology 49, 86–92.
Vardar-Ünlü, G., Silici, S., Ünlü, M., 2008. Composition and in vitro antimicrobial activity ofPopulus budsand poplar-type propolis. World Journal of Microbiology and Biotechnology 24, 1011–1017.