Faculdade de Engenharia da Universidade do Porto
Tese de Programa Doutoral em Engenharia
Biomédica
Carolina Júlia Félix Vila-Chã
Thesis submitted to the Faculty of Engineering in fulfillment of the requirements
for the degree of Doctor of Philosophy in Biomedical Engineering
Supervisor: Prof. Dr. Miguel Velhote Correia
Co-supervisor: Prof. Dr. Dario Farina
Grant
The Fundação para a Ciência e Tecnologia (FCT) of Portugal supported the candidate with a
Preface
This thesis is based on the experimental work carried out during the period September 2007 -
December 2010 in the laboratory of Neural Engineering and Neurophysiology of Movement of
the Center for Sensory-Motor Interaction - Aalborg University – Denmark.
From this work resulted three original manuscripts which have been published (or accepted
for) in international peer-reviewed journals. The papers upon which this thesis is based are as
follows:
Study I: Vila-Chã C, Falla D, Farina D. Motor unit behavior during submaximal contractions following six weeks of either endurance or strength training program. J
Appl Physiol. 2010 Nov;109 (5):1455-66.
Study II:Vila-Chã C, Falla D, Correia M, Farina D. Adjustments in Motor Unit Properties during Fatiguing Contractions Following Training. Med Sci Sports Exerc. Sep 7, 2011.
(Epub ahead of print)
Study III: Vila-Chã C, Falla D, Correia M, Farina D. Changes in H-reflex and V-wave following short-term endurance and strength training. J Appl Physiol. Oct 13, 2011
(Epub ahead of print)
Some of the findings reported in this thesis have been presented in abstract form at the
following international conferences:
Vila-Chã C, Falla D, Correia M, Farina D. (2010). Effects of short-term endurance and
strength training on motor unit conduction velocity (oral presentation). XVIII Congress
of the International Society of Electrophysiology and Kinesiology, Aalborg, Denmark,
June- 16-19
Vila-Chã C, Falla D, Correia M, Farina D. (2009). Differences in motor unit behavior
following endurance and strength training. (poster presentation). Neuroscience.
Acknowledgements
This dissertation would not have been possible without the scientific contribution and
emotional support of several people whom I would like to express my sincere gratitude, in
particular to:
My supervisor, Professor Miguel Velhote Correia for encouraging me in this doctorate
project and for helping me to reach the necessary conditions for a long training period in
the Sensory-Motor Interaction (SMI) at Aalborg University - Denmark. I am also very
thankful for his meaningful scientific contributions for this thesis as well as for his support
and encouragement during the moments of doubts.
My co-supervisor, Professor Dario Farina and Professor Deborah Falla, for promptly
receiving me in their research group and for offer all the laboratory conditions to develop
the Ph.D project. The accomplishment of this work would have been barely possible
without their innumerous, valuable and inspiring discussions throughout these years. Their
contributions in experimental design and implementation as well as for their constructive
support in the elaboration of the manuscripts, greatly improve the quality of this work. I am
also very grateful for giving me the opportunity to participate in other research projects
contributing to my scientific development.
My dear colleagues at SMI that have made just unforgettable the 3 years that I lived in Denmark. I would like to thank them for the cultural exchange, for the “cappuccino morning” on Saturdays, for the cultural dinners on the weekends and for having made the distance less hard of supporting. Special thanks to a singular person that picked me up from
the train station when I arrived to Aalborg for the first time; thank you very much Silvia
Muceli, for your friendship, for your technical support, for being always interested in
helping me (even when you were awfully busy). I also thank Francesco Negro, not only for
his friendship but also for making so easy and enthusiastic the technical problems that, at
vi
My family, without their support I would never dare to delve into such scientific experience.
I am incredibly grateful for their wonderful support and constant encouragement. Above
all, I thank to my husband Nuno for his love and unconditional support throughout the
period that we were 3000km apart from each other, delaying our life plans.
The FCT, for awarding the grant that enabled my research (SFRH / BD / 31796 / 2006) and
allowed the international cooperation.
The Polytechnic Institute of Bragança for endowing me an off-duty time so that I could fully
Abstract
Over the last decades, it has been shown that the human neuromuscular system is highly
adaptive and can be modified in response to different motor training programs. Depending on
the demands of the motor training, the adaptations seem to involve distinct structural and
functional changes across the motor cortex, spinal cord and skeletal muscle. The technological
development observed in the last years, increased the use of electrophysiological techniques to
assess the neuromuscular adaptations to motor training. Nonetheless, the current evidences
on the neuromuscular adaptations to different motor training are inconsistent and incomplete,
in particular regarding endurance and strength training. This is mainly due to lack of studies
based on a rigorous consideration of the limitations of the available techniques. Therefore, the
main goal of this dissertation is to give new insights on the adaptations of the neuromuscular
system by systematically investigating the changes in its central and peripheral properties in
response to endurance and strength training. For this purpose, recent developed techniques
for recording and processing electromiographycal (EMG) signals were applied. The first study
(STUDY I) investigated if 6 weeks of either endurance or strength training alters the motor
unit behavior and if such changes were accompanied by alterations in muscle fiber properties.
Intramuscular and multichannel surface EMG recordings were used to investigate the motor
unit discharge rates and motor unit conduction velocity (MUCV) of the vastus medialis
obliquus and vastus lateralis during submaximal isometric contractions. The results
demonstrated that endurance training increased endurance capacity and was accompanied by
a decrease of the motor unit discharge rates. In contrast, strength training enhanced maximum
force output and was accompanied by an increase of the motor unit discharge rates. By the end
of 6 weeks of training, both training programs elicited increases in the motor unit conduction
velocity, revealing electrophysiological adaptations of the muscle fiber membrane properties
in similar directions. However, in the first 3 weeks of training, when changes in motor unit
discharge rates were most marked, changes in MUCV were not observed. These findings reveal
different time courses of some of the neural and peripheral adaptations in response to
viii
neuromuscular fatigue profiles among endurance and strength-trained athletes. Therefore, the
aim of the second study (STUDY II) was to investigate the effects of 6 weeks of endurance and
a strength training program on acute responses of the muscle fiber membrane properties and
discharges rates of low threshold motor units of the vastus medialis obliquus and vastus
lateralis muscles during prolonged submaximal isometric contractions. The conduction
velocity of the individual motor units was estimated from the averaged multichannel EMG
surface potentials by a spike triggered average technique. It was shown that motor unit
discharge rate declines over the duration of the sustained contraction and their trend was not
significantly affected by training. Conversely, the rate of decline of motor unit conduction
velocity during sustained contractions was reduced following six weeks of both endurance and
strength training, however a greater reduction is observed following endurance training.
These alterations likely contribute to longer times to task failure following endurance training.
The third study (STUDY III) intended to clarify the mechanisms involved in the opposite
adjustments of the motor unit discharge rate observed in the study I. The results revealed that
following 3 weeks of endurance training the excitability in the H-reflex pathway increased but
the wave amplitude remained unchanged. In contrast, following strength training the
V-wave amplitude increased whereas subtle changes were observed in the H-reflex pathway.
These results suggest that the elements of the H-reflex pathway are strongly involved in
chronic adjustments in response to endurance training, contributing to enhance resistance to
fatigue. Conversely, following strength training, it is more likely that increased descending
neural drive during MVC and/or modulation in afferents other than Ia afferents contributed to
increased motoneuron excitability and maximal voluntary contraction.
The present work revealed for the first time that endurance and strength training induces
opposite adjustments in the motor unit behavior. Moreover, the distinct adjustments in the
spinal cord output, seems to result from changes in different neural mechanisms located at
supraspinal and/or spinal level. The neural adjustments following endurance training seems to
result from changes at spinal level whereas the adjustments following strength training are
likely due to changes at supraspinal level. These adaptations occurred following a short period
of training, while no changes in the contractile and electrophysiological properties of the
muscle fibers were detectable. Changes at peripheral level occurred only following a longer
Resumo
Ao longo das últimas décadas, tem sido demonstrado que o sistema neuromuscular do ser
humano é extramente adaptativo, podendo as suas propriedades serem alteradas em resposta
a diferentes programas de treino motor. Dependendo das exigências do treino motor, as
adaptações parecem implicar diferentes estruturas e funções a nível do córtex cerebral,
medula espinal e sistema músculo-esquelético. O desenvolvimento tecnológico, observado nos
últimos anos, favoreceu a aplicação de diversas técnicas electrofisiológicas para aceder às
propriedades centrais e periféricas do sistema neuromuscular. Contudo, as actuais evidências
sobre as adaptações neuromusculares impostas por diferentes tipos de treino são
inconsistentes e incompletas, particularmente no âmbito do treino de resistência aeróbia e
força muscular. Este facto prende-se essencialmente com a falta de estudos baseados numa
rigorosa ponderação das limitações associadas às técnicas electrofisiológicas actualmente
existentes. Tendo por base estes pressupostos, o principal objectivo desta tese centrou-se em
providenciar novos conhecimentos sobre adaptações do sistema neuromuscular ao treino de
resistência aeróbia e força muscular através de aplicação de técnicas electrofisiológicas
avançadas, recentemente desenvolvidas. Para este efeito foram desenvolvidos três estudos
principais. O primeiro estudo (STUDY I) teve como objectivo compreender se o treino de
resistência aeróbia ou de treino de força alteram o comportamento das unidades motoras
(propriedades centrais) e se tais alterações são também acompanhadas por modificações das
propriedades electrofisiológicas das fibras musculares (propriedades periféricas). Para este
efeito foram utilizados técnicas de electromiografia multicanal de profundidade e de superfície
para investigar a frequência de disparo e a velocidade de propagação dos potenciais de acção
das unidades motoras dos músculos vasto medial e vasto lateral, durante contracções
isométricas submáximas. Os resultados demonstraram que o treino de resistência aeróbia
aumentou a capacidade de resistência à fadiga, que foi acompanhado por uma diminuição da
frequência de disparo das unidades motoras. Contrariamente, o treino de força aumentou a
capacidade de força e aumento a frequência de disparo das unidades motoras. No final de seis
x
condução das unidades motoras, revelando adaptações electrofisiológicas das fibras
musculares. Contudo, nas três primeiras semanas, período em que as modificações do
comportamento das unidades motoras foram mais evidentes, não se observaram alterações na
velocidade de propagação dos potenciais de acção. As alterações observadas podem contribuir
para as diferenças nos perfis de fadiga neuromuscular existente entre os atletas de provas de
resistência aeróbia e os atletas de provas de força muscular. Assim, o objectivo do segundo
estudo (STUDY II) foi investigar os efeitos de seis semanas de treino (resistência aeróbia ou
força muscular) na resposta aguda: (i) das propriedades electrofisiológicas das membranas
das fibras musculares e (ii) da frequência de disparo das unidades motoras de baixo limiar de
recrutamento dos músculos vasto medial e vasto lateral, durante contracções isométricas
submáximas prolongadas. A velocidade de condução das unidades motoras foi estimada a
partir dos valores médios dos potenciais de acção registados com sistemas de electromiografia
multicanal utilizando a técnica de média desencadeada por impulsos (“spike triggered average”) com base no sinal intramuscular. Foi demonstrado que durante contracções isométricas prolongadas, a frequência de disparo das unidades motoras declina ao longo do
tempo e esta tendência não é alterada por nenhum dos tipos de treino utilizado no estudo.
Também se verificou, que a velocidade de condução das unidades motoras declina durante
contracções isométricas prolongadas. No entanto o treino alterou a taxa de declínio. Após seis
semanas, ambos os tipos de treino, reduziram a taxa de declínio da velocidade de condução das
unidades motoras, sendo essa redução significativamente maior para o grupo do treino de
resistência aeróbia. Estas alterações parecem contribuir para retardar o aparecimento do
momento de exaustão. O objectivo do terceiro estudo (STUDY III) foi clarificar os mecanismos
neurais potencialmente envolvidos nas adaptações opostas do comportamento das unidades
motoras identificadas no estudo I. Os resultados revelaram que, após três semanas de treino de
resistência aeróbia a excitabilidade do circuito do reflexo de Hoffman (reflexo H) aumentou significativamente mas a amplitude da resposta volitiva (“V-wave”) permaneceu inalterada. Em contraste, o treino de força muscular aumentou a resposta volitiva e apenas alterações subtis
do reflexo H foram observadas. Estes resultados sugerem que elementos do circuito do reflexo
H estão fortemente envolvidos nas adaptações crónicas ao treino de resistência aeróbia
contribuindo para um aumento da resistência à fadiga. Contrariamente, o treino de força
parece aumentar o input neural descendente e/ou a modelação da informação nervosa
aferente, excluindo a Ia aferente. Estas alterações parecem contribuir para um aumento da
excitabilidade do motoneurónio e, consequentemente, da força máxima voluntária.
A presente tese demonstrou, pela primeira vez que, o treino de resistência aeróbia e de força
muscular induzem alterações opostas do comportamento das unidades motoras. Estas
alterações resultam de ajustamentos em diferentes mecanismos neurais situados ao nível da
aeróbia parecem resultar de ajustamentos neurais essencialmente ao nível da medula espinal
enquanto após treino de força muscular devem-se fundamentalmente a alterações a nível
supra-espinal. Estas adaptações ocorreram após um pequeno período de treino, na ausência de
alterações das propriedades contracteis e electrofisiológicas das fibras musculares. Alterações
periféricas do sistema neuromuscular só foram observadas após seis semanas de treino. Isto
revela que as propriedades centrais e periféricas do sistema neuromuscular do ser humano
Contents
Preface ... iii
Acknowledgements ... v
Abstract ... vii
Resumo ... ix
Contents ... xiii
List of figures... xvii
List of tables ... xxiii
Abbreviations ... xxv
Introduction ... 1
PART I - Literature Review ... 7
1 Basics of movement control and muscle contraction ... 9
1.1 Motor unit ...10
1.1.1Motoneuron properties ...11
1.1.2Muscle fibers properties ...12
1.1.3Motor unit types ...14
1.2 Motor unit pool and gradation of the muscle force ...15
1.2.1Recruitment gradation ...16
1.2.2Rate gradation ...17
1.3 Synaptic input distribution ...18
2 Adaptations of the neuromuscular system to training ...21
2.1 Muscle adaptations ...22
2.2 Neural adaptations ...24
xiv
2.2.2Sites and mechanisms of the neural adaptations ...27
3 Electromyography (EMG) as a tool to assess neuromuscular adaptations ...31
3.1 EMG signal generation and detection ...32
3.1.1Intramuscular and surface EMG recording techniques ...34
3.1.2Factors influencing the EMG features ...37
3.2 Extraction of properties of the neuromuscular system from EMG signals ...39
3.2.1Global EMG variables ...39
3.2.2Motor unit control strategies ...41
3.2.3Conduction velocity estimation ...45
3.3 Electromyographic responses to peripheral nerve stimulation ...52
3.3.1Electrically evoked potentials ...53
3.3.2Changes in spinal input investigated by electrically evoked potentials ...54
PART II - Experimental Studies, General Discussion and Conclusions ...57
4 Study I ...59
Motor unit behavior during submaximal contractions following six weeks of either endurance or strength training program. ...59
Abstract...61
4.1 Introduction ...61
4.2 Methods ...63
4.3 Results ...68
4.4 Discussion ...75
4.5 Conclusion ...81
Bibliography ...82
5 Study II ...87
Adjustments in Motor Unit Properties during Fatiguing Contractions Following Training ...87
Abstract...89
5.1 Introduction ...89
5.2 Methods ...90
5.3 Results ...95
5.4 Discussion ...99
5.5 Conclusion ... 102
Bibliography ... 103
6 Study III ... 105
Abstract... 107
6.1 Introduction ... 107
6.2 Methods ... 109
6.3 Results ... 114
6.4 Discussion ... 120
6.5 Conclusion ... 124
Bibliography ... 125
7 General Discussion and Conclusions ... 127
7.1 General discussion ... 127
7.2 Conclusions ... 131
7.3 Limitations and recommendations for future work ... 132
List of figures
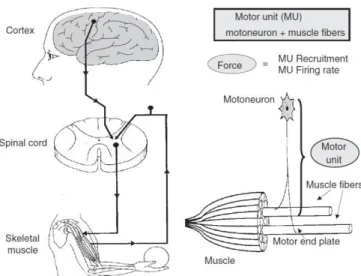
Figure 1-1– Schematic representation of basic movement control mechanisms, motor unit and its components [from Moritani et al. (2004)]. ... 10
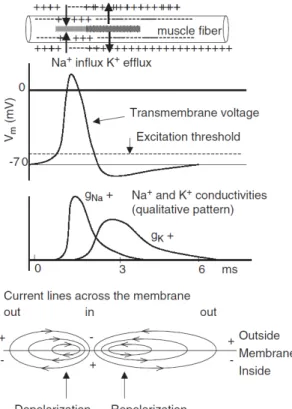
Figure 1-2 - Representation of the generation and propagation of an action potential in an excitable cell. The influx of Na+ followed by the efflux of K+ creates a quick voltage
change called action potential. The cell depolarizes the membrane potential becomes less negative and repolarizes as it returns to resting membrane potential (-70mV). One action potential triggers another in the plasma membrane just distal to it until the end of the length of the membrane. The local circuit currents spread the depolarization to the left into the unexcited membrane [adapted from Moritani et al. (2004)]. ... 13
Figure 1-3- Discharge rate behavior of 60 motor units during a progressive increment of the isometric voluntary contraction of the extensor digitorum communis muscle. The motor units are gradually recruited and their discharge rate is increasing progressively [from Monster and Chan (1977)]. ... 16
Figure 2-1 – Potential sites where the neural adaptations to training may occur: (1) enhanced output from the supraspinal centers; (2) reduced co-activation of the antagonist muscles; (3) greater activation of agonist and synergist muscles; (4) enhanced coupling among spinal interneurons (IN) that produces cross-education; (5) changes in descending drive that influence the bilateral deficit; (6) shared input to motoneurons that increases motor unit synchronization; (7) greater muscle activation and (8) heightened excitability of motoneurons as indicated by reflex potentiation and motoneuron plasticity. INe– interneurons that
project to motoneurons innervating extensor muscles; INf– interneurons that project
to motoneurons innervating flexor muscles; MNe – motoneurons innervating
extensor muscles; MNf– motoneurons innervating flexor muscles [from Semmler and
Enoka (2000)]. ... 25
xviii
tissues between the signal sources and the recording sensors [adapted from Merletti et al. (2001a)]. ... 32
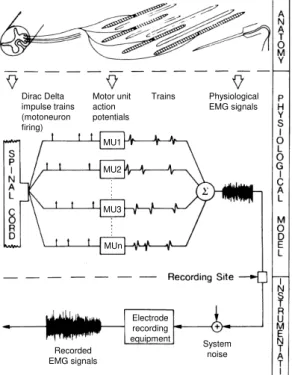
Figure 3-2 - Schematic representation of the model for the generation of EMG signals. The inputs to the filter bank are Delta trains which reflect the central nervous system activation strategy and impulse responses are the motor unit action potentials. The physiological EMG signals correspond to the sum of all trains of motor unit action potentials. Nonetheless the recorded signal is affected by several factors, including instrumentation properties and volume conductor [adapted from De Luca (1979)]. ... 33
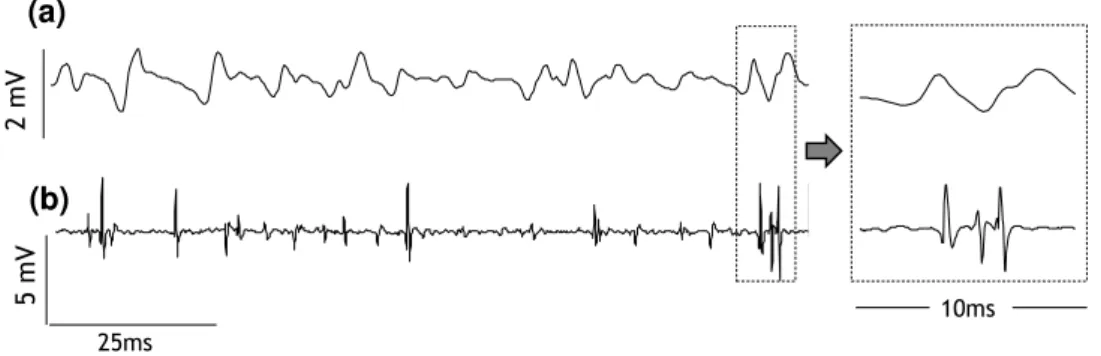
Figure 3-3 - Example of EMG signals recorded with surface (a) and intramuscular (b) electrodes in a single differential configuration. Both signals were collected simultaneously from the vastus medialis obliquus during an isometric contraction at 10% of maximum voluntary contraction. In the right panel it is possible to identify the action potentials belonging to three distinct motor units in the intramuscular but not in the surface recordings. Figure plotted with data from study I. ... 34
Figure 3-4 - The figure shows the types of intramuscular electrodes commonly used in clinical and research field. (a) Needle electrodes with different shapes and sizes of the detection area. (b) A pair of wire electrodes made of Teflon coated stainless steel with a detection area of 0.05mm2, used for the study I and II. ... 35
Figure 3-5 - Type of surface electrodes used to detect surface EMG signal. (a) The classic system compromises 2 electrodes that vary in size and shape of the surface area and inter-electrode distance. (b)Linear electrodes arrays are typically used to identify innervation zones and to estimate conduction velocity. They may contain 4 to 16 electrodes in the same array and the inter-electrode distance may vary between 2.5 mm and 10mm. The matrix or grids may be constituted up to 100 electrodes and the inter-electrode distances ranges in the order of a few millimeters... 36
Figure 3-6 - Example of the EMG signal recorded with linear electrode array, in single differential configuration during a strong contraction of the vastus medialis muscle (a). The EMG amplitude is minimal over the innervation zone (1) and the propagation of the action potentials can be observed in opposite directions towards tendon terminations (2 and 3). Right side of the figure shows the variations of (b) amplitude (averaged rectified value), (c) spectrum (median power frequency) and (d) conduction velocity estimated along the muscle length [adapted from Rainoldi et al. (2004)]. ... 38
Figure 3-7 – Schematic representation of source, detection and decomposition of five superimposed motor-unit action potential trains that contribute to a detected intramuscular EMG signal [from De Luca et al. (1982)]. ... 41
Figure 3-9 – Discharge panel displaying the discharge rate patterns plotted as instantaneous discharge rates (smoothed with a 2 Hz zero-phase-shift low pass filter). The figure shows the same data displayed in the Fig. 3-8. ... 45
Figure 3-10 – Scheme and raw surface EMG signals detected with longitudinal and transversal single and double differential (LSD, TSD, LDD, TDD, respectively), Laplacian filter (NDD) in the tibialis anterior [adapted from Farina et al. (2003a)]. ... 48
Figure 3-11 – Representative EMG signal acquired with a linear surface array (16 channels and 10 mm inter-electrode distance) during an isometric contraction of the tibialis anterior at 25% of the maximal voluntary force. Clear propagation of MUAPs along the array can be recognized by visual inspection of the acquired signals [adapted from Farina et al. (2002a)]. ... 49
Figure 3-12 – Example of estimation of single motor unit CV from twenty averaged MUAPs, using different number of surface EMG channels. From the figure, it is evident the difference between the optimal number of channels (six channels) and the classic two-channel regarding the variance of the CV estimation [from Farina et al. (2002a)]... 50
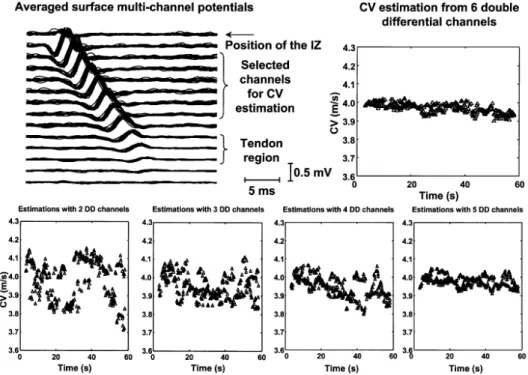
Figure 3-13– Representative EMG signal acquired with a linear surface array (8 channels and 5mm inter-electrode distance) during an isometric contraction of the vastus medialis obliquus at 30% of the maximal voluntary force (A) and estimation of global conduction velocity in consecutive non-overlapping epochs of 1s (B). Figure plotted with data from the study II. ... 51
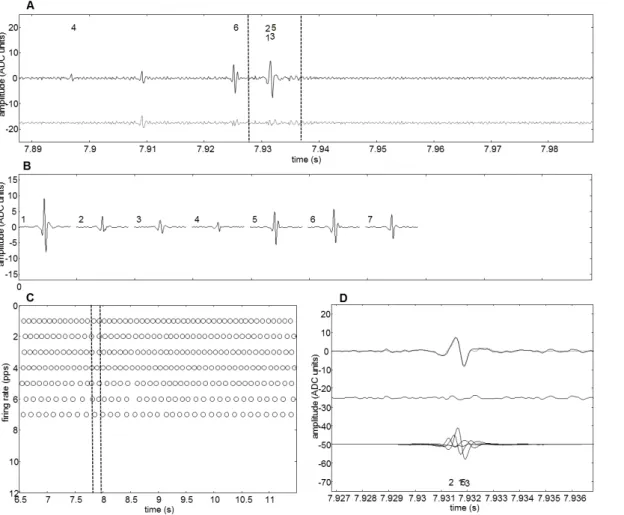
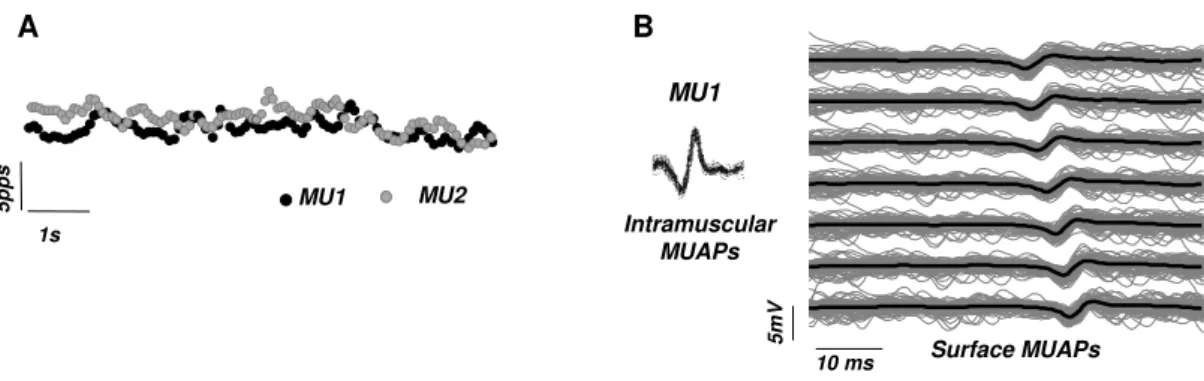
Figure 3-14– Example of the instantaneous discharge rate of two motor units identified for the vastus medialis obliquus at 30% maximal force (A). The time of occurrence of the individual motor unit action potentials in the intramuscular signals were used as trigger for averaging the multichannel surface EMG signals. (B) Example of surface averaged action potentials belonging to a motor unit (MU1). The gray lines represent the superimposed action potentials belonging to the target motor unit and the black line indicate the average potential over the seven bipolar channels. Figure plotted with data from study II... 52
Figure 3-15– (A) Illustration of the pathway of the monosynaptic reflex. Ia afferents from muscle spindle primary endings (dotted line) have monosynaptic projections to α -motoneurons innervating the corresponding muscle (homonymous MNs). The H reflex is produced by electrical stimulation of Ia afferents (1) that reach the spinal cord, which travel down the α-motoneurons axons to the muscle. Gradually increasing the stimulus intensity elicits a direct motor response (2) and simultaneously action potentials propagate antidromically (2) in the α-motoneurons axons toward the spinal cord (3) to collide with action potentials of the evoked reflex response (1), resulting in partial cancellation of the reflex response. (B) Representation of the volleys in the Ia afferents and motor axons when the stimulus intensity is progressively increased [adapted from Pierrot-Deseilligny and Burke (2005)]. ... 53
Figure 3-16 – H and M-wave recruitment curve. The amplitudes are plotted against stimulus intensity [adapted from Pierrot-Deseilligny and Burke (2005)]. ... 54
xx
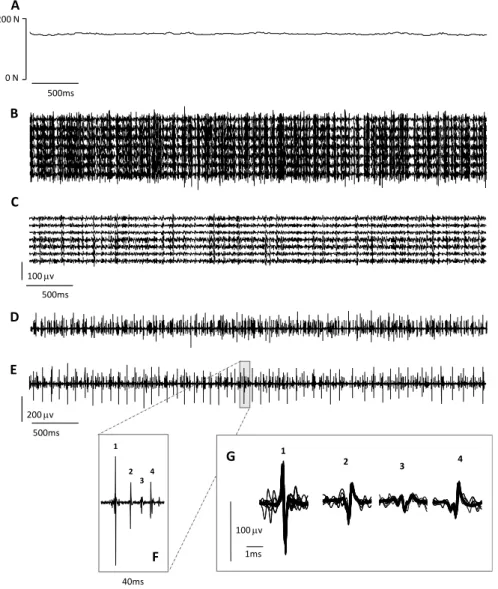
superimposed action potentials generated by the target motor units observed in the time interval illustrated in F. ... 65
Figure 4-2 - Representative recordings obtained during the explosive isometric knee extension contraction. A: force exerted by the knee extensors. B: surface EMG signals recorded from the vastus medialis obliquus. C: surface EMG signals recorded from the vastus lateralis. Surface EMG signals were analyzed in two intervals of 50-ms (gray boxes). The first interval started 70 ms prior to the onset of force (open circle) and the second interval was centered at the time instant of the maximal slope in force (black diamond). The onset of force was defined as the time instant when force exceeded 8.5 N (gray triangle). ... 67
Figure 4-3 - Changes in motor performance across the 6 week training intervention. Values are mean ± SE. A: Time to task failure assessed during isometric contractions at 30% MVC. B: Maximal voluntary contraction (MVC) of the knee extensors. C: Contractible rate of force development (RFD). *: P < 0.05. ... 69
Figure 4-4 - Mean ± SE of motor unit conduction velocity for the vasti muscles (average of the vastus medialis obliquus and vastus lateralis) during isometric knee extensions at 10% and 30% of MVC for the control (CT), endurance (ET) and strength (ST) group. *
P < 0.05... 70
Figure 4-5 – Mean ± SE for the average rectified value (ARV) of the vastus medialis obliquus (VMO) and vastus lateralis (VL) obtained during maximal (MVC) and submaximal (10% and 30% MVC) isometric knee extension contractions, across each experimental session for: - (A) Control group; - (B) Endurance Group. §: P < 0.01 from week 0 to week 3. †: P < 0.0001, from week 0 to week 3. #: P < 0.01 from week 3 to week 6. *: P < 0.05 from week 0 to week 6; - (C) Strength group. †: P < 0.0001 from week 0 to week 3. #: P < 0.05 from week 3 to week 6. **: P < 0.001 from week 0 to week 6. *: P < 0.05 from week 0 to week 6. ... 70
Figure 4-6 - Mean ± SE of the EMG average rectified value (ARV) for the vastus obliquus (VMO) and vastus lateralis (VL) obtained during the isometric explosive contractions of the knee extensors at week 0, 3 and 6 for all groups. A: ARV calculated in the time interval 0-50ms, relative to the onset of the EMG. B: ARV assessed during a time interval of 50 ms centered at the time instant of the maximum slope. *: P < 0.05; **: P < 0.001. ... 71
Figure 4-7 - Mean ± SE of motor unit discharge rate for the vastus medialis obliquus (VMO) and vastus lateralis (VL) obtained during submaximal isometric contractions of the knee extensors across experimental sessions for: - (A) Control group; - (B) Endurance group. Significant changes were only observed at 30% MVC. #: P < 0.05 from week 0 to week 3. *: P < 0.05 from week 0 to week 6. - (C) Strength group. §: P <
0.01 from week 0 to week 3. *: P < 0.01 from week 0 to week 6. ... 73
groups the coefficient of variation of the ISI was 10.1%, 6.1% and 8.9% at 10% MVC and 9.8%, 5.2% and 8.3% at 30% MVC, respectively. ... 74
Figure 4-9 - Mean ± SE of the change in mean discharge rate for motor units detected at both 10% and 30% MVC (ΔMDR) for the vastus medialis obliquus (VMO) and vastus lateralis (VL). Data are presented only for motor units that could be identified during both the contraction at 10% and 30% MVC in the same session (by visual inspection of superimposed action potential templates). (A) Control group, (B) Endurance group, (C) Strength group. *: P < 0.05; †: P < 0.001. ... 74
Figure 5-1 - Mean ± SE for the decline of the discharge rates of motor units of the vasti muscles (average of vastus medialis obliquus and vastus lateralis) recruited at the onset of the sustained knee extension contractions at 10% and 30% MVC for all groups, before and after training. ... 96
Figure 5-2 - Mean ± SE for the initial values of motor unit conduction velocity of the vasti muscles at (A) 10% MVC and (B) 30% MVC, for all groups, before and after training. *- P < 0.05 from week 0 to week 6. ** - P < 0.001 from week 0 to week 6. ... 96
Figure 5-3- Mean ± SE for the decline in motor unit conduction velocity in the vasti muscles (average of vastus medialis obliquus and vastus lateralis) during sustained knee extension contractions at 10% and 30% of MVC for all groups, before and after training. *- P < 0.05 from week 0 to week 6. ** - P < 0.001 from week 0 to week 6. †- Decline in motor unit conduction velocity after training was lower for the endurance than for the strength group (P < 0.01). ... 97
Figure 5-4 - Mean ± SE for the average rectified value of the vasti muscles obtained during submaximal isometric knee extension contractions at 10% and 30% MVC, across experimental sessions for: - (A) Control group, (B) Endurance Group and (C) Strength group. The data represent the average of the average rectified value of the vasti muscles obtained for the time intervals T1, T2, T3 and T4.. * - P < 0.05 from week
0 to week 6. **-P < 0.001 from week 0 to week 6. ... 98
Figure 5-5 -Mean ± SE for the changesin average rectified value of the vasti muscles at two submaximal isometric knee extension contractions (10 and 30% MVC) over experimental sessions for: - (A) Control group, (B) Endurance Group and (C) Strength group. The changes over different time intervals (T2, T3 and T4) were
computed relative to the initial time interval (T1). * - P < 0.05 from week 0 to week 6. .... 98
Figure 5-6- Mean ± SE for the average rectified value of the biceps femoris obtained during submaximal isometric knee extension contractions at 10% and 30% MVC, across experimental sessions for: - (A) Control group, (B) Endurance Group and (C) Strength group. The data represent the average of the average rectified value of the vasti obtained for the time intervals T1, T2, T3 and T4.. * - P < 0.05 from week 0 to week
6. **-P < 0.001 from week 0 to week 6. ... 99
Figure 6-1 - Representation of the H-reflex parameters investigated in this study. The parameters are taken from the ascending limb of the H-reflex recruitment curve. The following parameters were analyzed: (a) Maximum amplitude of the H-reflex (Hmax);
(b) current intensity at H-reflex threshold (Hthresh); (c) current intensity at 50% of the
Hmax (50%Hmax); (d) current intensity at Hmax and; (e) the slope of the ascending limb
of the recruitment curve at 50% of the Hmax (Hslope). ...113
xxii
Figure 6-3 - Evoked V-wave before (PRE-S1 and PRE-S2) and after (POST) training for a representative subject of the endurance and strength training group. ...115
Figure 6-4 - V-wave peak-to-peak amplitude normalized to Mmax measured during
maximal isometric contraction of the plantar flexors before (PRE-S1 and PRE-S2) and after (POST) training. Each line represents one subject. The thick black line represents the mean of the group. P < 0.001 when comparing POST to PRE-S1 and
PRE-S2 in the strength group. ...116
Figure 6-5 – H and M-wave recruitment curves before (PRE-S1 and PRE-S2) and after (POST) training for a representative subject of the endurance and strength training group. The abscissa represents the stimulation intensity normalized to the current at 50% Mmax and ordinate illustrates response amplitude normalized to the
corresponding Mmax. In the left superior corner is represented the average of 8 H and
M waves evoked by a current of 70-75% of 50% Mmax, before [PRE-S1 (black solid line) and PRE-S2 (gray solid line)] and after [POST (black dotted line)]. ...117
Figure 6-6.– Hmax/Mmax ratios measured during isometric contractions of the plantar
flexors at 10% of MVC before (PRE-S1 and PRE-S2) and after (POST) training. Each line represents one subject. The thick black line represents the mean of the group. P < 0.01 when comparing POST to PRE-S1 and PRE-S2. ...117
Figure 6-7 - Predicted H-reflex amplitudes evoked by the current intensity associated to the Hthresh, intensity at 50%Hmax and at Hmax observed before training. Values are
mean ± SE. A: Predicted H-reflex amplitude at Hthresh. B: Predicted H-reflex amplitude
at 50%Hmax. C: Predicted H-reflex amplitude at Hmax *: P < 0.05 and **: P < 0.001
when comparing POST to PRE-S1 and PRE-S2. †: P< 0.001 when comparing Post to
List of tables
Table 1-1– Summary of the motor unit types characteristics [from Moritani et al. (2004)]. .... 15 Table 3-1– Factors that influence the surface EMG [from Farina et al. (2004c)] ... 37 Table 3-2– Factors that influence the conduction velocity. The primary factors are those
that directly affect conduction velocity estimation. The effects of the primary factors are dependent of other parameters of the surface generation and detection [from Farina and Merletti (2004b)] ... 47
Table 4-1 – Interspike interval (ISI) variability for the motor units identified for each group (control, endurance and strength), muscle [vastus medialis obliquus (VMO) and vastus lateralis (VL)], load (10% and 30% MVC) and session (week 0, 3 and 6). ... 72
Table 6-1- Mean and standard deviation of the maximal M-wave (Mmax), H-reflex (Hmax),
slope of the ascending limb of the recruitment curve at 50% of the Hmax (Hslope),
normalized current (normalized to current at 50%Mmax) at H-reflex threshold
(Hthresh), at 50% of Hmax and at Hmax, soleus EMG activity during MVC and soleus EMG
Abbreviations
List of abbreviations
AHP - After hyperpolarization
5HT - Serotonin
ARV - Averaged rectified value
ATP - Adenosine triphosphate
ATPase - Adenosine triphosphate enzyme
CNS - Central nervous system
CSA - Cross sectional area
EMG - Electromyography
fMRI - Functional magnetic resonance imaging
H-reflex - Hoffman reflex
MEP - Motor evoked potential
MHC - Myosin heavy chain
MUAP - Motor unit action potential
MUCV - Motor unit conduction velocity
MVC - Maximal voluntary contraction
M-wave - Motor wave
P0 - Peak force
pps - Pulses per second
RFD - Rate of force development
TMS - Transcranial magnetic stimulation
V0 - Shortening velocity
Introduction
The complexity of motor actions that humans can achieve reflects the complexity of their
motor system (Enoka 2008; Latash 1998). This characteristic results from a sophisticated
interaction between biological structures that integrates the motor system of the animals and
in particular of mammalians. Although the diversity of movement depends on both skeletal
muscle and nervous system properties, it is the central nervous system (CNS) that plans and
coordinates the purposeful motor action (Ghez and Krakauer 2000). The muscles,
independently of their architecture and composition, act in response to the neural commands
to produce the required movement (Bawa 2002; Kernell 2006).
Optimization of a purposeful motor output can be achieved with practice, reflecting the
extraordinary ability of the motor system to adapt and refine the motor output towards high
efficiency. Work over recent decades has shown that not only muscle tissue, but also the
nervous system changes in response to a variety of different motor experiences, including
strength and endurance training (Adkins et al. 2006; Duchateau et al. 2006). Moreover, such
adaptations persist in the absence of continued use or training, indicating that the motor system is able to “memorize” the adaptations (Bawa 2002; Enoka 2008; Nielsen 2004).
Many different mechanisms and structures from the cortex, spinal cord and muscle are
involved in this process and, moreover, they seem to be distinct depending on the training type
(Adkins et al. 2006; Wolpaw 2010). For specific types of training, such as skill training, it is
known that there is functional and structural plasticity of the central nervous system (Perez et
al. 2005; Wolpaw 2007).However, for other types of motor training, such as endurance and
strength training, much more attention was given to muscle adaptation and cardio-respiratory
responses. Nonetheless it is increasingly recognized that many of the adaptations induced by
both training types that result in increased motor performance, may also reside at the nervous
system (Carroll et al. 2011; Gardiner 2011). The evidences suggest that the effects of strength
and endurance training on motor performance also reflect supraspinal and spinal adjustments,
Introduction
2
(Adkins et al. 2006; Gardiner 2001; Hakkinen et al. 2003). Nonetheless, as we move from the
muscle to the central nervous system, information becomes less abundant and controversial,
in particular regarding endurance training (Gardiner 2011).
Endurance and strength training, in addition to being commonly used in the rehabilitation and
exercise training fields, also represent a good model to investigate the response of the
neuromuscular system to physical activity. Because the physiological stimuli imposed by
endurance and strength training are divergent in nature (Hakkinen et al. 2003; Sale et al.
1990), it may be expected that they induce divergent changes in the neuromuscular system,
which may contribute to our understanding of the spectrum of neuromuscular adaptations to
training. Accessing such information is of great interest for applied fields such as
rehabilitation, exercise training and applied physiology. In both rehabilitation and exercise
training the objective is often to induce long–lasting changes in motor behavior, either to
restore correct motor patterns or to increase motor performance (Falla et al. 2007; Nielsen
and Cohen 2008; Zehr 2006). Thus, an adequate exercise intervention requires an
understanding of how and to which extent the neuromuscular system can be changed in
response to repeated exposure to motor training (Farina et al. 2004c; Zehr 2006).
The changes in the neuromuscular system can be investigated by applying a variety of
techniques that ranges from imaging to electrophysiology. The advantage of the
electrophysiological techniques, such as electromyography (EMG), is that they offer the
possibility of investigating simultaneously the motor output from the spinal cord as well the
electrophysiological properties of the muscle fibers (Basmajian and De Luca 1985; Merletti et
al. 2001a). Moreover, when combined with electrical stimulation of peripheral nerves changes
in spinal circuitry can be estimated (Pierrot-Deseilligny and Burke 2005).
In recent years, the use of electrophysiological techniques to investigate the potential
neuromuscular adaptations to motor training has increased. Nonetheless, the current evidence
on neuromuscular adaptations to different motor training is incomplete and inconsistent
(Carroll et al. 2011; Kernell 2006), in particular regarding endurance and strength training.
This is mainly due to lack of studies based on a rigorous consideration of the limitations of the
available techniques (Carroll et al. 2011). In addition, the available studies have employed
subjects with different physical fitness levels and applied different experimental
methodologies, which also contribute to the observed discrepancies between studies. A full
understanding of the neuromuscular adaptations to training and their time-course would not
only contribute to explaining increased motor performance but, more importantly, would help
design motor training programs and technologies to apply in the treatment of specific
Introduction
Objectives of the Ph.D. project
The main objective of this dissertation was to give new insights on the adaptations of the
neuromuscular system by systematically investigating the changes in its central and peripheral
properties in response to distinct motor training types (i.e. endurance and strength training).
For this purpose, recent developed techniques for recording and processing EMG signals were
used and particular caution was taken in the experimental design in order to allow a direct
comparison between the neural changes elicited by both training programs.
The specific objectives of this Ph.D. project were:
I. To determine how and to which extent endurance and strength training induces
changes in the motor unit behavior (central changes) and in the electrophysiological
properties of the muscle fibers (peripheral changes).
II. To investigate the time course of changes in both central and peripheral properties in
response to endurance and strength training, over the training period.
III. To determine the influence of both training types on the acute adjustments of muscle
fiber membrane properties and discharge rates of low threshold motor units during
fatiguing isometric contractions.
IV. To investigate the effects of endurance and strength training on the input to the spinal
cord by examining the Hoffman (H-) reflex and Volitional (V-) wave responses during
voluntary contractions.
These objectives were investigated in three research studies:
Study I: “Motor unit behavior during submaximal contractions following six weeks of either endurance or strength training program”. J Appl Physiol. 2010 Nov;109 (5):1455-66.
The research was structured to firstly understand if divergent motor training programs (such
as endurance and strength training), alters the neural command strategies to the lower limb
muscles and if such changes were accompanied by alterations in the muscle fiber properties.
We also intended to investigate the time course of both central and peripheral adaptations to
training and their possible interactions. Thus, the purpose of study I was to investigate and
compare changes in motor unit behavior of synergistic knee extensor muscles following 6
weeks of either strength or endurance training programs commonly used in conditioning and
rehabilitation. It was hypothesized that these two training programs would induce different
adjustments in motor unit discharge rates. In addition, muscle fiber conduction velocity was
Introduction
4
the training programs. The motor unit discharge rates and motor unit conduction velocity
were estimated from both vastus medialis obliquus and vastus lateralis muscles during
isometric knee extension at 10% and 30% of the maximum voluntary contraction (MVC). To
assess such information intramuscular and surface multichannel EMG techniques were used.
All variables were measured in the control, strength and endurance groups, before (week 0),
during (week 3), and after 6 weeks.
Study II: “Adjustments in Motor Unit Properties during Fatiguing Contractions Following
Training”. Med Sci Sports Exerc. Sep 7, 2011. (Epub ahead of print)
This study was designed to investigate if the neuromuscular adaptations observed in the
previous study affect the acute peripheral and/or central mechanisms responses during
fatiguing contractions, which may contribute for distinct neuromuscular fatigue profiles
among endurance and strength-trained athletes. Therefore, the aim of this study was to
investigate the effects of 6 weeks of endurance and a strength training program on acute
responses of the muscle fiber membrane properties and discharges rates of low threshold
motor units of the vastus medialis obliquus and lateralis muscles during prolonged isometric
contractions. Motor unit discharge rates and EMG amplitude of the vastus medialis obliquus
and lateralis muscles and biceps femoris were measured during sustained isometric knee
extensions at 10% and 30% MVC before and immediately following 6 weeks of training. The
conduction velocity of the individual motor units was estimated from the averaged
multichannel EMG surface potentials by a spike triggered average technique.
Study III: “Changes in H-reflex and V-wave following short-term endurance and strength
training”. J Appl Physiol. 2011 Oct 13. (Epub ahead of print)
Following up the evidence encountered in the preceding research, this study intended to
explore the adjustments in the spinal cord inputs that may have contributed to changes in the
motor unit behavior observed following endurance and strength training. For this purpose we
applied protocols of electrical stimulation to analyze the evoked Volitional (V-) wave, Hoffman
(H-) reflex and Motor (M-) wave recruitment curves, before and after 3 weeks of training. The
MVC and time-to-task-failure (isometric contraction at 40% MVC) of the plantar flexors were
Introduction
Thesis outline
The present thesis is divided in two parts:
Part I – Encompasses three chapters:
Chapter 1 – provides a background on the basic properties and organization of the
neuromuscular system, including basic aspects of the motor unit physiology, muscle
control and synaptic input.
Chapter 2 – reviews the literature on the neuromuscular adaptations to different motor
training, in particular to endurance and strength training. Current evidence on the
changes in muscle fiber properties, spinal motor output and neural mechanisms
involved in such alterations are discussed.
Chapter 3 – describes in detail the electrophysiological techniques that have been used
to extract information on both central and peripheral properties of the neuromuscular
system, in particular those applied in the Ph.D. project. The advantages and limitations
of these methods are also discussed.
Part II - Encompasses four chapters:
Chapter 4, 5 and 6 – presents each the original studies developed within the PhD
project that have been published or accepted for publication.
Chapter 7 – provide the general discussion of the main outcomes from the reported
studies.
Main contributions
The scientific literature on neuromuscular adaptations to motor training, have produced
inconsistent and incomplete results, largely due to methodological issues. This Ph. D. project
was designed to systematically investigate the neuromuscular adaptations elicited by
divergent motor training programs (i.e. endurance vs. strength training), which are frequently used in sports and rehabilitation fields. For this purpose different electrophysiological
techniques were combined and applied to assess both central (neural) and peripheral
(muscular) adaptations to motor training.
The studies resulting from this Ph.D. project were the first to concurrently investigate the
neuromuscular adaptations evoked by two distinct types of motor training by applying the
same experimental procedures, including the same advanced EMG techniques and training
Introduction
6
comparison of results, contributing for a better understanding of the neuromuscular
adaptations to divergent motor training programs. The novel finding of the present work was
that, at submaximal force levels, these two distinct training interventions induced divergent
adaptations in the motor unit discharge rates, but similar changes in the electrophysiological
properties of the muscle fibers. The results revealed that endurance training increases
resistance to fatigue and is accompanied by decreased motor unit discharge rates. In contrast,
strength training improves maximum force output and is accompanied by increased motor
unit discharge rates. Such adjustments in the spinal cord output, seems to result from changes
in different neural mechanisms located at supraspinal or spinal level. Based on the V-wave and
H-reflex measures, the neural adjustments following endurance training seems to result from
changes at spinal level whereas the adjustments following strength training are likely due to
PART I
1
Basics of movement control and
muscle contraction
CHAP
TE
R
1
Basics of movement control and
muscle contraction
The complexity of motor actions that humans can achieve reflects the complexity of their
motor system (Enoka 2008; Latash 1998). From intention to execution of a motor action,
several structures of the central nervous system (CNS) are involved, following a hierarchal
functional organization (Ghez and Krakauer 2000). The lowest level of this hierarchal
organization is the spinal cord, where all motor commands converge on motoneurons (Loeb
and Ghez 2000) (Fig. 1-1). They transform the internal actions of the brain into motor
behavior, translating patterns of neuronal activity into commands for skeletal muscle
contraction that may vary considerable with respect to the magnitude of force and speed
production.
Together, the motoneurons and their muscles fibers forms the neuromuscular system which
can be considered the interface between CNS and muscles (Kernell 2006). The diversity in
properties of this system (both motoneurons and muscle fibers properties) enables the same
muscle to be used across a variety of motor tasks (e.g. posture maintenance, high-precision
movements, rhythmic submaximal contractions, or powerful maximal contractions),
contributing to the high repertoire of motor behaviors that mammalians can produce
(Gardiner 2011).
The purpose of this chapter is to describe the basic properties of the neuromuscular system
involved in voluntary movement production and its variability. Some of the items discussed
are needed as background knowledge for later chapters. This includes basic aspects of motor
Part I - Literature review
10
1.1
Motor unit
The term motor unit was first introduced by Liddell and Sherrington in 1925 to designate the
basic unit of motor function (Ghez and Krakauer 2000). It is through this basic functional unit
the central nervous system controls muscle force and movement by varying its activity (Enoka
2008; Ghez and Krakauer 2000). Motor unit refers to a single motoneuron and an ensemble of
muscle fibers innervated by its axonal branches (Fig. 1-1). Each motoneuron innervates on
average 300 muscle fibers, but the range extents from tens to thousands (Enoka and Fuglevand
2001). The ensemble of muscle fibers belonging to the same motor unit is called muscle unit.
Figure 1-1 – Schematic representation
of basic movement control mechanisms, motor unit and its components [from Moritani et al. (2004)].
When a motoneuron is activated it causes all its muscles fibers to contract. Therefore, the
muscle units are the smallest fraction of muscle that the central nervous system can activate
(Kernell 2003). Within a muscle, the fibers belonging to a given muscle unit are distributed more or less uniformly through an extensive “territory” that is also shared with fibers from many other units (Burke and Tsairis 1973). This territory is restricted to a portion of the
muscle that may, as much, represent 1/5 of the total volume of the muscle (Burke 1978; Burke
et al. 1974).
A voluntary movement may involve few or even all muscle units of one or several muscles.
Indeed, for almost all kinds of motor behavior, several muscles are used together, in particular
when strong contractions are produced (Kernell 2006). Nonetheless, each muscle is typically
controlled by different groups of motor neurons referred as a motor unit pool (Burke et al.
1977). The motor unit population that forms the motor pool is heterogeneous with respect to
the properties of both motoneurons and the muscles fibers that they innervate (Burke 1975;
1. Basics of movement control and muscle contraction
circulatory features (Kernell 2003). Thus within the same muscle, there are muscles fibers
with different physiological and histochemical properties (Kernell 2003) and typically, all
muscle fibers belonging to the same muscle unit have similar properties (Burke et al. 1971;
Henneman and Olson 1965; Wuerker et al. 1965). According to the functional demands, the
nervous system activates the appropriate combination of muscle units in order to evoke the
correct force and contraction speed in all the muscles concerned (Kernell et al. 1999). This is
possible due to particular properties of the motoneurons that are closely linked to those of
their target muscle units (Gardiner 2011; Wuerker et al. 1965; Zajac and Faden 1985).
1.1.1
Motoneuron properties
The motoneurons obey commands from the CNS and assist in deciding which motor units will
be recruited and, to what extent they will be recruited (Gardiner 2011). These nerve cells
possess different properties regarding to their morphology, excitability and distribution of
input. Several features of the neuronal function depend on motoneurons morphology (Kernell
2006). Among these features, the motoneuron size has received the greatest attention (Enoka
2008). Henneman and colleagues were the first to demonstrate consistently that the
excitability of the motoneurons varied inversely with their size (Henneman 1957; Henneman
et al. 1965a; b). These observations led to the formulation of the “size principle”, which states
that motoneurons are recruited by order of their size (Henneman et al. 1965b). They speculate
on the mechanisms underlining this principle, proposing that motoneuron excitability was
related to size-associated differences in neuronal input resistance (Henneman et al. 1965b).
The subsequent studies on electrical properties of the motoneurons demonstrated that
although the amount of current needed for eliciting a single action potential (rheobase
current) depends on threshold depolarization (depolarization amplitude required to reach the
threshold for spike generation) and non-linear properties of the membrane, the input
resistance plays the major role (Gardiner 2011; Gustafsson and Pinter 1984; Kernell et al.
1999). The higher the resistance, the less current is needed for depolarizing the cell to the
threshold for action potential generation (Kernell 2006). Thus, small motoneurons with less
surface area have higher input resistance and produce larger voltage drop for a given synaptic
input than large ones, allowing them to reach threshold at a lower level of synaptic input
(Gustafsson and Pinter 1984; Kernell 1966). This translates into lower rheobase current,
indicating, therefore, that small motoneurons are more susceptible to recruitment than large
motoneurons cells (Gustafsson and Pinter 1984; Kernell 1966; Kernell and Zwaagstra 1981).
Another relevant characteristic of the small motoneurons is their long afterhyperpolarization
duration (prolonged hyperpolarization that follows the action potential, AHP) compared to
Part I - Literature review
12
property plays an important role in the rhythmic discharge patterns of the motoneurons in
response to sustained excitation (Kernell 2006). Moreover, the variation in the AHP duration is
highly correlated with variation in contractile properties across motor units (Eccles et al.
1958; Gardiner and Kernell 1990; Gossen et al. 2003).
1.1.2
Muscle fibers properties
The muscle fibers within a same muscle may differ considerably with respect to their
mechanical and biochemical properties, including power output, velocity of shortening,
adenosine triphosphate (ATP) consumption and resistance to fatigue (Bottinelli and Reggiani
2000; Burke et al. 1973). Different physiological (contractile properties), histochemical [e.g.
myofibrillar ATP enzymes (ATPase) activity] and molecular [e.g. myosin heavy chain isoforms
(MHC)] criteria have been applied to define groups of muscle fibers (Bottinelli et al. 1994;
Brooke and Kaiser 1974; Burke et al. 1971). Despite a continuous variation of the muscle fibers
properties across a wide range, the human muscle fibers have been classified into three major
types, independently of the classification scheme. The terms to define the muscle fiber types
may vary between classification systems. Nonetheless the dominant terminology has been type
I or slow-twitch and type II or fast-twitch that is then subdivided into IIa and IIx (Kernell 2006;
2003; Wilmore et al. 2008).
The results of combined physiological and histochemical studies shows that type I fibers tend
to be particularly suited to produce prolonged low-intensity activities, since that consumes
much less ATP and are highly resistant to fatigue due to their mostly oxidative metabolism
(Bottinelli et al. 1994; Brooke and Kaiser 1974; Westerblad et al. 2010). Nonetheless, they are
unable to produce very powerful movements, because of their low capacity of developing
power (Bottinelli and Reggiani 2000; Kernell 2006; Widrick et al. 1996). On the other extreme,
IIx fibers are able to develop high power at high velocity, which makes them suitable for fast
and powerful movements (Bottinelli et al. 1996; Widrick et al. 1996). However, their low
aerobic metabolism and high anaerobic power indicates that fast fibers are only able to
support short bursts of activity (Bottinelli and Reggiani 2000; Kernell 2006). The fiber type IIa
have an intermediate optimal velocity and power which are more suitable for a wide range of
movements at intermediate speeds (Bottinelli and Reggiani 2000).
Apart from the histochemical and mechanical properties, the muscle fiber types also present
differences in their electrophysiological properties. When a motoneuron is activated it
generates an end-plate potential in the muscle fibers innervated by its axonal branches,
resulting in an action potential (Loeb and Ghez 2000). Each action potential compromises
sodium (Na+) influx during the depolarization phase and potassium (K+) efflux for the
1. Basics of movement control and muscle contraction
at neuromuscular junction, the potential produces local currents of its own that depolarizes
the region adjacent to it causing the propagation of the action potential along the length of the
muscle fiber (Fig. 1-2).
The velocity with which an action potential propagates along the muscle fiber membrane
depends on the fiber diameter and might range between 2 – 6m/s (Blijham et al. 2004). The
larger the fiber diameter, the faster the action potential propagates. This is because a large
fiber offers less resistance to local current allowing more ions to flow and bringing adjacent
regions of the membrane to threshold faster. The propagation of the action potentials is
referred as to conduction velocity and it can be measured with multi-channel
electromyography (Arendt-Nielsen and Zwarts 1989).
Figure 1-2 - Representation of the generation and
propagation of an action potential in an excitable cell. The influx of Na+ followed by the efflux of K+ creates a
quick voltage change called action potential. The cell depolarizes the membrane potential becomes less negative and repolarizes as it returns to resting membrane potential (-70mV). One action potential triggers another in the plasma membrane just distal to it until the end of the length of the membrane. The local circuit currents spread the depolarization to the left into the unexcited membrane [adapted from Moritani et al. (2004)].
The conduction velocity is an important physiological parameter since it reflects the
electrophysiological properties of the muscle fibers and it provides information on the
alterations of the peripheral properties neuromuscular system to disease (van der Hoeven
1995; Zwarts et al. 2000), fatigue (Bigland-Ritchie et al. 1981; Farina et al. 2002a) or exercise
(Pozzo et al. 2004; Rainoldi et al. 2008).
Several studies observed that muscle fiber conduction velocity is positively correlated with
fiber composition (Linssen et al. 1991; Sadoyama et al. 1988) and muscle force level
(Arendt-Nielsen et al. 1984; Broman et al. 1985b), reflecting the linear association between muscle
![Table 1-1 – Summary of the motor unit types characteristics [from Moritani et al. (2004)]](https://thumb-eu.123doks.com/thumbv2/123dok_br/16988736.763536/43.892.121.769.450.718/table-summary-motor-unit-types-characteristics-moritani-et.webp)