Contents lists available atScienceDirect
Food Microbiology
journal homepage:www.elsevier.com/locate/fm
A comparison of dynamic tertiary and competition models for describing the
fate of
Listeria monocytogenes
in Minas fresh cheese during refrigerated
storage
Vasco A.P. Cadavez
a,1, Fernanda B. Campagnollo
b,c,1, Rosicléia A. Silva
b, Clara M. Duffner
d,
Donald W. Schaffner
c, Anderson S. Sant’Ana
b,∗, Ursula Gonzales-Barron
aaCIMO Mountain Research Center, School of Agriculture, Polytechnic Institute of Bragança, Bragança, Portugal bDepartment of Food Science, School of Food Engineering, University of Campinas, Campinas, SP, Brazil
cDepartment of Food Science, School of Environmental and Biological Sciences, Rutgers – The State University of New Jersey, New Brunswick, NJ, USA dBioscience, TUM School of Life Sciences Weihenstephant, Technical University of Munich, Munich, Germany
A R T I C L E I N F O
Keywords:
Soft cheese Foodborne pathogen Predictive microbiology Indigenous lactic acid bacteria
A B S T R A C T
This study compares dynamic tertiary and competition models forL. monocytogenesgrowth as a function of intrinsic properties of a traditional Brazilian soft cheese and the inhibitory effect of lactic acid bacteria (LAB) during refrigerated storage. Cheeses were prepared from raw or pasteurized milk with or without the addition of selected LAB with known anti-listerial activity. Cheeses were analyzed for LAB andL. monocytogenescounts, pH and water activity (aw) throughout cold storage. Two approaches were used to describe the effect of LAB onL.
monocytogenes: a Huang-Cardinal model that considers the effect of pH and awvariation in a dynamic kinetic
analysis framework; and microbial competition models, including Lotka-Volterra and Jameson-effect variants, describing the simultaneous growth ofL. monocytogenesand LAB. The Jameson-effect with γ and the Lotka-Volterra models produced models with statistically significant coefficients that characterized the inhibitory ef-fect of selected LAB onL. monocytogenesin Minas fresh cheese. The Huang-Cardinal model [pH] outperformed both competition models. Taking awchange into account did not improve the fit quality of the Huang-Cardinal
[pH] model. These models for Minas soft cheese should be valuable for future microbial risk assessments for this culturally important traditional cheese.
1. Introduction
Listeria monocytogenesis an intracellular foodborne pathogen com-monly associated to ready-to-eat products, and has been implicated as the causative agent of numerous disease outbreaks worldwide. According toGreig and Ravel (2009), 4093 foodborne outbreaks be-tween 1988 and 2007, ∼337 were related to dairy products, 6.6% of which were associated toL. monocytogenes. The organism has a fairly low prevalence in cheese (1.2% in European cheeses according to Martinez-Rios and Dalgaard, 2018) but can still cause outbreaks. Soft cheese contaminated with L. monocytogenes was responsible for an outbreak in Germany in 2006–2007 with 189 reported cases and 26 deaths (Koch et al., 2010), and in Portugal during 2009–2012 with 30 cases and a fatality rate of 36.7% (Magalhães et al., 2015). Fresh raw milk cheese in the USA was responsible for a listeriosis outbreak
involving 6 people (2 deaths) in 2016–2017 (CDC, 2017), while in Chile, a 2008 outbreak associated with Brie and Camembert cheeses caused 165 cases and 14 deaths (Montero et al., 2015). Listeriosis re-porting is not currently compulsory in Brazil, and this lack of data may obscure the real magnitude of the problem (Barancelli et al., 2011). BrazilianL. monocytogenescheese and dairy plants isolates do include the most virulent serotypes including 1/2a, 1/2b and 4b (Abrahão et al., 2008;Barancelli et al., 2014;Brito et al., 2008), which are the same types frequently involved in outbreaks of human listeriosis.
Minas “frescal” cheese is a soft white fresh cheese obtained by en-zymatic coagulation of milk, which may be complemented by the ad-dition of specific lactic acid bacteria (LAB) (BRAZIL, 1997). This soft cheese is very popular in Brazil and is typically characterized by 55–58% moisture, 17–19% fat, 1.4–1.6% salt and a pH range of 5.0–5.3 (Silva, 2005).L. monocytogeneshave been shown to grow over a wide
https://doi.org/10.1016/j.fm.2018.11.004
Received 8 May 2018; Received in revised form 3 November 2018; Accepted 13 November 2018
∗
Corresponding author. Rua Monteiro Lobato, 80, Cidade Universitária, CEP 13083-862, Campinas, SP, Brazil.
E-mail address:[email protected](A.S. Sant’Ana).
1These authors contributed equally to this work.
Food Microbiology 79 (2019) 48–60
Available online 15 November 2018
0740-0020/ © 2018 Elsevier Ltd. All rights reserved.
range of temperatures (1–45 °C) and pH values (4.0–9.5), and down to water activities (aw) as low as 0.92 and salt concentration of up to 10% (Melo et al., 2015); which clearly include the attributes of Minas fresh cheese. The reported incidence of L. monocytogenes in this type of Brazilian cheese is quite variable (1.4–41.2%,Abrahão et al., 2008).L. monocytogenes can contaminate the product through the use of con-taminated raw milk or by cross or post-process contamination of pas-teurized products. While poor quality silage, inadequate animals housing, lack of hygiene during milking and the presence of mastitis in the herd are all associated with raw milk contamination byL. mono-cytogenes (Sanaa et al., 1993), the main sources at cheese processing plants are contaminated starter cultures, brines, floors, packaging ma-terials, cheese vats, cheese clothes, curd cutting knives, cold rooms, production rooms and storage coolers (Kousta et al., 2010).
Several studies have analyzedL. monocytogenesbehavior in Minas fresh cheese during processing and shelf-life (Malheiros et al., 2012; Naldini et al., 2009;Nascimento et al., 2008;Silva et al., 2014), but onlyCampagnollo et al. (2018)used primary predictive models to es-timate the growth parameters of this pathogen. No previous work ap-pears to have applied either competition models or dynamic tertiary models to describe the kinetics ofL. monocytogenesin Brazilian cheeses. The development of such models is made more complex by the presence of indigenous or intentionally-added LAB, since these organism produce antimicrobial compounds as lactic acid, hydrogen peroxide, diacetyl, reuterin and bacteriocins, which can inactivate or inhibit the growth of L. monocytogeneseven during refrigerated storage (Guillier et al., 2008) as has been confirmed by many studies (Campagnollo et al., 2018; Guedes Neto et al., 2005;Ortolani et al., 2010;Ribeiro et al., 2014;Sip et al., 2012). Determination of growth parameters ofL. monocytogenes and the development of models considering interactions with other microorganisms are important for assessment and management of the risk of listeriosis.
Only two studies have evaluated competition models to characterize the inhibitory effect of cheese natural microflora on the growth ofL. monocytogenesto date.Guillier et al. (2008)investigated the inhibition mechanism ofL. monocytogenesby the natural biofilm microflora on wooden shelves used in the ripening of a soft and smear cheese, while Østergaard et al. (2014)developed mathematical models for competi-tion of mesophilic LAB from added cultures andL. monocytogenesduring chilled storage of cottage cheese. Dynamic tertiary modeling (a com-bination of a primary model with a secondary model) is particularly suited to fermentation processes (Rosshaug et al., 2012;Schvartzman et al., 2011), but is as yet unexplored for use in L. monocytogenes modeling in fresh cheese. Such models have the capability to use dy-namic data (i.e., microbial population data as driven by food intrinsic properties over time) for prediction.
This study compares dynamic tertiary and competition models for characterizing the suppression ofL. monocytogenesgrowth, as affected either by the changing intrinsic properties of a traditional Minas soft cheese during refrigerated storage or by the inhibitory effect of LAB present. Brazilian Minas soft cheeses were prepared from raw or pas-teurized milk with autochthonous (naturally present) LAB or addition of selected LAB with known anti-listerial activity.
2. Material and methods
2.1. LAB and L. monocytogenes strains and preparation of cell suspensions
Six LAB strains, identified asLactobacillus brevis,Lactobacillus plan-tarumandEnterococcus faecalis(4 strains) previously isolated from ar-tisanal Minas cheeses and with known anti-listerial activity (Campagnollo et al., 2018) were used as a LAB pool to be added during cheese production. Preparation of LAB strains was carried out as de-scribed byCampagnollo et al. (2018)using MRS broth (de Man, Rogosa and Sharpe – Acumedia, Neogen Corporation, Lansing/MI).
Two L. monocytogenes strains (L. monocytogenes strain 3968
-serotype 1/2b andL. monocytogenesstrain 3973 - serotype 4b, isolated from cheese and raw milk, respectively), kindly donated by Oswaldo Cruz Foundation (Rio de Janeiro/RJ/Brazil), were used in this study. Each strain of L. monocytogenes was cultured separately in TSBYE (Tryptic soy broth – Merck, Darmstadt, Germany, added of 0.6% Yeast Extract – Acumedia, Neogen Corporation, Lansing/MI) and cell sus-pensions (108CFU/mL) were prepared according to Sant'Ana et al. (2012).
2.2. Minas fresh cheese production
Four different treatments were performed in duplicate, on different days, and consisted of production of soft fresh Minas cheese using raw or pasteurized milk, with or without the addition of selected LAB.L. monocytogenes was deliberately added in each treatment. Naturally occurring microbiota (e.g. autochthonous LAB) were assumed to be present in all treatments. Pooled selected LAB were added at 106–107CFU/mL of milk, while pool L. monocytogenes strains were added at 105–106CFU/mL of milk to simulate a high level of con-tamination. Production of soft Minas cheese was carried out as de-scribed byCampagnollo et al. (2018). Briefly, ten liters of milk were heated to 34 ± 1ᵒC and added with 5 mL of CaCl2(saturated solution), 9 mL of commercial rennet Estrella (85% bovine pepsin + 15% bovine chymosin, Chr. Hansen, Valinhos/SP/Brazil) and selected LAB and/or L. monocytogenesstrains, depending upon the treatment. After 40 min coagulation, curd cutting, slight agitation and resting for 30 min, so-dium chloride (2 g/L) was added and curd was allowed to rest for an-other 30 min. The whey was drained and the curd was placed into perforated sterile cylindrical shapes. Cheeses were kept at room tem-perature for 1 h for dripping, turned upside down, and left for an ad-ditional 1 h for final dripping. Unmolded cheeses were packed in plastic bags, following storage at 7 ± 1ᵒC for 15 days.
2.3. Microbiological and physicochemical analysis during refrigerated shelf-life
Microbiological and physicochemical analysis were performed throughout the refrigerated storage period of soft Minas cheeses, more precisely on day 0 (immediately after production), days 1, 2, 3 and 4 (twice a day, early morning and late afternoon) and days 5, 7, 9, 12 and 15 (once a day). Microbiological analysis included LAB counting in MRS agar (Acumedia, Neogen Corporation, Lansing/MI) andL. mono-cytogenes counting in Listeria Selective agar (Oxford Formulation – Oxoid, Basingstoke, UK), performed according to Njongmeta et al. (2015)andRyser and Donnelly (2015), respectively. Physicochemical analysis consisted of determination of temperature and pH, using a portable pH meter coupled with a knife electrode and a temperature sensor (AK103 pH meter, SC18 electrode, Akso Electronic Products Ltda., São Leopoldo/RS/Brazil), and water activity (aw) using an Aqualab water activity meter (model 4TE, Decagon Devices Inc., São José dos Campos/SP/Brazil).
2.4. Modeling the inhibition of L. monocytogenes in cheese during refrigerated shelf-life
None of the experimentalL. monocytogenesgrowth curves exhibited noticeable lag phase. Two types of models were contrasted: one that describes the retardation by considering the effect of acidification (changing pH) and awvariation in a dynamic kinetic analysis frame-work (i.e., indirect approach); and another that describes the simulta-neous growth of L. monocytogenes and autochthonous/selected LAB (i.e., direct approach).
2.4.1. Describing the growth of L. monocytogenes by dynamic tertiary models
cheese matrix becomes more acidic and drier. The kinetic parameters of L. monocytogenes in cheese were determined by dynamic kinetic ana-lysis by taking into consideration the drop in pH and awduring storage at constant temperature (7 °C). This was accomplished by simulta-neously fitting a primary growth model in differential form with an explicit secondary model of the specific growth rate as a function of the cheese intrinsic properties. The Huang model (Huang, 2008) was chosen as the primary model characterizing the growth of L. mono-cytogenesin cheese during storage, whilst the cardinal parameter model was chosen for secondary modeling. The effect of pH was considered in the cardinal parameter model (Rosso et al., 1995); and subsequently the term for awwas added (Østergaard et al., 2014). Thus, the following two dynamic tertiary models were fitted to the data,
= +
(
)
dY dt µ e e 1 1 max t Y Y( ) max
=
µ µ pH pH pH pH
pH pH pH pH pH pH
( )( )
( )( ) ( )
max opt
min max
min max opt2
= +
(
)
dY dt µ e e 1 1 max t Y Y( ) max
=
µ µ pH pH pH pH
pH pH pH pH pH pH
a a a ( )( ) ( )( ) ( ) 1 max opt min max
min max opt
w wmin
wmin
2
and will be henceforth referred to as the Huang-Cardinal [pH] (Equa-tion (1)) and Huang-Cardinal [pH, aw] model (Equation(2)). Their ability to closely describe the experimental growth curves was com-pared. In Equations(1) and (2), Y0, Ymaxand Y are the natural loga-rithms of bacterial counts at time 0, at maximum level and at the ‘real time’ t, respectively; μmaxis the specific growth rate (ln CFU/g h−1); λ is the lag time (h) of a growth curve; α is the lag phase transition coefficient (dimensionless); and t is the time (h) under a constant temperature (7 °C ± 1.0). While λ was set to zero, α was given a value of 4.0, as recommended inHuang (2013). The terms pHminand pHmax are the pH below or above which no growth occurs, while pHoptis the pH at which the specific growth μmaxis optimal. Likewise, aw minis the water activity below which no growth occurs. The estimated para-meters from Equations (1) and (2)were Y0, Ymaxand μopt. The para-meter μoptin Equation(1)can be interpreted as the optimum growth rate at 7ᵒC ofL. monocytogenesin Minas fresh cheese at the optimum pH (pHopt), assuming that the variation in awduring the short storage time of this cheese is negligible. The parameter μoptin Equation(2)is defined as the optimum growth rate at 7ᵒC ofL. monocytogenesin Minas fresh cheese at the optimum pH (pHopt) and at the optimum aw(aw opt, fixed at 1.0). Because the cardinal parameters ofL. monocytogenes(pHmin, pHopt, pHmaxand aw min) are not estimable from the data – as the monitored pH (6.9–4.7) and aw (0.999–0.993) of the Minas cheese correspond to narrow-ranged suboptimal values, they were set to the values estimated byAugustin et al. (2005) in liquid microbiological media: pHmin= 4.71 (condition where lactic acid is present); pHopt= 7.10; pHmax= 9.61; aw min= 0.913.
2.4.2. Describing the growth of L. monocytogenes by dynamic competition models
The simultaneous growth ofL. monocytogenesand autochthonous/ selected LAB in cheese during refrigerated storage was described by three variants of the Jameson-effect model based on a logistic decel-eration function. The logistic deceldecel-eration provides an empirical de-scription of a self-limiting growth process, which represents the ex-haustion of essential nutrients, the accumulation of waste products inhibiting growth and/or the lowering of pH due to acid production. In its simplest form, the Jameson-effect model assumes that LAB andL. monocytogenesinhibit each other to the same extent that they inhibit
their own growth, and that one microorganism stops growing when the other has reached its maximum density. Under these assumptions, the simple Jameson-effect model (Equation(3)) defined as,
= LM dLM dt µ LM LM LAB LAB 1 1 1 LM max max = LAB dLAB dt µ LAB LAB LM LM 1 1 1 LAB max max
was fitted to each of the four sets of experimental growth curves. LM and LAB are the counts ofL. monocytogenesand LAB bacteria in time while LMmaxand LABmaxare their maximum population densities (ln CFU/g). The parameters μLMand μLABare the maximum specific growth rates ofL. monocytogenesand LAB (ln CFU/g h−1), respectively.
A more flexible Jameson-effect model which includes an interaction parameter γ, allowing the inhibition effect of the natural microbiota on pathogens growth to differ among environmental conditions (Giménez and Dalgaard, 2004), was also fitted to the four sets of experimental curves. = × LM dLM dt µ LM LM LAB LAB 1 1 1 LM max max = LAB dLAB dt µ LAB LAB LM LM 1 1 1 LAB max max
Equation (4) is referred to as the Jameson-effect model with γ, where the parameter γ allows theL. monocytogenescounts to increase after LAB has reached its maximum density (γ < 1), or to decrease after LAB has reached its maximum density (γ > 1).
The third Jameson-effect variant fitted to the simultaneous growth data was that ofCornu (2001)who proposed a modification of the lo-gistic deceleration function by considering instead a total maximum cell density Nmax tot.
= + LM dLM dt µ LM LAB N 1 1 LM maxtot = + LAB dLAB dt µ LAB LM N 1 1 LAB maxtot
Equation(5)is referred to as the Jameson-effect model with Nmax tot. Although the Jameson-effect models were initially proposed to be used in prediction or forward analysis (i.e., to simulate the kinetics of both populations in co-culture) on the basis of their growth parameters estimated in mono-culture; in this study, the models of Equations (3)–(5)were used in inverse analysis, i.e. to estimate the kinetic para-meters of the two microbial populations from experimental growth curves obtained in co-culture.
The classical prey-predator Lotka-Volterra competition model, in-troduced byVereecken et al. (2000), was also evaluated. This model assumes that the competition for a common substrate is described by two inhibition coefficients that must be estimated from the microbial growth curves in co-culture. The Lotka-Volterra primary model (Equation(6)) is the system with two inhibition functions,
= + LM dLM dt µ LM LAB LM 1 1 LM LM LAB max = + LAB dLAB dt µ LAB LM LAB 1 1 LAB LAB LM max
was assumed thatL. monocytogenesdid not influence the growth of LAB apart from the carrying capacity of the medium (retarding the growth of both populations), and hence a value of one was set to αLAB-LM.
2.4.3. Estimation of parameters
Models 2 to 6 include ordinary differential equations (ODE) that do not have an analytical solution, but can be solved with numerical methods. Numerical optimization consists of searching for the most suitable parameters of the dynamic models such that the residual sum of squares (RSS) of the errors is minimized. The 4th order Runge-Kutta method was adopted to solve ODE (Huang, 2012) while the unknown kinetic parameters were estimated by least-square optimization, using the ‘deSolve’ and ‘FME’ libraries implemented in the R software. The kinetic parameters of Equation(1)were estimated using the ‘nlme’ li-brary. The mean absolute error (MAE) and root mean square error (RMSE), defined as,
=
MAE Y Y
n
obsi fiti
=
RMSE Y Y
df
( obsi fiti)2
were used to compare the dynamic models. The variance of the re-siduals was also calculated. Yfit i and Yobs i denote each of thei-th concentration of L. monocytogenesfitted by the dynamic/competition model and its corresponding observation, respectively. The degree of freedom (df) is calculated as ‘n-np’, where n is the number of ob-servations of an experimental growth curve and np is the number of parameters of the fitted model. Notice that for the Jameson-effect models (whereL. monocytogenesand LAB are modeled simultaneously), the residuals from the LAB counts were not taken into account for the calculation of these fitting measures in order to make them comparable with those of the Huang-Cardinal models, where the residuals are only based onL. monocytogenescounts.
3. Results
3.1. Describing the growth of L. monocytogenes by dynamic tertiary models
A comparison of ability of the dynamic tertiary models to describe the experimental growth curves is detailed inTable 1. Both the Huang-Cardinal [pH] and Huang-Huang-Cardinal [pH-aw] models showed that the addition of selected LAB with anti-listerial activity to raw or pasteur-ized milk reduced the μopt(0.0256–0.0336 ln CFU/g h−1) and Ymax (14.08–14.83 ln CFU/g) of L. monocytogenes in comparison to those cheeses without addition of selected LAB (μopt: 0.0368–0.0405 ln CFU/g h−1and Ymax: 17.76–14.91 ln CFU/g). These kinetic parameters were slightly lower in raw milk cheeses vs. in pasteurized milk. The cheese made of raw milk with selected LAB was the one among the four treatments that provided the most restrictive conditions for the growth ofL. monocytogenes, since these media presented the lowest μopt(0.0256 and 0.0281 ln CFU/g h−1) and Y
max(14.08 and 14.12 ln CFU/g), as modeled by both the Huang-Cardinal [pH] and Huang-Cardinal [pH-aw] model, respectively (Table 1).
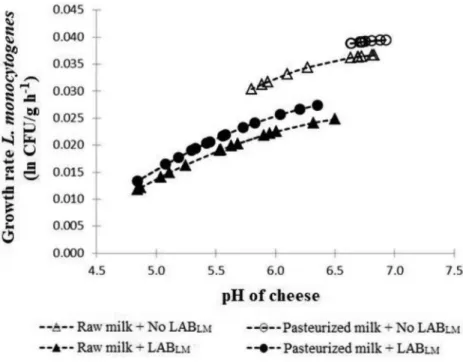
The treatment using pasteurized milk and no addition of LAB with anti-listerial activity favored the most the growth ofL. monocytogenes, because, as shown inFig. 1, the cheese pH remained high with little change throughout storage. A considerable pH drop in cheese without added LAB was obtained when milk was not pasteurized, because au-tochthonous LAB were able to acidify the cheese, resulting in a cheese pH of 5.75 after 360 h storage. A steeper pH drop was observed in cheeses formulated with selected LAB (as low as pH ∼4.80 after 360 h). L. monocytogenespresented slower growth in Minas cheese made with raw milk than in cheese made with pasteurized milk (Fig. 1).
Estimates of Y0 and Ymax by the Huang-Cardinal [pH] and the
Huang-Cardinal [pH-aw] model were essentially equivalent, while μopt estimates by the Huang-Cardinal [pH-aw] model were slightly higher than those of the Huang-Cardinal [pH] model. Optimum growth rates fitted by the Huang-Cardinal [pH-aw] were higher because they were extrapolated to the scale of optimum water activity of 1.0, whereas the optimum growth rates fitted by Huang-Cardinal [pH] model were lower for being based on the suboptimal water activity range of the cheese during storage. Both dynamic models presented a good visual fit quality (fit only shown for the Huang-Cardinal [pH] model inFig. 2), however treatments with addition of anti-listerial LAB had the lowest goodness-of-fit values; suggesting that the measurements taken from cheeses with autochthonous LAB were associated to greater variability (Table 1). Within each cheese type, values of residuals (σ2), root mean square
Table 1
Kinetic parameters (initial and maximum microbial concentration, Y0, Ymaxin
ln CFU/g, and optimum growth rate, μoptin ln CFU/g h−1) ofL. monocytogenes
in Minas soft cheese elaborated with raw or pasteurized milk and with addition or not of lactic acid bacteria with anti-listerial activity (LABLM), as estimated by
dynamic tertiary modeling, along with goodness-of-fit measures (residuals, σ2,
root mean square error, RMSE, and mean absolute error, MAE) for model comparison.
Treatment Parameters Huang-Cardinal [pH]
Huang-Cardinal [pH, aw]
Mean (SE)
p-value Mean (SE)
p-value
Pasteurized milk + No LABLM
Y0 14.71
(0.319)
< .0001 14.71 (0.385)
< .0001
μopt 0.0395
(0.0087)
0.001 0.0405 (0.0135)
0.0122
Ymax 17.76
(0.213)
< .0001 17.76 (0.272)
< .0001
Fit quality
σ2 0.1673 0.1668
RMSE 0.3942 0.3955 MAE 0.3297 0.3228
Pasteurized milk + LABLM
Y0 13.16
(0.134)
< .0001 13.15 (0.142)
< .0001
μopt 0.0289
(0.0054)
< .0001 0.0336 (0.0070)
0.0006
Ymax 14.77
(0.106)
< .0001 14.83 (0.143)
< .0001
Fit quality
σ2 0.0268 0.0285
RMSE 0.1578 0.1627 MAE 0.1182 0.1202
Raw milk + No LABLM
Y0 14.58
(0.242)
< .0001 14.58 (0.241)
< .0001
μopt 0.0368
(0.0066)
0.001 0.0389 (0.0068)
0.0010
Ymax 17.91
(0.194)
< .0001 17.91 (0.193)
< .0001
Fit quality
σ2 0.0872 0.0862
RMSE 0.2800 0.2786 MAE 0.2401 0.2389
Raw milk + LABLM Y0 13.11
(0.107)
< .0001 13.11 (0.115)
< .0001
μopt 0.0256
(0.0050)
0.001 0.0281 (0.0067)
0.0029
Ymax 14.08
(0.045)
< .0001 14.12 (0.072)
< .0001
Fit quality
σ2 0.0038 0.0039
error (RMSE) and mean absolute error (MAE) were comparable be-tween the dynamic models. This arises because the incorporation of aw evolution in the tertiary dynamic model is not very useful in a fresh cheese whose awspans only from 0.999 to 0.993, since the change in growth rate ofL. monocytogenesis primarily driven by the drop in pH.
Maximum population density ofL. monocytogenesin raw milk Minas cheese with selected LAB was estimated to be 14.12 ln CFU/g, with an optimum growth rate of 0.0281 ln CFU/h considering an optimum pH of 7.1 and awof 1.0 when a more comprehensive model (Huang-Car-dinal [pH-aw]) was used.
Fig. 1.Effect of pH on the specific growth rate ofL. mono-cytogenesin Minas soft cheese elaborated with raw or pas-teurized milk and with addition or not of lactic acid bacteria with anti-listerial activity (LABLM), as depicted by the
car-dinal parameter model [pH]. Markers indicate the time points at which cheese pH were measured from time 0 (rightmost marker) until 360 h (leftmost marker) of re-frigerated storage.
3.2. Describing the growth of L. monocytogenes by dynamic competition models
The Jameson-effect model parameters for simultaneous growth ofL. monocytogenesand LAB in soft cheese during refrigerated shelf-life are shown inTable 2(simple Jameson-effect and Jameson-effect with in-teraction γ) and Table 3(Jameson with Nmax tot). The three variants appeared statistically adequate to depict the simultaneous microbial growth ofL. monocytogenesand LAB in each of the cheese treatments, since all the parameters were significant. The maximum concentrations of LAB andL. monocytogenesestimated from the simple and the γ-Ja-meson effect were very close. The three Jaγ-Ja-meson-effect models all es-timated that treatments without addition of anti-listerial LAB presented higher values of growth rates for LAB andL. monocytogenes, resulting in
a shorter time to reach the maximum concentrations of these micro-organisms, which can also be observed inFigs. 2–5. The fact that, in cheeses with added LAB, the initial concentration of LAB is closer to the maximum carrying capacity slowed down their growth, regardless of the type of milk used. Moreover, theL. monocytogenesgrowth rate es-timates from cheeses with added anti-listerial LAB should be carefully interpreted, in particular for the experiment in raw milk; since they were associated with greater coefficients of variation (CV) (i.e., CV of μLMfor raw milk + No LABLM: 0.0043/0.0354 = 0.121 while for raw milk + LABLM: 0.0068/0.0184 = 0.369). The fact of having only marginal increases inL. monocytogenescounts when anti-listerial LAB was added to raw or pasteurized milk affected the optimization of the kinetic parameters in both cases. In addition to this, the correlations among the competition model's parameters made the optimization
Table 2
Kinetic parameters (initial and maximum microbial concentrations, LAB0, LM0, LABmaxand LMmax[ln CFU/g], and optimum growth rates, μLABand μLM[ln CFU/g
h−1]) of lactic acid bacteria (LAB) andL. monocytogenesin Minas soft cheese elaborated with raw or pasteurized milk and with addition or not of LAB with
anti-listerial activity (LABLM), as estimated by the simple Jameson-effect and the Jameson-effect with γ (interaction parameter), along with goodness-of-fit measures
(residuals, σ2, root mean square error, RMSE, and mean absolute error, MAE) computed forL. monocytogenescounts only to allow comparison.
Treatment Parameters Simple Jameson-effect Jameson-effect with γ
Mean (SE) p-value Mean (SE) p-value
Pasteurized milk + No LABLM LAB0 6.193 (0.373) < .0001 6.403 (0.396) < .0001
LM0 14.34 (0.254) < .0001 14.48 (0.381) < .0001
LABmax 17.56 (0.262) < .0001 17.11 (0.240) < .0001
LMmax 17.52 (0.140) < .0001 17.98 (0.957) < .0001
μLAB 0.2252 (0.0189) < .0001 0.2031 (0.0258) < .0001
μLM 0.0633 (0.0050) < .0001 0.0489 (0.0171) 0.0010
γ – – 0.9863 (0.0105) < .0001
Fit quality
σ2 0.1867 0.0975
RMSE 0.4187 0.3070
MAE 0.3064 0.2556
Pasteurized milk + LABLM LAB0 17.57 (0.362) < .0001 17.56 (0.583) < .0001
LM0 13.09 (0.291) < .0001 12.98 (0.174) < .0001
LABmax 25.60 (6.296) < .0001 25.06 (0.626) < .0001
LMmax 15.09 (0.286) < .0001 15.34 (0.678) < .0001
μLAB 0.0540 (0.0103) < .0001 0.0517 (0.0206) 0.0201
μLM 0.0151 (0.0034) 0.0002 0.0183 (0.0017) < .0001
γ – – 1.0388 (0.0096) < .0001
Fit quality
σ2 0.0784 0.1340
RMSE 0.3250 0.4645
MAE 0.2788 0.3347
Raw milk + No LABLM LAB0 10.58 (0.302) < .0001 10.73 (0.274) < .0001
LM0 14.92 (0.246) < .0001 14.61 (0.266) < .0001
LABmax 18.51 (0.454) < .0001 18.47 (0.612) < .0001
LMmax 17.84 (0.229) < .0001 17.93 (0.249) < .0001
μLAB 0.0957 (0.0109) < .0001 0.0888 (0.0085) < .0001
μLM 0.0354 (0.0043) < .0001 0.0367 (0.0071) 0.0001
γ – – 0.9865 (0.0531) < .0001
Fit quality
σ2 0.1358 0.0809
RMSE 0.3531 0.2739
MAE 0.2935 0.2214
Raw milk + LABLM LAB0 19.82 (0.335) < .0001 19.59 (0.525) < .0001
LM0 13.15 (0.238) < .0001 13.28 (0.515) < .0001
LABmax 22.89 (0.679) < .0001 22.89 (1.014) < .0001
LMmax 14.19 (0.197) < .0001 14.14 (0.280) < .0001
μLAB 0.0523 (0.0186) 0.0117 0.0540 (0.0207) 0.0200
μLM 0.0184 (0.0068) 0.0151 0.0176 (0.0046) 0.0018
γ – 1.0143 (0.0620) < .0001
Fit quality
σ2 0.0045 0.0058
RMSE 0.0792 0.0796
process slower and prone to instabilities, in particular for the γ-Jameson effect and the Lotka-Volterra competition models. Further research should look into the utilization of both lower concentrations of anti-listerial LAB and optimized sampling as a way to decrease the un-certainty about the μLMestimates.
The γ values for the treatments with anti-listerial LAB addition were slightly higher than 1, indicating thatL. monocytogenespopulation de-creases slightly after LAB reached its maximum density, and that LAB present an inhibitory effect on L. monocytogenes growth. In cheeses where there was no addition of selected LAB, γ values were less than 1,
suggesting that L. monocytogenes were not inhibited by LAB after reaching their maximum carrying capacity. Notice inFig. 3(top right) that the γ–Jameson-effect equation effectively modeled the slight in-crease ofL. monocytogenescounts after LAB had reached the stationary phase. In those treatments where γ < 1 (i.e., no addition of selected LAB), the γ-Jameson-effect model yielded a better fit (i.e., lower goodness-of-fit measures) of the L. monocytogenes growth than the simple Jameson-effect, the Jameson-effect with Nmax totor the tertiary dynamic models.
The Nmax tot-Jameson-effect model was the simplest Jameson-effect
Table 3
Kinetic parameters (initial and maximum microbial concentrations, LAB0, LM0, LABmaxand LMmax[ln CFU/g], and optimum growth rates, μLABand μLM[ln CFU/g
h−1]) of lactic acid bacteria (LAB) andL. monocytogenesin Minas soft cheese elaborated with raw or pasteurized milk and with addition or not of LAB with
anti-listerial activity (LABLM), as estimated by the Jameson-effect with Ntot maxand the simplified Lotka-Volterra, along with goodness-of-fit measures (residuals, σ2, root
mean square error, RMSE, and mean absolute error, MAE) computed forL. monocytogenescounts only to allow comparison.
Treatment Parameters Jameson-effect with Ntot max Simplified Lotka-Volterra
Mean (SE) p-value Mean (SE) p-value
Pasteurized milk + No LABLM LAB0 6.519 (0.442) < .0001 6.378 (0.462) < .0001
LM0 14.67 (0.366) < .0001 14.39 (0.436) < .0001
LABmax – – 17.97 (0.135) < .0001
LMmax – – 17.83 (0.451) < .0001
μLAB 0.2009 (0.0192) < .0001 0.2061 (0.0210) < .0001
μLM 0.0524 (0.0079) < .0001 0.0625 (0.0186) 0.0029
Ntot max 18.00 (0.133) < .0001 – –
ln(αLM-LAB) – – −0.3627 (1.1446) 0.7544
Fit quality
σ2 0.2408 0.2531
RMSE 0.4729 0.4863
MAE 0.3428 0.3634
Pasteurized milk + LABLM LAB0 18.02 (0.302) < .0001 18.31 (0.957) < .0001
LM0 13.54 (0.271) < .0001 13.35 (0.647) < .0001
LABmax – – 24.95 (1.859) < .0001
LMmax – – 18.45 (2.466) < .0001
μLAB 0.0339 (0.0042) < .0001 0.0211 (0.004) < .0001
μLM 0.0078 (0.0026) 0.0066 0.0102 (0.008) 0.2615
Ntot max 24.66 (0.416) < .0001 – –
ln(αLM-LAB) – – −5.515 (2.553) 0.0425
Fit quality
σ2 0.0689 0.1395
RMSE 0.2831 0.3740
MAE 0.2216 0.2806
Raw milk + No LABLM LAB0 10.85 (0.267) < .0001 10.83 (0.292) < .0001
LM0 14.58 (0.237) < .0001 14.60 (0.944) < .0001
LABmax – – 18.77 (0.178) < .0001
LMmax – – 18.45 (2.183) 0.0150
μLAB 0.0788 (0.0066) < .0001 0.0792 (0.0073) < .0001
μLM 0.0350 (0.0042) < .0001 0.0346 (0.0593) 0.5700
Ntot max 18.77 (0.160) < .0001 – –
ln(αLM-LAB) – – −0.6667 (27.63) 0.9810
Fit quality
σ2 0.1022 0.0901
RMSE 0.3157 0.2848
MAE 0.2628 0.2448
Raw milk + LABLM LAB0 19.87 (0.366) < .0001 19.74 (0.459) < .0001
LM0 13.29 (0.254) < .0001 13.23 (0.307) < .0001
LABmax – – 22.40 (0.200) < .0001
LMmax – – 17.05 (2.403) < .0001
μLAB 0.0265 (0.0079) 0.0039 0.0310 (0.0112) 0.0145
μLM 0.0079 (0.0041) 0.0680 0.0103 (0.0058) 0.0987
Ntot max 22.50 (0.186) < .0001 – –
ln(αLM-LAB) – – −5.359 (2.529) 0.0512
Fit quality
σ2 0.0081 0.0045
RMSE 0.1601 0.0643
model to fit with the fewest parameters to optimize (i.e., five as op-posed to the six parameters of the simple Jameson-effect or the seven parameters of the γ-Jameson effect model). Although the goodness-of-fit parameters of the L. monocytogenescounts were sometimes higher compared to the other models, the Nmax tot-Jameson-effect model pro-vided a good representation of the simultaneous growth of L. mono-cytogenesand LAB (Figs. 2–5). The Nmax tot-Jameson-effect model pro-vided the lowest estimates of growth rates forL. monocytogenes(0.0079 or 0.0078 ln CFU h−1, respectively) and LAB (0.0265 or 0.0339 ln CFU h−1, respectively), in the cheeses formulated with anti-listerial LAB, regardless of using raw or pasteurized milk, which were about half the estimates of μLM(0.0176–0.0184 or 0.0151–0.0183 ln CFU h−1, re-spectively) and μLAB(0.0523–0.0540 or 0.0517–0.0540 ln CFU h−1, respectively) obtained by the other two Jameson-effect variants (Tables 2 and 3).
The Lotka-Volterra model depicted the L. monocytogenes growth better in the treatments using raw milk cheese, as per analysis of the goodness-of-fit measures (Table 3). The Lotka-Volterra model also generally presented the poorest fit among the four competition models
in pasteurized cheeses. We suggest interesting findings from the Lotka-Volterra model fits. Firstly, in cheeses where no anti-listerial LAB were added, the inhibition coefficients ln(αLM-LAB) (viz. measuring effect of LAB onL. monocytogenes) were not significantly different from zero. Hence, if αLM-LABis equal to one, we deduce that there is no measurable inhibitory effect of autochthonous LAB onL. monocytogenes. If αLM-LAB and αLAB-LMin the Lotka-Volterra model (Equation(6)) are equal to one, the model becomes useless, and hence other competition models are more suitable for the Minas cheeses with indigenous LAB. The un-suitability of the Lotka-Volterra model can be also visually inferred from the fact that both LAB andL. monocytogenespopulation reach their maximum concentrations nearly at the same time in the raw milk cheese (Fig. 3, bottom left) and in the pasteurized milk cheese (Fig. 5, bottom left). Secondly, the parameter ln(αLM-LAB) was significant in raw milk cheese (−5.359; p = 0.05) and in pasteurized milk cheese (−5.515; p = 0.04) for treatments with anti-listerial LAB, resulting in αLM-LABvalues of 0.005 and 0.004, respectively. Since these are values lower than one, the effect of LAB onL. monocytogenesis less than the effect of LAB on itself, although it is sufficient to produce a
Fig. 3.Simultaneous growth of lactic acid bacteria (LAB, -○-) andL. monocytogenes(-Δ-) in Minas soft cheese elaborated from pasteurized milk without addition of
LAB with anti-listerial activity, as depicted by the simple Jameson-effect (top left), Jameson-effect with γ (top right), Jameson effect with Nmax tot(bottom left) and
bacteriostatic effect onL. monocytogenes(Figs. 4and6).
3.3. Comparison between dynamic tertiary and competition modeling
Based on (i) the goodness-of-fit quality measures (i.e., residuals, MAE and RMSE compiled in all Tables), and (ii) ease of parameter optimization; modeling the kinetics ofL. monocytogenesas a function of the evolving pH (or as a function of the evolving pH and water activity) was more accurate than as a function of the inhibitory effect of LAB; in particular, the tertiary Huang-Cardinal [pH] model outperformed the simple Jameson-effect, the Jameson effect with Nmax totand the Lotka-Volterra models. The γ-Jameson-effect model produced a slightly better representation of the experimental growth curves than the tertiary Huang-Cardinal [pH] model only in the treatments without added anti-listerial LAB. However, the decrease in the goodness-of-fit measures attained by the γ-Jameson-effect model was so marginal that it may not justify opting for such a more complex model when it comes to de-scribing the dynamic growth of a pathogen in afermenting food(i.e., with changes in pH). Contrasting the fit of the Huang-Cardinal model
(Fig. 2) to that of the competition models (Figs. 3–5), it became evident that the former depicted more accurately the transition from the ex-ponential to the stationary phase, due to the transition function ac-commodated in the Huang primary growth model. In most cases, the maximum population density values fitted by the Huang-Cardinal model were slightly higher than those fitted by the competition models, and overall described better the stationary phase data.
It is equally important to note that the growth rates extracted from the tertiary and the competition models have different meanings. The pathogen's growth rate is an optimum rate in the tertiary models as it is based upon an optimum pH and water activity, while the pathogen's growth rate estimated from a microbial competition model is a rate constant, and, at least in this study, not linked to environmental factors. Nonetheless, a microbial competition model, which is in essence a primary model, could still be coupled to secondary models depicting the influence of an environmental factor; for instance, to assess the effect of storage temperature on LAB andL. monocytogenesgrowth rates. To this respect, it is worth mentioning that, in this study, all the parameters extracted from both the dynamic tertiary and the
Fig. 4.Simultaneous growth of lactic acid bacteria (LAB, -○-) andL. monocytogenes(-Δ-) in Minas soft cheese elaborated from pasteurized milk with addition of LAB
with anti-listerial activity, as depicted by the simple Jameson-effect (top left), Jameson-effect with γ (top right), Jameson effect with Nmax tot(bottom left) and
competition models characterize growth kinetics of L. monocytogenes and LAB at a constant storage temperature of 7 °C. Since the growth models, as defined in Equations(1)–(6), do not cope with temperature effect, they cannot be used to estimate kinetic parameters at other temperatures. Competition models can be still appropriate when the aim is to characterize the kinetic parameters of LAB in co-culture ex-periments.
4. Discussion
The primary model developed byHuang (2008), a growth model based on the classical bacterial growth process including lag, ex-ponential and stationary phases, was associated to the cardinal para-meter model in order to describe theL. monocytogenesgrowth based on the variation of environmental parameters such as pH and aw. Since Minas soft cheese is a high moisture product and variation in awduring refrigerated shelf-life is quite low, there was little or almost no differ-ence between the models evaluated, the Huang-Cardinal [pH] and the Huang-Cardinal [pH-aw], showing that this intrinsic parameter is not necessary for dynamic modeling of this fresh cheese. TheHuang (2008)
model was originally developed from broth and beef frankfurters ex-periments, but by coupling a cardinal parameter model, we showed that it accurately describes the growth ofL. monocytogenesin fresh cheese (Table 1). Models predicting the development over time of the bacterial population in cheese must be able to deal with the dynamic environ-ment of this food matrix in order to obtain accurate estimates, parti-cularly the dynamics of the most important driving factors such as the variation of pH over time according toRosshaug et al. (2012).Rosso et al. (1995)have also emphasized that models should have biological meaning, a minimum number of parameters, easy applicability and good quality of fit. Based on these premises and on the fact that the addition of awparameter to the Huang-Cardinal model did not improve significantly the fit quality, the Huang-Cardinal [pH] model is good enough, and the best choice to describeL. monocytogenes growth in Minas fresh cheese.
The increased pH drop seen from the addition of LAB with anti-listerial activity is not unexpected since these bacteria were previously selected byCampagnollo et al. (2018)based on their acidifying and proteolytic capacity. The pH drop caused the reduction of specific growth rate ofL. monocytogenesfor all cheese treatments (Fig. 1), which
Fig. 5.Simultaneous growth of lactic acid bacteria (LAB, -○-) andL. monocytogenes(-Δ-) in Minas soft cheese elaborated from raw milk without addition of LAB with anti-listerial activity, as depicted by the simple Jameson-effect (top left), Jameson-effect with γ (top right), Jameson effect with Nmax tot(bottom left) and
is consistent with the observations ofWemmenhove et al. (2018), who noted that lower cheese pH values result in increased concentrations of undissociated acids which haveL. monocytogenesgrowth-inhibiting ef-fects. Ribeiro et al. (2006)investigated the growth responses of per-sistent strains of L. monocytogenes isolated from cheeses to NaCl (5–10%) and pH (4.0–8.5) and also observed that higher specific growth rates were predicted for more alkaline pH values at relatively low salt concentrations. The ability of L. monocytogenesto overcome stresses from pH and awis a critical characteristic enabling its pro-liferation in cheese (Melo et al., 2015).
Our dynamic tertiary model to estimate the growth of L. mono-cytogenes considering environmental parameters in this Brazilian tra-ditional soft cheese represents an important advance. Prior studies have evaluated only the presence or absence of the pathogen in Minas frescal cheese (Brito et al., 2008;Pinto et al., 2011;Silva et al., 1998) or the capacity of a compound or microorganism to inhibit its growth during processing or storage (Malheiros et al., 2012; Naldini et al., 2009; Nascimento et al., 2008;Silva et al., 2014).Campagnollo et al. (2018) have modeled the fate ofL. monocytogenesand LAB with anti-listerial
activity in Minas soft cheese using only primary models (Baranyi and Roberts, 1994). Few tertiary models have been used to predict L. monocytogenesgrowth in other cheeses.Rosshaug et al. (2012) devel-oped a predictive dynamic tertiary model ofL. monocytogenesgrowth in a soft blue-white cheese as a function of temperature, pH, NaCl and lactic acid, while Schvartzman et al. (2011)used a logistic primary model coupled with a secondary cardinal model taking into account environmental parameters such as temperature, pH, aw and lactate content to analyze theL. monocytogenesbehavior in smeared cheese made with raw or pasteurized milk. Both groups concluded that such models had important limitations as inactivation could not be pre-dicted, and that the quality of the predictions depended on the period of the ripening for which predictions were done.
Studies considering the growth or inactivation ofL. monocytogenes in cheese are quite common, but few have analyzed the influence of microbial interactions.Guillier et al. (2008)andAugustin et al. (2005) both noted thatL. monocytogenes growth was sometimes incorrectly predicted in cheese as microbial interactions were not taken into ac-count by the growth boundary models. Inhibition ofL. monocytogenes Fig. 6.Simultaneous growth of lactic acid bacteria (LAB, -○-) andL. monocytogenes(-Δ-) in Minas soft cheese elaborated from raw milk with addition of LAB with
anti-listerial activity, as depicted by the simple Jameson-effect (top left), Jameson-effect with γ (top right), Jameson effect with Nmax tot(bottom left) and
by LAB may occur by substrate competition or product inhibition in-cluding bacteriocins, peptides, organic acids, fatty acids, volatile com-pounds, H2O2and interaction between these factors (Østergaard et al., 2014).Irlinger and Mounier (2009)stated that prediction ofL. mono-cytogenesgrowth in cheese and other fermented dairy products can be a challenging task because it demands an understanding of the cheese microbial ecology to produce a product with a constant quality and safety.Guillier et al. (2008)modeled the competitive growth between L. monocytogenes and biofilm microflora of a soft and smear cheese wooden shelves using the Jameson-effect model and concluded that the inhibition ofL. monocytogenesby the natural biofilm microorganisms is a result of a non-specific competition for nutrients.Østergaard et al. (2014) developed four mathematical models for evaluation of si-multaneous growth of mesophilic LAB cultures andL. monocytogenes during chilled storage of cottage cheese, and the Jameson approach was also used. The simple Jameson-effect model or its variants have been used in the characterization of the simultaneous growth of LAB andL. monocytogenesor other microorganisms in distinct foods (Giménez and Dalgaard, 2004;Le Marc et al., 2009;Mejlholm and Dalgaard, 2007, 2015;Møller et al., 2013).
Although the Lotka-Volterra model has been commonly used to quantify the competitive growth between microorganisms in different foods, there is no previous work considering this model for measuring theL. monocytogenesand LAB interactions in cheese. Giuffrida et al. (2009) used a modified version of the Lotka-Volterra model to sto-chastically simulate the behavior ofL. monocytogenesand LAB during the fermentation period of a typical Sicilian salami and concluded that the choice of a suitable parameter accounting for the interaction of LAB on L. monocytogenesas well as the introduction of appropriate noise levels allows good fits for both for the mean growth curves and for probability distributions of L. monocytogenesconcentrations.Ye et al. (2014)studied the competitive growth ofL. monocytogenesand Lacto-bacilluson vacuum-packaged chilled pork using a modified version of Lotka-Volterra model and observed that the influence ofLactobacilluson L. monocytogenes was much higher than that ofL. monocytogenes on Lactobacillusthrough the interaction coefficients.Mounier et al. (2008) used the Lotka-Volterra model as a preliminary approach to represent inter- and intraspecies interactions between LAB and yeast in cheese. This model succeeded in representing the growth of the different mi-crobial populations, resulting in negative yeast-yeast interactions and positive yeast-bacterium interactions.
5. Conclusion
Both the dynamic tertiary models based on the Huang-Cardinal equation and the microbial competition models – including Jameson-effect variants and Lotka-Volterra – were capable of closely describing the growth of L. monocytogenes in Minas fresh cheese during re-frigerated storage. Incorporating awevolution in the tertiary Huang-Cardinal [pH] model was not necessary since the awof the Minas fresh cheese varied only slightly from 0.999 to 0.993 in 360 h; and any the change in growth rate ofL. monocytogeneswas primarily driven by the drop in pH. The tertiary Huang-Cardinal [pH] model outperformed the simple Jameson-effect, the Jameson effect with Nmax totand the Lotka-Volterra models. The γ-Jameson-effect model produced a slightly better representation of the experimental growth curves than the tertiary Huang-Cardinal [pH] model Only in treatments without added anti-listerial LAB; although the improvement in fit was only marginal con-sidering the additional parameters to optimize. Modeling the kinetics of L. monocytogenesas a function of the evolving pH was more accurate than considering the inhibitory effect of LAB. Competition models could still be used if the aim was to simultaneously characterize the kinetic parameters of LAB from a co-culture experiment.
The γ-Jameson-effect model describedL. monocytogenesgrowth in cheeses without anti-listerial LAB; while the Lotka-Volterra model es-timated an interaction parameter αLM-LABthat was significant only in
cheeses containing added anti-listerial LAB. The low values of such parameters (ln(αLM-LAB) = −5.359 to −5.515) imply that the effect of LAB onL. monocytogeneswas less than the effect of LAB on its own population. Likewise, the γ-Jameson-effect model, when fitted to the treatments with anti-listerial LAB, produced γ values slightly higher than one, suggesting thatL. monocytogenespopulation could decrease after LAB had reached their maximum density. Both the Lotka-Volterra and γ-Jameson-effect competition models showed the bacteriostatic/ inhibitory effect on the selected LAB onL. monocytogenesgrowth, and both models offered the possibility to quantitatively characterize the bacteriostatic/inhibitory effect of the selected LAB with anti-listerial activity in Minas fresh cheese. While the Jameson-effect with Nmax tot model was the simplest to fit (i.e. five parameters) among the microbial competition models, it produced the lowest estimates of growth rates for bothL. monocytogenes and LAB in cheeses formulated with anti-listerial LAB, which were about half the estimates of the other two Jameson-effect variants. The interspecific competition models based on multi-species experiments could demonstrate a more accurate re-presentation of microbial community dynamics in cheese and other food products. The developed interaction models for soft Minas cheese should prove valuable for future exposure and risk assessments to predict concentrations of L. monocytogenes and thereby assist in managing listeriosis risk.
Acknowledgements
Authors are grateful to Fundação de Amparo à Pesquisa do Estado de São Paulo for the financial support (Grants 2014/14891-7 and 2016/ 09346-5). Dr. Gonzales-Barron acknowledges the financial support provided by the Portuguese Foundation for Science and Technology through the award of an Investigator Fellowship (IF) in the mode of Development Grants (IF/00570). A. S. Sant’Ana acknowledges Conselho Nacional de Desenvolvimento Científico e Tecnológico (Grant # 302763/2014-7, 305804/2017-0), Coordenação de Aperfeiçoamento de Pessoal de Nível Superior - Finance Code 001”.
Appendix A. Supplementary data
Supplementary data to this article can be found online athttps:// doi.org/10.1016/j.fm.2018.11.004.
References
Abrahão, W.M., Abrahão, P.R.S., Monteiro, C.L.B., Pontarolo, R., 2008. Occurrence of
Listeria monocytogenesin cheese and ice cream produced in the State of Paraná, Brazil. Braz. J. Pharm. Sci. 44, 289–296.
Augustin, J.-C., Zuliani, V., Cornu, M., Guillier, L., 2005. Growth rate and growth prob-ability ofListeria monocytogenesin dairy, meat and seafood products in suboptimal conditions. J. Appl. Microbiol. 99, 1019–1042.
Barancelli, G.V., Silva-Cruz, J.V., Porto, E., Oliveira, C.A.F., 2011.Listeria monocytogenes: occurrence in dairy products and its implications in public health. Arq. Inst. Biol. Sao Paulo 78, 155–168.
Barancelli, G.V., Camargo, T.M., Gagliardi, N.G., Porto, E., Souza, R.A., Campioni, F., Falcão, J.P., Hofer, E., Cruz, A.G., Oliveira, C.A.F., 2014. Pulsed-Field Gel Electrophoresis characterization ofListeria monocytogenesisolates from cheese man-ufacturing plants in São Paulo, Brazil. Int. J. Food Microbiol. 173, 21–29. Baranyi, J., Roberts, T.A., 1994. A dynamic approach to predicting bacterial growth in
food. Int. J. Food Microbiol. 23, 277–294.
BRAZIL, 1997. Portaria MA 352 of September 4th1997 – Regulamento Técnico para
Fixação de Identidade e Qualidade de Queijo Minas Frescal. https://www.defesa. agricultura.sp.gov.br/legislacoes/portaria-ma-352-de-04-09-1997,644.html (ac-cessed 24.01.18).
Brito, J.R., Santos, E.M., Arcuri, E.F., Lange, S.S., Brito, M., Souza, G., Cerqueira, M.M.P.O., Soto-Beltran, J.M., Call, J.E., Liu, Y., Porto-Fett, A.C.S., Luchansky, J.B., 2008. Retail survey of Brazilian milk and Minas frescal cheese and a contaminated dairy plant to establish prevalence, relatedness, and sources ofListeria monocytogenes
isolates. Appl. Environ. Microbiol. 74, 4954–4961.
CDC - Center for Disease Control and Prevention, 2017. Multistate Outbreak of Listeriosis Linked to Soft Raw Milk Cheese Made by Vulto Creamery. https://www.cdc.gov/ listeria/outbreaks/soft-cheese-03-17/index.html(accessed 13.04.2017). Cornu, M., 2001. Modelling the competitive growth ofListeria monocytogenesand food
flora in situ. Acta Hortic 566, 151–157.
Giménez, B., Dalgaard, P., 2004. Modelling and predicting the simultaneous growth of
Listeria monocytogenesand spoilage micro-organisms in cold-smoked salmon. J. Appl. Microbiol. 96, 96–109.
Giuffrida, A., Valenti, D., Ziino, G., Spagnolo, B., Panebianco, A., 2009. A stochastic in-terspecific competition model to predict the behaviour ofListeria monocytogenesin the fermentation process of a traditional Sicilian salami. Eur. Food Res. Technol. 228, 767–775.
Greig, J.D., Ravel, A., 2009. Analysis of foodborne outbreak data reported internationally for source attribution. Int. J. Food Microbiol. 130, 77–87.
Guedes Neto, L.G., Souza, M.R., Nunes, A.C., Nicoli, J.R., Santos, W.L.M., 2005. Antimicrobial activity of lactic acid bacteria isolated from artisanal and industrial “coalho” cheese against indicator microorganisms. Braz. J. Vet. Anim. Sci. 57, 245–250.
Guillier, L., Stahl, V., Hezard, B., Notz, E., Briandet, R., 2008. Modelling the competitive growth betweenListeria monocytogenesand biofilm microflora of smear cheese wooden shelves. Int. J. Food Microbiol. 128, 51–57.
Huang, L., 2008. Growth kinetics ofListeria monocytogenesin broth and beef frankfurters – determination of lag phase duration and exponential growth rate under isothermal conditions. J. Food Sci. 73, E235–E242.
Huang, L., 2012. Mathematical modeling and numerical analysis of the growth of non-O157 Shiga toxin-producingEscherichia colispinach leaves. Int. J. Food Microbiol. 160, 32–41.
Huang, L., 2013. Optimization of a new mathematical model for bacterial growth. Food Contr. 32, 283–288.
Irlinger, F., Mounier, J., 2009. Microbial interactions in cheese: implications for cheese quality and safety. Curr. Opin. Biotechnol. 20, 142–148.
Koch, J., Dworak, R., Prager, R., Becker, B., Brockmann, S., Wicke, A., Wichmann-Schauer, H., Hof, H., Werber, D., Stark, K., 2010. Large listeriosis outbreak linked to cheese made from pasteurized milk, Germany, 2006-2007. Foodb. Pathog. Dis. 7, 1581–1584.
Kousta, M., Mataragas, M., Skandamis, P., Drosinos, E.H., 2010. Prevalence and sources of cheese contamination with pathogens at farm and processing plants. Food Contr. 21, 805–815.
Magalhães, R., Almeida, G., Ferreira, V., Santos, I., Silva, J., Mendes, M.M., Pita, J., Mariano, G., Mâncio, I., Sousa, M.M., Farber, J., Pagotto, F., Teixeira, P., 2015. Cheese-related listeriosis outbreak, Portugal, March 2009 to February 2012. Euro Surveill. 20, 1–6.
Malheiros, P.S., Sant'Anna, V., Barbosa, M.S., Brandelli, A., Franco, B.D.G.M., 2012. Effect of liposome-encapsulated nisin and bacteriocin-like substance P34 onListeria mono-cytogenesgrowth in Minas frescal cheese. Int. J. Food Microbiol. 156, 272–277. Le Marc, Y., Valík, L., Medved’ová, A., 2009. Modelling the effect of the starter culture on
the growth ofStaphylococcus aureusin milk. Int. J. Food Microbiol. 129, 306–311. Martinez-Rios, V., Dalgaard, P., 2018. Prevalence ofListeria monocytogenesin European
cheeses: a systematic review and meta-analysis. Food Contr. 84, 205–214. Mejlholm, O., Dalgaard, P., 2007. Modeling and predicting the growth of lactic acid
bacteria in lightly preserved seafood and their inhibiting effect onListeria mono-cytogenes. J. Food Protect. 70, 2485–2497.
Mejlholm, O., Dalgaard, P., 2015. Modeling and predicting the simultaneous growth of
Listeria monocytogenesand psychrotolerant lactic acid bacteria in processed seafood and mayonnaise-based seafood salads. Food Microbiol. 46, 1–14.
Melo, J., Andrew, P.W., Faleiro, M.L., 2015.Listeria monocytogenesin cheese and the dairy environment remains a food safety challenge: the role of stress responses. Food Res. Int. 67, 75–90.
Møller, C.O.A., Ilg, Y., Aabo, S., Christensen, B.B., Dalgaard, P., Hansen, T.B., 2013. Effect of natural microbiota on growth ofSalmonellaspp. in fresh pork – a predictive mi-crobiology approach. Food Microbiol. 34, 284–295.
Montero, D., Bodero, M., Riveros, G., Lapierre, L., Gaggero, A., Vidal, R.M., Vidal, M., 2015. Molecular epidemiology and genetic diversity ofListeria monocytogenesisolates from a wide variety of ready-to-eat foods and their relationship to clinical strains from listeriosis outbreaks in Chile. Front. Microbiol. 6, 1–8.
Mounier, J., Monnet, C., Vallaeys, T., Arditi, R., Sarthou, A.S., Hélias, A., Irlinger, F., 2008. Microbial interactions within a cheese microbial community. Appl. Environ. Microbiol. 74, 172–181.
Naldini, M.C.M., Viotto, W.H., Kuaye, A.Y., 2009. Behaviour ofListeria monocytogenes
inoculated into Minas frescal cheese made by direct acidification or lactic culture during refrigerated storage. Int. J. Dairy Technol. 62, 361–365.
Nascimento, M.S., Moreno, I., Kuaye, A.Y., 2008. Applicability of bacteriocin-producing
Lactobacillus plantarum, Enterococcus faeciumandLactococcus lactisssp.lactisas ad-junct starter in Minas frescal cheesemaking. Int. J. Dairy Technol. 61, 352–357. Njongmeta, N.A., Hall, P.A., Ledenbach, L., Flowers, R.S., 2015. Acid-Producing
micro-organisms. In: Salfinger, Y., Tortorello, M.L. (Eds.), Compendium of Methods for the Microbiological Examination of Foods. American Public Health Association, Washington/DC cap. 19.
Ortolani, M.B.T., Moraes, P.M., Perin, L.M., Viçosa, G.N., Carvalho, K.G., Silva Júnior, A., Nero, L.A., 2010. Molecular identification of naturally occurring bacteriocinogenic and bacteriocinogenic-like lactic acid bacteria in raw milk and soft cheese. J. Dairy Sci. 93, 2880–2886.
Østergaard, N.B., Eklöw, A., Dalgaard, P., 2014. Modelling the effect of lactic acid bac-teria from starter- and aroma culture on growth ofListeria monocytogenesin cottage cheese. Int. J. Food Microbiol. 188, 15–25.
Pinto, F.G.S., Souza, M., Saling, S., Moura, A.C., 2011. Microbiological quality of “Minas frescal” cheese marketed in Santa Helena, PR, Brazil. Arq. Inst. Biol. Sao Paulo 78, 191–198.
Ribeiro, M.H., Manha, S., Brito, L., 2006. The effects of salt and pH stress on the growth rates of persistent strains ofListeria monocytogenescollected from specific ecological niches. Food Res. Int. 39, 816–822.
Ribeiro, S.C., Coelho, M.C., Todorov, S.D., Franco, B.D.G.M., Dapkevicius, M.L.E., Silva, C.C.G., 2014. Technological properties of bacteriocin-producing lactic acid bacteria isolated from Pico cheese an artisanal cow's milk cheese. J. Appl. Microbiol. 116, 573–585.
Rosshaug, P.S., Detmer, A., Ingmer, H., Larsen, M.H., 2012. Modeling the growth of
Listeria monocytogenesin soft blue-white cheese. Appl. Environ. Microbiol. 78, 8508–8514.
Rosso, L., Lobry, J.R., Bajard, S., Flandrois, J.P., 1995. Convenient model to describe the combined effects of temperature and pH on microbial growth. Appl. Environ. Microbiol. 61, 610–616.
Ryser, E.T., Donnelly, C.W., 2015. Listeria. In: Salfinger, Y., Tortorello, M.L. (Eds.), Compendium of Methods for the Microbiological Examination of Foods. American Public Health Association, Washington/DC cap. 35.
Sanaa, M., Poutrel, B., Menard, J.L., Serieys, F., 1993. Risk factors associated with con-tamination of raw milk byListeria monocytogenesin dairy farms. J. Dairy Sci. 76, 2891–2898.
Sant'Ana, A.S., Franco, B.D.G.M., Schaffner, D.W., 2012. Modeling the growth rate and lag time of different strains ofSalmonella entericaandListeria monocytogenesin ready-to-eat lettuce. Food Microbiol. 30, 267–273.
Schvartzman, M.S., Maffre, A., Tenenhaus-Aziza, F., Sanaa, M., Butler, F., Jordan, K., 2011. Modelling the fate ofListeria monocytogenesduring manufacture and ripening of smeared cheese made with pasteurized or raw milk. Int. J. Food Microbiol. 145, S31–S38.
Silva, F.T., 2005. Queijo Minas frescal. EMBRAPA – Empresa Brasileira de Pesquisa Agropecuária. https://ainfo.cnptia.embrapa.br/digital/bitstream/item/11884/2/ 00076200.pdf(accessed 24.01.18).
Silva, M.C., Hofer, E., Tibana, A., 1998. Incidence ofListeria monocytogenesin cheese produced in Rio de Janeiro, Brazil. J. Food Protect. 61, 354–356.
Silva, E.N.G., Figueiredo, A.C.L., Miranda, F.A., Almeida, R.C.C., 2014. Control ofListeria monocytogenesgrowth in soft cheeses by bacteriophage P100. Braz. J. Microbiol. 45, 11–16.
Sip, A., Wieckowicz, M., Olejnik-Schmidt, A., Wlodzimierz, G., 2012. Anti-Listeria activity of lactic acid bacteria isolated from golka, a regional cheese produced in Poland. Food Contr. 26, 117–124.
Vereecken, K.M., Dens, E.J., Van Impe, J.F., 2000. Predictive modeling of mixed micro-bial populations in food products: evaluation of two-species models. J. Theor. Biol. 205, 53–72.
Wemmenhove, E., van Valenberg, H.J.F., van Hooijdonk, A.C.M., Wells-Bennik, M.H.J., Zwietering, M.H., 2018. Factors that inhibit growth ofListeria monocytogenesin nature-ripened Gouda cheese: a major role for undissociated lactic acid. Food Contr. 84, 413–418.