Plasma membrane proteomes of differentially matured
dendritic cells identified by LC
–
MS/MS combined
with iTRAQ labelling
Stéphanie Ferret-Bernard
a,1, William Castro-Borges
a,2, Adam A. Dowle
a,b, David E. Sanin
a,
Peter C. Cook
a, Joseph D. Turner
a, Andrew S. MacDonald
c,
Jerry R. Thomas
a,b, Adrian P. Mountford
a,⁎
aDepartment of Biology, University of York, York, YO10 5DD, UK
bCentre of Excellence in Mass Spectrometry, University of York, York, YO10 5DD, UK
cInstitute of Immunology and Infection Research, School of Biological Sciences, University of Edinburgh, UK
A R T I C L E I N F O
A B S T R A C T
Article history:
Received 8 August 2011 Accepted 17 October 2011 Available online 25 October 2011
Dendritic cells (DCs) play a pivotal role in polarising Th lymphocyte subsets but it is unclear what molecular events occur when DCs generate Th2-type responses. Here, we analysed plas-ma membrane-enriched fractions from implas-mature, pro-Th1 and pro-Th2 DCs and used a com-bination of iTRAQ labelling and LC–MS/MS to quantify changes in the proteomes. Analysis was performed on triplicate biological samples and changes verified by flow cytometry. MHC class II molecules and CD29 were regulated in pro-Th1 DCs whilst CD18 and CD44 were up-regulated in pro-Th2 DCs. One of the most down-up-regulated molecules in pro-Th1 DCs was YM-1 whilst the greatest decrease in pro-Th2 DCs was NAP-22. Other molecules up-regulated in pro-Th2 DC compared to pro-Th1 DCs included some potentially involved in protein folding during antigen processing (clathrin and Rab-7), whilst other non-membrane proteins such as enzymes/transporters related to cell metabolism (malate dehydrogenase, py-ruvate kinase, and ATPase Na+/K+) were also recorded. This suggests that pro-Th2 DCs are
more metabolically active while pro-Th1 DCs have a mature‘end state’. Overall, although sev-eral molecules were preferentially expressed on pro-Th2 DCs, our proteomics data support the view of a‘limited maturation’of pro-Th2 DCs compared to pro-Th1 DCs.
Crown Copyright © 2011 Published by Elsevier B.V. Keywords:
Dendritic cell iTRAQ
Parasitic helminth
Plasma membrane proteomics
1.
Introduction
Dendritic cells (DCs) are critical in development of immunity against pathogens [1] and are able to interpret different
pathogen-inherent signals to play a pivotal role in polarising Th lymphocyte subsets[2]. In general, pathogen-associated mo-lecular patterns (PAMPs) that drive DCs to promote Th1-type re-sponses, such as bacterial lipopolysaccharide (LPS), bind to
Abbreviations:0–3hRP, zero-to-three hours released proteins; Arp2/3, actin-related protein 2/3 complex; BM, bone marrow; CD, cluster of differentiation; DC, dendritic cell; E/S, excretory/secretory; GAPDH, glyceraldehyde 3-phosphate dehydrogenase; GM-CSF, granulocyte–
macrophage colony-stimulating factor; GNBP, guanine nucleotide-binding protein; LPS, lipopolysaccharide; MFI, median fluorescence in-tensity; NAP-22, 22 kDa neuronal tissue-enriched acidic protein; PAMP, pathogen-associated molecular pattern; PRR, pattern recognition receptor; SEA, schistosome egg antigen; Th, T helper.
⁎Corresponding author at:Department of Biology (Area 5), University of York, York, YO10 5DD, UK. Tel.: +44 1904 328595; fax: +44 1904 328505. E-mail address:adrian.mountford@york.ac.uk(A.P. Mountford).
1
Current address: INRA, UMR 1079, SENAH, F-35590 Saint-Gilles, France.
2Current address: Departamento de Ciências Biológicas, Universidade Federal de Ouro Preto, Ouro Preto, Brasil.
1874-3919 Crown Copyright © 2011 Published by Elsevier B.V. doi:10.1016/j.jprot.2011.10.010
A v a i l a b l e o n l i n e a t w w w . s c i e n c e d i r e c t . c o m
w w w . e l s e v i e r . c o m / l o c a t e / j p r o t
Open access under CC BY license.
pattern recognition receptors (PRRs) on the DC plasma mem-brane leading to subsequent activation and maturation of the DCs. Conversely, molecules from helminths, which are potent inducers of Th2-type responses, stimulate DCs with a‘modified’
phenotype[3–7]but it is unclear how/why these DCs promote Th2-type immunity. Pro-Th2 DCs may have a distinct pheno-type, defined by a unique profile of signature molecules[4,5], or may resemble immature DCs, stimulating Th2 polarisation viaa‘default’pathway in the absence of Th1-inducing stimuli [8]. An ‘inhibition model’ in which Th2-stimuli inhibit Th1 polarisation by DCs through competitive signalling pathways has also been proposed[9].
Changes in DC gene expression correlate poorly with changes in the level of protein expression[10,11]. Therefore, as protein expression is a better indicator of cell phenotype and function, a number of studies have examined the proteomes of differentially matured DCs[12–15]. For example, 2-DE and MS/MS have revealed changes in the proteome of pro-Th1 DCs matured with LPSversuspro-Th2 DCs stimulated with excreto-ry/secretory (E/S) material from a parasitic helminthSchistosoma mansoni[14]. This E/S material, released by the parasite during infection and known as‘0–3hRP’, is an important stimulant of innate immune cells in the skin[16,17]enabling DCs to promote Th2 responsesin vitroandin vivo[7]. Proteomic analysis of Th1 DCs revealed up-regulated expression of cytoskeletal pro-teins and chaperone molecules whereas pro-Th2 DCs, stimulat-ed with 0–3hRP, exhibited a proteome intermediate between that of immature DCs and pro-Th1 DCs; thus termed a‘limited maturation’ phenotype [14]. As soluble cytosolic molecules dominated the cell extracts used in the study, immune-associated proteins from the plasma membrane (e.g.PRRs, ad-hesion molecules, MHC complexes and costimulatory mole-cules) were not readily detected. Although such molecules are likely to be highly relevant with respect to differential matura-tion of DCs, their low abundance and hydrophobic nature makes them difficult to isolate for proteomic characterisation.
In order to‘home in’ on the detection of specific plasma membrane proteins which are likely to be important in differen-tial DC maturation, we compared proteins enriched from plas-ma membranes of implas-mature DCs, pro-Th1 DCs stimulated with LPS and pro-Th2 DCs stimulated with schistosome egg an-tigen (SEA) which is a well characterised pro-Th2 helminth product [3]. First, DC plasma membrane-enriched fractions were analysed by shotgun LC–MS/MS to establish a list of pro-teins associated with DCs. Second, a gel-free technique using iTRAQ[18,19]was used to quantify changes in protein expres-sion following differential DC maturation. By performing three biological replicates of each type of DCs and confirming proteo-mic data by flow cytometry, we identified a number of proteins that were differentially expressed by pro-Th1versuspro-Th2 DCs.
2.
Materials and methods
2.1. Generation and maturation of DCs from bone marrow
Bone marrow-derived dendritic cells (BM-DCs) from female C57BL/6 strain mice were cultured in RPMI medium containing 10% low endotoxin FCS plus 20 ng/mL GM-CSF (Peprotech,
London, UK) as previously described [7,14]. All experimental procedures were undertaken with the guidelines of the United Kingdom Animal's Scientific Procedures Act 1986 and approved by the University of York Ethics committee. On day 6, immature BM-DCs were seeded at 1×10⁶/mL and cultured for 18 h
alone (MED-DCs), or in the presence of 40μg/mL SEA [3] (SEA-DCs), or 10 ng/mL LPS (fromEscherichia colistrain 0111:B4, Sigma-Aldrich, Poole, UK; LPS-DCs)[14]. After overnight culture, cells were harvested and prepared for proteomic analysis.
2.2. Preparation of DC plasma membrane-enriched
fractions
Plasma membrane proteins from MED-DCs, SEA-DCs and LPS-DCs were extracted and purified using a plasma membrane protein extraction kit (BioVision, Mountain View, USA). All steps were performed at 4 °C. Briefly, BM-DCs were mechanically homogenised in an ice-cold glass cell grinder and then spun at 700g. The resulting supernatants were spun at 10,000g for 30 min to yield total membrane protein (i.e.plasma and cellular organelle membranes) enriched pellets which were re-suspended in‘Upper Phase solution’and mixed with an equal volume of ‘Lower Phase solution’ before centrifugation at 1000 ×gfor 5 min. The upper phase was spun at 25,000g for 10 min, and the resulting plasma membrane-enriched pellet solubilised in 0.5% Triton X-100. Total protein content was assessed by densitometry of SYPRO Ruby stained 1-D electro-phoresis gels (NuPAGE 4–12%) against known quantities of cyto-solic fractions as standards separated on the same gel.
2.3. Digestion and iTRAQ labelling
Plasma membrane-enriched fractions (35–50μg) were reduced with 2 mM tris-(2-carboxyethyl)phosphine in 0.5 M triethylam-monium bicarbonate (Sigma-Aldrich) pH8.5, at 60 °C for 1 h, alkylated with 10 mM methyl methanethiosulfonate (Sigma-Al-drich) at room temperature for 10 min and digested overnight with sequencing-grade porcine trypsin (Promega, Madison, USA) at 37 °C. The iTRAQ labelling reagents (114, 115, and 116; Applied Biosystems, Framingham, USA) were reconstituted in isopropanol and added to the digests. After 2 h, labelled pep-tides were combined and purified using cation-exchange and C18 cartridges. Although iTRAQ allows for the multiplexing of several samples in a single run, comparison is performed in a pair-wise manner. In this respect, a common reference sample between iTRAQ analyses is essential. However, a pooled stan-dard is not universally required if the samples are suitably sim-ilar, as in our study, where MED-DC is taken as a common standard across all runs[20].
2.4. LC–MS/MS
using collision energy of 1 keV, air as collision gas, precursor mass window set to a relative resolution of 50 and metastable suppressor enabled. MS/MS spectra were baseline-subtracted (peak width 50) and smoothed (Savitsky–Golay; three points; polynomial order 4); peak detection used S/N≥5, local noise window 50m/z and minimum peak width 2.9 bins. Mascot peak list files were generated using the TS2Mascot utility (Matrix Science, version 1.0.0) with S/N≥10.
2.5. Protein identification and quantification
Peak lists were searched against the CDS (Celera Discovery Sys-tem™, KBMS3.0.20040121) mouse database (65,307 sequences; 23,201,165 residues) using Mascot (Matrix Science Ltd., version 2.1). Search criteria specified: Enzyme, Trypsin; Maximum missed cleavages, 1; Fixed modifications, Methylthio (C); Vari-able modifications, Oxidation (M); Peptide tolerance, 0.3 Da; MS/MS tolerance, 0.3 Da; Instrument, MALDI-TOF-TOF. When searching iTRAQ peak lists the fixed modifications, iTRAQ4plex (N-term) and iTRAQ4plex (K), and the variable modification iTRAQ4plex (Y), were also specified. The Mascot significance threshold for protein identification was adjusted in each search to give a false discovery rate of approximately 1%. Only peptides that met or exceeded their identity score at this significance threshold and had an expect score less than 0.05 were accepted, including single-peptide protein matches. Where peptides match to multiple members of a protein family, the protein that tops the Mascot protein group and hence has the highest number of unique peptides, is reported. Mascot was used for iTRAQ quantification with these options: normalisation by me-dian ratio; automatic outlier removal; meme-dian ratios for protein ratios. Fold changes were accepted only with three peptides. Each iTRAQ experiment included three biological replicates.
2.6. Sub-cellular and Gene Ontology classification of proteins
Sub-cellular classifications were performed with Gene Ontology classification (http://www.ebi.ac.uk/GOA/) according to the ac-cession number of protein identities in Uniprot. If no classifica-tion was found, Mouse Genome Informatics website (http://
www.informatics.jax.org/) and the Proteome Analyst v3.0
(http://pa.cs.ualberta.ca:8080/pa/) were used. Finally, if no pre-diction was available, we referred to published literature. Pro-teins identified as ‘plasma membrane’ included formations such as lipid rafts, endosomes, phagocytic cups and phago-somes. ‘Cytosol’ comprised cytosolic, cytoplasmic proteins and vesicles. Cytoskeletal proteins were given a particular col-umn although most are also cytosolic. Ribosome proteins were classified as belonging to the‘ER’, whilst proteins associated with the Golgi apparatus, late endosomes and lysosomes, were defined as‘Golgi’. However, classification of proteins into discrete compartments is arbitrary depending upon original allocation by bio-informatic interrogation and may be best allo-cated to more than one classification. Protein hits that were ob-served to be differentially regulated (i.e.SEA-DCsvsMED-DCs, and LPS-DCsvs MED-DCs) were analysed according to Gene Ontology (GO) classification using Visual Annotation Display (VLAD; proto.informatics.jax.org/prototypes/vlad-1.0.3/). Signif-icant hits were selected on the basis of their p-value and the number of proteins(k) found within each category.
2.7. Validation of protein expression by flow cytometry
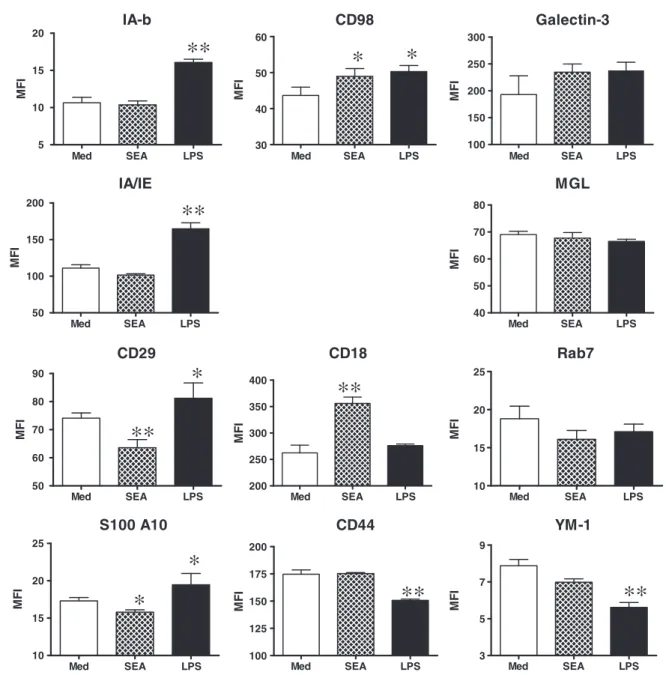
Differentially matured DCs were blocked with anti-CD16/32 mAb (BD Pharmingen, Oxford, UK) in PBS (supplemented with 1% FCS and 5 mM EDTA) and subsequently labelled with the fol-lowing conjugated mAbs against: CD18-biotin (M18/2), CD29-PE (HMb1-1), CD44-FITC (1C10), CD98-FITC (RL388), IA/IE-FITC (M5/ 114.15.2), Galectin-3-biotin (M3/38; all from eBioscience, Hatfield, UK), I-Ab biotin (28-16-8S; Caltag Medsystems,
Buckingham, UK) and CD301b-AF647 (ER-MP23; AbD Serotec, Kidlington, UK). Biotin conjugated antibodies were probed with streptavidin-APC (Caltag Medsystems). Unlabelled rabbit polyclonal antibodies were used to probe for S100A10 (Abcam, Cambridge, UK), YM-1 (STEMCELL Technologies, Grenoble, France) and Rab-7 (Sigma-Aldrich), and were subsequently detected with rabbit AF488 antibody (eBioscience). All anti-body concentrations were optimised and labelling was per-formed alongside relevant isotype controls. Flow cytometric acquisition and analysis was performed using a Cyan ADP ana-lyser with Summit v4.3 (DakoCytomation, UK). Data were plot-ted as means of the median fluorescence intensity (MFI) of three separate DC cultures for each maturation stimulus.
3.
Results
3.1. Sub-cellular classification of proteins identified by
shotgun LC–MS/MS
Initial shotgun LC–MS/MS proteomic analyses of DC frac-tions were performed to validate the isolation technique. In MED-DCs, 119 significant hits were identified (Supp. Table 1) of which 37% were classified by Gene Ontology as plasma membrane (Fig. 1A). In SEA-DCs and LPS-DCs, 149 and 61 pro-teins respectively were identified (Supp. Tables 2 and 3) with 32% and 52% from the plasma membrane (Fig. 1A). The frac-tions also contained cytosolic (19%), cytoskeletal (15%) and nuclear proteins whilst extracellular, ER and Golgi proteins were only minor components. In six different purification ex-periments, the enrichment for plasma membrane proteins in the fractions, compared to the total cell, was 23.4 ± 3.1. Conse-quently, we concluded that the isolation technique yielded fractions greatly enriched in plasma membrane molecules.
Plasma membrane molecules (shaded rows in bold text of Supp. Tables 1, 2, and 3) comprised those with a CD prefix (18%) and ras-related proteins (rho, rac, rab and rap; 17%) which were highly represented from all three types of DC. Other abundant molecules were MHC class I and II molecules for LPS-DCs (13%) and guanine nucleotide-binding proteins (GNBPs) in MED-DCs (11%). Annexins (1, 2, 4 and 5) and S100 proteins represented 10% and 5% respectively, of plasma membrane proteomes of all DC types.
3.2. Plasma membrane proteomes of differentially matured
DCs after iTRAQ labelling
Tables 4, 5versus1, 2, 3). This resulted in expanded DC prote-ome coverage and database searching of multiple peptides per protein improved the confidence of the identifications. Nevertheless, the proportion of hits identified after iTRAQ la-belling and classed as plasma membrane were similar to that revealed by shotgun LC–MS/MS.
Compilation of hits identified in the three separate iTRAQ experiments of SEA-DCs versus MED-DCs showed that 222 proteins were significantly identified with 45% being classed as plasma membrane components (Fig. 1B, Supp. Table 4) while a similar proportion (44%) was identified in LPS-DCs ver-susMED-DCs (Fig. 1B, Supp. Table 5). Overall, a greater propor-tion of hits were identified as nuclear proteins in SEA-DCs versusMED-DCs (18%) compared to LPS-DCsversusMED-DCs (8%) whereas a greater proportion of proteins in LPS-DCs ver-susMED-DCs were mitochondrial, extracellular and associat-ed with the Golgi apparatus.
3.3. Up- or down-regulated proteins from differentially
matured DC membrane-enriched proteomes
In order to assess variance in iTRAQ quantification experi-ments, Spooncer et al.[21]devised a form of analysis to com-pare separate preparations of the same biological material [22]. Ratiosobtained by comparing separate preparations of the same material plotted against the number of peptides identified (Fig. 2) should cluster around unity (i.e. protein levels should be the same between replicates). The extent to which values deviate from unity is an indication of the biolog-ical and technbiolog-ical variance. This approach provided a power-ful visual indication of where to set the significance threshold. Our iTRAQ experimental design consisted of six label-ling experiments (Table 1), in which three preparations of SEA-DCs and three preparations of LPS-DCs were analysed. MED-DC fractions were labelled with 114 and 116 iTRAQ 7%
23%
16%
10% 5% 3% 19% 32%
8%
18%
15%
19% 6% 2% 10% 37%
extracellular
cytosol
cytoskeleton
mitochondrion
ER
Golgi
nucleus
plasma membrane
A
LPS-DCs
versus
MED-DCs
SEA-DCs
versus
MED-DCs
10%
12%
17%
17% 2% 8% 8% 44% 4%
15%
20%
6%
1%
2% 18% 45%
B
MED-DCs
SEA-DCs
LPS-DCs
7%
15%
15%
11% 3% 2% 8% 52%
reagents to provide technical replicates whilst SEA-DC or LPS-DC preparations were labelled with 115. All the protein ratios from the six control–control (114:116) comparisons (355 in total) are shown inFig. 2. As a more stringent thresh-old, we chose log(ratio)values of ± 0.1, which correspond to ratiosof 1.26 and 0.79; a less stringent threshold of ± 0.04, which correspond to ratios of 1.1 and 0.9 was also used. Only changes where the average log(ratio) ± SEM-95% exceeded these thresholds were considered significant as given for SEA-DCs versus MED-DCs (Fig. 3, Supp. Table 6) and LPS-DCs versus MED-DCs (Fig. 4, Supp. Table 7). The more stringent threshold is shown as shaded bars and rows. In SEA-DCs versus MED-DCs, the greatest up-regulation was for nuclear proteins (mainly histones) while several pro-teins associated with antigen uptake, processing and presen-tation (chaperones, clathrin, enzymes and the small GTPase Rab-7) were also up-regulated (Fig. 3, Supp. Table 6). Other molecules which were significantly up-regulated included: S100A9, 14-3-3β/α(part of TGFβfamily), lymphocyte cytosolic protein 1 and lysozyme C. In contrast, decreased expression was observed for FcεRI, Rap-1B, hematopoietic cell specific lyn substrate 1, CD44, several annexins, MHC class II molecule (I-A), subunit 2 of actin-related protein 2/3 (Arp2/3) complex, lymphocyte-specific 1 protein (LSP1) and S100A10 (Fig. 3, Supp. Table 6). Down-regulation was also recorded for certain cytoskeletal proteins (ezrin, moesin, myosin and several iso-forms of actin). The most pronounced down-regulation affect-ed a protein not expectaffect-ed to be expressaffect-ed by DCs: NAP-22 (22 kDa neuronal tissue-enriched acidic protein). Finally, sev-eral immune-related proteins were expressed at similar levels between SEA-DCs and MED-DCs (Fig. 3) including the integrins CD11b and CD18, the macrophage lectin CD301b, CD98 heavy chain, CD45, as well as MHC class I molecules (H-2Db
and H-2Kb) and their associated
β2-microglobulin. Also expressed at similar levels was the subunit 4 of Arp2/3 com-plex, proteins involved in general cell metabolism and the ras-related proteins Rac-1, -2, -3 together with cdc42.
Several proteins were highly up-regulated in LPS-DCsversus MED-DCs (Fig. 4, Supp. Table 7) including MHC class II molecules
(IA-αrepresenting the highest increase), CD98 heavy chain, β2-microglobulin and transgelin 2. Intriguingly, NAP-22 was up-regulated in LPS-DCs versus MED-DCs (it was down-regulated in SEA-DCs versusMED-DCs). The integrin CD29 (βsubunit of VLA-4) was also up-regulated but not identified between SEA-DCsversusMED-DCs. Down-regulation affect-ed S100A10, moesin and CD44, as also reportaffect-ed for SEA-DCs versus MED-DCs. Additionally, we observed specific de-creased expression of CD18, both chains of ATP synthase and the precursor of cathepsin D. Significantly, expression of the secretory protein YM-1, associated with‘ alternative-ly-activated’macrophages, was also highly down-regulated in LPS-DCsversusMED-DCs. Proteins whose expression was unchanged between LPS-DCsversusMED-DCs were GAPDH, several ras-related proteins (including Rab-7), several actin isoforms and galectin-3.
Analysis of protein classification according to GO terms revealed that SEA-DCs had numerous (k= 17) up-regulated pro-teins related to cellular metabolism, in particular Nucleoside phosphate metabolic processing (Table 2). These cells also exhibited up-regulated proteins associated with cytoskeleton remodelling specifically a number linked to the formation of cell projections (k= 13). On the other hand, SEA-DCs had down-regulated proteins associated with responses to chemical stimulation (k=10) and GTPase activity (k= 5). Interestingly, down-regulated protein hits also mapped to those associated with antigen processing, and regulation of the adaptive im-mune response. In contrast, up-regulated proteins in LPS-DCs mapped clearly to antigen presentation and the MHC protein complex, whilst down-regulated proteins were associated with transmembrane transporter activity, catabolic processes and responses to wound healing (all k= 3).
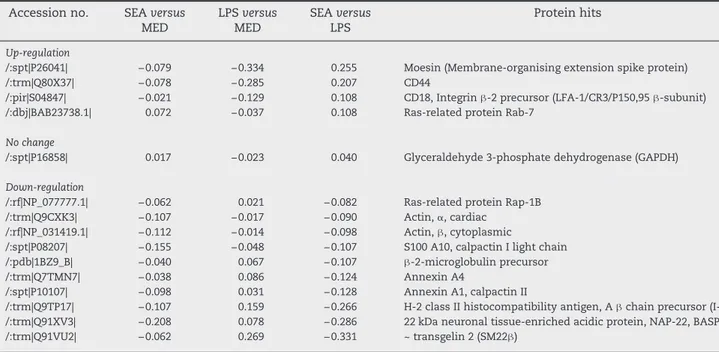
3.4. Extrapolated changes between Th2 DCs and
pro-Th1 DCs
As we could not directly compare SEA-DCs versus LPS-DCs (due to the constraints of the availability of only 3 iTRAQ la-bels), we made an extrapolation of the above data in order to number of peptides
0.4
0.3
0.2
0.1
0.0
-0.1
-0.2
-0.3
0 5 10 15 20 25 30
values of 0.1 = dar
k shading
values of 0.04 = pale shading
compare the protein expression changes between pro-Th2 and pro-Th1 DCs (Table 3). Amongst the proteins identified both in SEA-DCs versus MED-DCs and LPS-DCs versus MED-DCs, moesin, CD18, CD44 and Rab-7 were increased in SEA-DCs compared to LPS-DCs. Conversely, transgelin 2, NAP-22, MHC class II, annexin A1 and A4,β2-microglobulin, S100A10 protein, two actin isoforms and Rap-1b were down-regulated. The only protein similarly expressed by both types of differentially matured DCs was GAPDH.
3.5. Validation of protein expression by flow cytometry
LPS-DCs but down-regulated in SEA-DCs, mirroring proteomic analysis. Whilst CD98 was up-regulated in both LPS-DCs and SEA-DCs compared to MED-DCs, CD18 was only up-regulated in SEA-DCs and was more abundant than in LPS-DCs. CD44 was expressed at higher levels in SEA-DCs than LPS-DCs. Several molecules were expressed at similar levels in all three types of DCs (i.e.galectin-3 and CD301b) corroborating proteomic analysis, although the expression of Rab-7 which was elevated at the proteomic level in SEA-DCs compared to LPS-DCs, was not differentially expressed as judged by flow cytometry. Finally, the secretory molecule YM-1, which was significantly down-regulated in LPS-DCversusMED-DC as de-termined by iTRAQ, was also down-regulated as judged by flow cytometry, although it was detected at slightly lower levels in SEA-DCs compared to MED-DCs.
4.
Discussion
Over the past decade, proteomics has been utilised to determine differences between various immune cells[23]and in particular to study differences between whole cell extracts from immature DCs and differentially matured DCs with various PAMPs[24]. Mainly, these studies have employed 2-DE-based proteomics
and highlighted changes in the expression of cytoskeletal and cytoplasmic molecules needed for basic cellular functions [12–14,25]. Such an approach favours soluble and abundant cy-tosolic proteins but compromises the detection of scarcer and detergent-soluble proteins, such as those present in plasma membranes. In the present study, we focussed upon the pro-teomes of plasma membrane-enriched fractions of differential-ly matured DCs. Although the fractions isolated were relativedifferential-ly crude, they were clearly enriched in plasma membrane compo-nents (~30–50%).
Indeed, LC–MS/MS has several advantages in the analysis of plasma membrane components. First, it requires only low amounts of any given protein for MS analyses, so is suitable for scarcer proteins. Second, digestion of enriched mem-branes can be performed in the presence of trace amounts of ionic detergents which, along with the use of reducing and alkylating reagents, allows for improved trypsin cleavage leading to higher sequence coverage for a given protein. Furthermore, labelling peptides with iTRAQ tags prior to LC–MS/MS allows the relative amounts of a protein to be de-termined in different cell groups, which is difficult to be ac-curately demonstrated by‘label-free’LC–MS/MS.
As revealed by our ‘label-free’ shotgun proteomics and found in all three types of DCs, the most abundant molecules associated with the plasma membrane including those with a CD prefix, ras-related proteins, MHC molecules and GNBPs. Others included proteins associated with membrane and ves-icle trafficking such as the calcium-sensitive annexins[26] and phagocyte-specific S100 calcium binding proteins which are major damage associated molecular patterns[27]. The three differentially matured DCs also all expressed lympho-cyte cytosolic protein 1 (also called 65 kDa macrophage pro-tein), LSP-1 (F-actin binding protein) and FcεRI, although various immune associated proteins were only found in one or two of the DC types. For instance, immature MED-DCs and pro-Th2 SEA-DCs both expressed CD11b, CD44, CD45 and CD48, while both pro-Th2 DCs and pro-Th1 DCs expressed the heavy chain of CD98 which is involved in activation of naive and memory CD4 and CD8 T cells[28], thereby arguing against the‘default’hypothesis of pro-Th2 DCs.
Table 1–Experimental design for iTRAQ. Summary of the six experiments comparing plasma membrane proteins from separate cultures of DCs grown in medium only (MED #1–6), or stimulated with SEA (SEA #1–3) or LPS (LPS # 1–3).
iTRAQ Label
Expt # 114 115 116
1 MED-1 SEA-1 MED-1
2 MED-2 SEA-2 MED-2
3 MED-3 SEA-3 MED-3
4 MED-4 LPS-1 MED-4
5 MED-5 LPS-2 MED-5
6 MED-6 LPS-3 MED-6
-0.50 -0.40 -0.30 -0.20 -0.10 -0.00 0.10 0.20 0.30 0.40 0.50
MoesinSecretory protein YM-1 Cathepsin D precursor CD44
ATP synthase chain Phosphate carrier protein ATP synthase chain
Prosaposin CD18 S100A10 2-microglobulin precursor
Annexin A4 CD98 heavy chain NAP-22CD29 H-2 class II (IA) ~ transgelin 2 (SM22 )H-2 class II (IA- )
The association of LC–MS/MS with iTRAQ labelling enabled comparison and quantification of changes in the plasma membrane proteome, many of which being confirmed by flow cytometry. As our study compared three biological repli-cates of each type of DCs, we were able to determine whether changes in the level of protein expression were reproducible. Our study revealed significantly increased levels of MHC class II molecules in pro-Th1 DCs, which were unchanged or decreased in pro-Th2 DCs. Surprisingly, CD29 which mediates the interaction of immature DCs with extracellular matrix components, and thus with a likely role in the retention of DCs in the periphery[29,30], was also highly expressed by LPS-DCsversusimmature DCs. Conversely, pro-Th2 SEA-DCs expressed increased levels of proteins like CD18 and CD44.
The greatest decrease of any protein expressed in pro-Th2 SEA-DCs was for NAP-22 (also called BASP-1 or CAP-23) where-as it wwhere-as greatly up-regulated on pro-Th1 DCs. This molecule was originally identified as a membrane/cytoskeletal protein from rat brain and is a member of a family of motility associ-ated proteins linked to actin reorganisation and neurite devel-opment[31,32]. Recently, it has been defined in the context of blocking oncogenic Myc protein-induced cell transformation [33]. Although this molecule was not expected to be expressed by DCs, and has not previously been identified as having de-monstrable immune function, its differential distribution be-tween pro-Th1 versus pro-Th2 is intriguing and warrants further investigation. One of the most down-regulated mole-cules in pro-Th1 LPS-DCs versus MED-DCs was YM-1 as
CD44
Med SEA LPS
100 125 150 175 200
MF
I
YM-1
Med SEA LPS
3 5 7 9
MF
I
S100 A10
Med SEA LPS
10 15 20 25
MF
I
∗∗
∗∗
∗
∗
CD29
Med SEA LPS
50 60 70 80 90
MF
I
Rab7
Med SEA LPS
10 15 20 25
MF
I
Med SEA LPS
200 250 300 350 400
MF
I
∗∗
∗
∗∗
MGL
Med SEA LPS
40 50 60 70 80
MF
I
IA/IE
Med SEA LPS
50 100 150 200
MF
I
∗∗
CD98
Med SEA LPS
30 40 50 60
MF
I
IA-b
Med SEA LPS
5 10 15 20
MF
I
Galectin-3
Med SEA LPS
100 150 200 250 300
MF
I
∗
∗
∗∗
CD18
determined from the proteomic data and verified by flow cytometry. This molecule has been associated with the de-velopment of ‘alternatively-activated’ macrophages and the recruitment of eosinophils [34], particularly after multiple exposure to schistosome cercariae[35] and other helminth infections which induce Th2-type immune re-sponses[36,37].
A number of other changes in protein expression may help explain the differential DC phenotype/function. For example, SEA-DCs may be more efficient at antigen uptake and proces-sing than immature MED-DCs as several chaperone proteins and enzymes involved in protein folding were up-regulated in pro-Th2 DCs compared to immature DCs (i.e.HSP-90α, two iso-forms of hsc71, clathrin and Rab-7) although flow cytometry analysis revealed intracellular Rab-7 expression was similar be-tween pro-Th2 DCs and pro-Th1 DCs. Another molecule up-regulated in SEA-DCs was protein disulfide isomerase which not only participates in the editing of MHC class I peptide reper-toire[38]but also inhibits the transcriptional activity of NF-κB as a downstream signal of IL-10[39]. In contrast, most of the pro-teins reported above were not identified in mature pro-Th1 DCs that have lost their capacity to take up and process antigen, however they are poised to present antigens, as suggested by our GO term enrichment analysis. Moreover, many enzymes and transporters related to general cell metabolism (i.e.malate dehydrogenase, pyruvate kinase 3, arginosuccinate synthase, fructose-bisphosphate aldolase A, enolase 1 and two chains of transporting ATPase Na+/K+) were up-regulated, or expressed
at similar levels, between SEA-DCs versus MED-DCs, while their expression was mostly decreased in LPS-DCs versus MED-DCs. This suggests that MED-DCs and pro-Th2 DCs are more metabolically active compared to pro-Th1 LPS-DCs that have matured into an‘end state’. GO term enrichment analysis confirmed that pro-Th2 DCs up-regulated proteins associated
with nucleotide metabolism, whilst at the same time had down-regulated responses to chemical stimulus and regulation of the adaptive immune response.
Many of the proteomic changes in pro-Th2 SEA-DCs affect-ed cytoskeletal proteins confirming previous studies using 2-DE-based proteomics[14]. For example, vimentin, tubulin β5, non-muscle myosin, talin and coactosin-like protein were all up-regulated in SEA-DCs, whereas proteins associ-ated to actin such as Arp2/3 with a role in membrane traf-ficking [40] and ezrin–radixin–moesin complex that links cytoskeletal components with plasma membrane proteins [41] were down-regulated versus MED-DCs. Moreover, in LPS-DCs few cytoskeletal proteins were identified, alterna-tively they were down-regulated or expressed at similar levels compared to MED-DCs (i.e.actin isoforms, destrin and moesin). Finally, our study also reveals that SEA-DCs contain twice as many nuclear proteins than LPS-DCs or immature DCs. These proteins include initiation and elongation factors, several histones, signalling proteins (MAPK3, Erk-1) indicating that SEA may be a potent stimulus for DC proliferation.
Our study using iTRAQ labelling combined with LC–MS–MS has provided a valuable appraisal of the repertoire of proteins expressed by differentially matured DCs particularly within the plasma membrane. This offered new insights into how differentially matured DCs may function to promote Th1 or Th2 polarisation of the adaptive immune response. A caveat to studies using bone-marrow derived DCs is that whilst the cells have a high level of purity and are of immature/neutral status, they may not be representative of DCs from tissuesin vivo which are subject to many local factors, such as the local cytokine environment[35], which influence their matu-ration as pro-Th1versuspro-Th2 DCs. However, we believe that our combined approach has the potential to reveal the identity of further molecules involved in DC differentiation, Table 2–Analysis of differentially regulated proteins according to Gene Ontology term. Proteins were analysed for GO term enrichment and presented as up-regulated (top panel), or down-regulated (bottom panel) for SEA-DCs and LPS-DCs. Significance is given as p-value, whilst the number of different proteins identified within a given classification is presented as k.
SEA-DCsversusMED-DCs LPS-DCsversusMED-DCs
Up-regulated Up-regulated
GO term p-value k GO term p-value k
Cell projection GO:0042995 1.49E−11 13 Antigen processing and presentation of exogenous peptide antigen
GO:0002478 1.27E−08 3
Purine ribonucleoside triphosphate binding
GO:0035639 1.34E−06 10 MHC protein complex GO:0042611 1.67E−08 3
Metabolic process GO:0008152 5.52E−05 17 Peptide antigen binding GO:0042605 5.42E−06 2 Nucleoside phosphate metabolic
process
GO:0006753 6.53E−05 5 Cellular developmental process GO:0048869 9.77E−04 4
Down-regulated Down-regulated
GO term p-value k GO term p-value k
Response to chemical stimulus GO:0042221 8.38E−07 10 Active transmembrane transporter activity
GO:0022804 6.49E−05 3
GTPase activity GO:0003924 2.02E−07 5 Catabolic process GO:0009056 2.92E−04 4 Antigen processing and presentation of
exogenous peptide antigenviaMHC class II
GO:0019886 5.49E−05 2 Response to wounding GO:0009611: 2.12E−04 3
especially if increased peptide sample fractionation coupled to higher sensitivity mass spectrometry instrumentation is employed. Accordingly, Segura et al. [42]recently reported an extensive comparative list of membrane proteins from immunopurified DCs using 2D liquid peptide fractionation fol-lowed by MS/MS in an Orbitrap instrument. However, their analysis was performed using only a single biological sample and protein expression was inferred by spectral counting. Their study also did not examine differential maturation after stimulation of DCs with different PAMPs.
In conclusion, our study and resulting analysis of the pro-teomic data support the view of a ‘limited maturation’ of pro-Th2 DCs compared to pro-Th1 DCs. We also report evi-dence of the expression of a restricted number of membrane proteins which may be unexpected ‘signatures’ of pro-Th2 DCs and consequently warrant further investigation.
Supplementary materials related to this article can be found online atdoi:10.1016/j.jprot.2011.10.010.
Acknowledgements
S.F.B and W.C.B were supported by the UK Biotechnology and Biological Sciences Research Council (grants # BBS/B/08531 and # BB/C516328 respectively); A.P.M and J.D.T received funding from the Wellcome Trust (grants # 071762 and # 072255) and The European Union (INCO-CT-2006-032405). D.E.S. was funded by COLFUTURO and the Departamento Administrativo de Ciencia, Tecnologia e Innovacion de la Republica de Colombia (COLCIENCIAS). P.C.C. was in receipt of a BBSRC PhD student-ship. We would like to thank Ann Bamford for assistance during the course of this project.
R E F E R E N C E S
[1] Heath WR, Carbone FR. Dendritic cell subsets in primary and secondary T cell responses at body surfaces. Nat Immunol 2009;10:1237–44.
[2] Colonna M, Pulendran B, Iwasaki A. Dendritic cells at the host–pathogen interface. Nat Immunol 2006;7:117–20. [3] MacDonald AS, Straw AD, Bauman B, Pearce EJ. CD8- dendritic
cell activation status plays an integral role in influencing Th2 response development. J Immunol 2001;167:1982–8.
[4] Balic A, Harcus Y, Holland MJ, Maizels RM. Selective maturation of dendritic cells byNippostrongylus brasiliensis-secreted proteins drives Th2 immune responses. Eur J Immunol 2004;34: 3047–59.
[5] Cervi L, MacDonald AS, Kane C, Dzierszinski F, Pearce EJ. Cutting edge: dendritic cells copulsed with microbial and helminth antigens undergo modified maturation, segregate the antigens to distinct intracellular compartments, and concurrently induce microbe-specific Th1 and helminth-specific Th2 responses. J Immunol 2004;172:2016–20.
[6] Perona-Wright G, Jenkins SJ, MacDonald AS. Dendritic cell activation and function in response toSchistosoma mansoni. Int J Parasitol 2006;36:711–21.
[7] Jenkins SJ, Mountford AP. Dendritic cells activated with products released by schistosome larvae drive Th2-type immune responses, which can be inhibited by manipulation of CD40 costimulation. Infect Immun 2005;73:395–402. [8] Kelsall BL, Biron CA, Sharma O, Kaye PM. Dendritic cells at the
host–pathogen interface. Nat Immunol 2002;3:699–702. [9] Mac Donald AS, Maizels RM. Alarming dendritic cells for Th2
induction. J Exp Med 2008;205:13–7.
[10] Le Naour F, Hohenkirk L, Grolleau A, Misek DE, Lescure P, Geiger JD, et al. Profiling changes in gene expression during differentiation and maturation of monocyte-derived dendritic cells using both oligonucleotide microarrays and proteomics. J Biol Chem 2001;276:17920–31.
Table 3–Extrapolated proteins changes between SEA-DCs and LPS-DCs. List of proteins present both inTable 1(SEA-DCs
versusMED-DCs) andTable 2(LPS-DCsversusMED-DCs) with their respective average log(ratio):(1)and(2). The extrapolated average log(ratio) for pro-Th2 SEA-DCs compared to pro-Th1 LPS-DCs equals(1)–(2). Shaded rows highlighted major changes at the most stringent threshold: log(ratio)values of ±0.1. The table presents the proteins from the most up-regulated at the top to the most down-regulated at the bottom. The accession numbers were the ones given by the Mascot search against the CDS mouse database.
Accession no. SEAversus MED
LPSversus MED
SEAversus LPS
Protein hits
Up-regulation
/:spt|P26041| −0.079 −0.334 0.255 Moesin (Membrane-organising extension spike protein) /:trm|Q80X37| −0.078 −0.285 0.207 CD44
/:pir|S04847| −0.021 −0.129 0.108 CD18, Integrinβ-2 precursor (LFA-1/CR3/P150,95β-subunit) /:dbj|BAB23738.1| 0.072 −0.037 0.108 Ras-related protein Rab-7
No change
/:spt|P16858| 0.017 −0.023 0.040 Glyceraldehyde 3-phosphate dehydrogenase (GAPDH)
Down-regulation
/:rf|NP_077777.1| −0.062 0.021 −0.082 Ras-related protein Rap-1B /:trm|Q9CXK3| −0.107 −0.017 −0.090 Actin,α, cardiac
/:rf|NP_031419.1| −0.112 −0.014 −0.098 Actin,β, cytoplasmic
/:spt|P08207| −0.155 −0.048 −0.107 S100 A10, calpactin I light chain /:pdb|1BZ9_B| −0.040 0.067 −0.107 β-2-microglobulin precursor /:trm|Q7TMN7| −0.038 0.086 −0.124 Annexin A4
/:spt|P10107| −0.098 0.031 −0.128 Annexin A1, calpactin II
[11] Richards J, Le Naour F, Hanash S, Beretta L. Integrated genomic and proteomic analysis of signaling pathways in dendritic cell differentiation and maturation. Ann N Y Acad Sci 2002;975:91–100.
[12] Pereira SR, Faça VM, Gomes GG, Chammas R, Fontes AM, Covas DT, et al. Changes in the proteomic profile during
differentiation and maturation of human monocyte-derived dendritic cells stimulated with granulocyte macrophage colony stimulating factor/interleukin-4 and lipopolysaccharide. Proteomics 2005;5:1186–98.
[13] Rivollier A, Perrin-Cocon L, Luche S, Diemer H, Strub JM, Hanau D, et al. High expression of antioxidant proteins in dendritic cells: possible implications in atherosclerosis. Mol Cell Proteomics 2006;5:726–36.
[14] Ferret-Bernard S, Curwen RS, Mountford AP. Proteomic profiling reveals that Th2-inducing dendritic cells stimulated with helminth antigens have a‘limited maturation’
phenotype. Proteomics 2008;8:980–93.
[15] Gundacker NC, Haudek VJ, Wimmer H, Slany A, Griss J, Bochlov V, et al. Cytoplasmic proteome and secretome profiles of differently stimulated humn dendritic cells. J Proteome Res 2009;8:2799–811.
[16] Jenkins SJ, Hewitson JP, Ferret-Bernard S, Mountford AP. Schistosome larvae stimulate macrophage cytokine production through TLR4-dependent and -independent pathways. Int Immunol 2005;17:1409–18.
[17] Paveley RA, Aynsley SA, Cook PC, Turner JD, Mountford AP. Fluorescent imaging of antigen released by a skin-invading helminth reveals differential uptake and activation profiles by antigen presenting cells. PLoS Negl Trop Dis 2009;3:e528. [18] Zieske LR. A perspective on the use of iTRAQ reagent
technology for protein complex and profiling studies. J Exp Bot 2006;57:1501–8.
[19] Gan CS, Chong PK, Pham TK, Wright PC. Technical, experimental, and biological variations in isobaric tags for relative and absolute quantitation (iTRAQ). J Proteome Res 2007;6:821–7.
[20] Song X, Bandow J, Sherman J, Baker JD, Brown PW, McDowell MT, et al. iTRAQ experimental design for plasma biomarker discovery. J Proteome Res 2008;7:2952–8.
[21] Spooncer E, Brouard N, Nilsson SK, Williams B, Liu MC, Unwin RD, et al. Developmental fate determination and marker discovery in hematopoietic stem cell biology using proteomic fingerprinting. Mol Cell Proteomics 2008;7:573–81.
[22] Pierce A, Unwin RD, Evans CA, Griffiths S, Carney L, Zhang L, et al. Eight-channel iTRAQ enables comparison of the activity of six leukemogenic tyrosine kinases. Mol Cell Proteomics 2008;7:853–63.
[23] Wang X, Zhao H, Andersson R. Proteomics and leukocytes: an approach to understanding potential molecular mechanisms of inflammatory responses. J Proteome Res 2004;3:921–9. [24] Ferreira GB, Mathieu C, Oberbergh L. Understanding dendritic
cell biology and its role in immunological disorders through proteomic profiling. Proteomics Clin Appl 2010;4:190–203. [25] Slany A, Haudek VJ, Gundacker NC, Griss J, Mohr T, Wimmer
H, et al. Introducing a new parameter for quality control of proteome profiles: consideration of commonly expressed proteins. Electrophoresis 2009;30:1306–28.
[26] Gerke V, Creutz CE, Moss SE. Annexins: linking Ca2+ signalling to membrane dynamics. Nat Rev Mol Cell Biol 2005;6:449–61.
[27] Foell D, Wittkowski H, Vogl T, Roth J. S100 proteins expressed in phagocytes: a novel group of damage-associated molecular pattern molecules. J Leukoc Biol 2007;81:28–37.
[28] Woodhead VE, Stonehouse TJ, Binks MH, Speidel K, Fox DA, Gaya A, et al. Novel molecular mechanisms of dendritic cell-induced T cell activation. Int Immunol 2000;12:1051–61. [29] Randolph GJ, Angeli V, Swartz MA. Dendritic-cell trafficking to lymph nodes through lymphatic vessels. Nat Rev Immunol 2005;5:617–28.
[30] Lehner M, Stilper A, Morhart P, Holter W. Plasticity of dendritic cell function in response to prostaglandin E2 (PGE2) and interferon-gamma (IFN-gamma). J Leukoc Biol 2008;83: 883–93.
[31] Epand RF, Sayer BG, Epand RM. Induction of raft-like domains by a myristoylated NAP-22 peptide and its Tyr mutant. FEBS J 2005;272:1792–803.
[32] Korshunova I, Caroni P, Kolkova K, Berezin V, Bock E, Walmod PS. Characterization of BASP1-mediated neurite outgrowth. J Neurosci Res 2008;86:2201–13.
[33] Hartl M, Nist A, Khan MI, Valovka T, Bister K. Inhibition of Myc-induced cell transformation by brain acid-soluble protein 1 (BASP1). Proc Natl Acad Sci U S A 2009;106:5604–9. [34] Martinez FO, Helming L, Gordon S. Alternative activation of macrophages: an immunologic functional perspective. Annu Rev Immunol 2009;27:451–83.
[35] Cook PC, Aynsley SA, Turner JD, Jenkins GR, Van Rooijen N, Leeto M, et al. Multiple helminth infection of the skin causes lymphocyte hypo-responsiveness mediated by Th2
conditioning of dermal myeloid cells. PLoS Pathog 2011;7: e1001323.
[36] Prieto-Lafuente L, Gregory WF, Allen JE, Maizels RM. MIF homologues from a filarial nematode parasite synergize with IL-4 to induce alternative activation of host macrophages. J Leukoc Biol 2009;85:844–54.
[37] Reyes JL, Terrazas CA, Vera-Arias L, Terrazas LI. Differential response of antigen presenting cells from susceptible and resistant strains of mice toTaenia crassicepsinfection. Infect Genet Evol 2009;9:1115–27.
[38] Park B, Lee S, Kim E, Cho K, Riddell SR, Cho S, et al. Redox regulation facilitates optimal peptide selection by MHC class I during antigen processing. Cell 2006;127:369–82.
[39] Higuchi T, Watanabe Y, Waga I. Protein disulfide isomerase suppresses the transcriptional activity of NF-kappaB. Biochem Biophys Res Commun 2004;318:46–52.
[40] Takenawa T, Suetsugu S. The WASP-WAVE protein network: connecting the membrane to the cytoskeleton. Nat Rev Mol Cell Biol 2007;8:37–48.
[41] Tsukita S, Yonemura S. ERM (ezrin/radixin/moesin) family: from cytoskeleton to signal transduction. Curr Opin Cell Biol 1997;9:70–5.