Quantification of the Host Response Proteome after
Mammalian Reovirus T1L Infection
Alicia R. Berard1,2, John P. Cortens2, Oleg Krokhin2, John A. Wilkins1,2, Alberto Severini1,3, Kevin M. Coombs1,2,4*
1Department of Medical Microbiology, Faculty of Medicine, University of Manitoba, Winnipeg, Manitoba, Canada,2Manitoba Center for Proteomics and Systems Biology, University of Manitoba, Winnipeg, Manitoba, Canada,3National Microbiology Laboratory, Winnipeg, Manitoba, Canada,4Manitoba Institute of Child Health, University of Manitoba, Winnipeg, Manitoba, Canada
Abstract
All viruses are dependent upon host cells for replication. Infection can induce profound changes within cells, including apoptosis, morphological changes, and activation of signaling pathways. Many of these alterations have been analyzed by gene arrays to measure the cellular ‘‘transcriptome.’’ We used SILAC (stable isotope labeling by amino acids in cell culture), combined with high-throughput 2-D HPLC/mass spectrometry, to determine relative quantitative differences in host proteins at 6 and 24 hours after infecting HEK293 cells with reovirus serotype 1 Lang (T1L). 3,076 host proteins were detected at 6hpi, of which 132 and 68 proteins were significantly up or down regulated, respectively. 2,992 cellular proteins, of which 104 and 49 were up or down regulated, respectively, were identified at 24hpi. IPA and DAVID analyses indicated proteins involved in cell death, cell growth factors, oxygen transport, cell structure organization and inflammatory defense response to virus were up-regulated, whereas proteins involved in apoptosis, isomerase activity, and metabolism were down-regulated. These proteins and pathways may be suitable targets for intervention to either attenuate virus infection or enhance oncolytic potential.
Citation:Berard AR, Cortens JP, Krokhin O, Wilkins JA, Severini A, et al. (2012) Quantification of the Host Response Proteome after Mammalian Reovirus T1L Infection. PLoS ONE 7(12): e51939. doi:10.1371/journal.pone.0051939
Editor:Houssam Attoui, Institute for Animal Health, United Kingdom
ReceivedJuly 9, 2012;AcceptedNovember 13, 2012;PublishedDecember 11, 2012
Copyright:ß2012 Berard et al. This is an open-access article distributed under the terms of the Creative Commons Attribution License, which permits unrestricted use, distribution, and reproduction in any medium, provided the original author and source are credited.
Funding:This work was supported by grant MT-11630 from the Canadian Institutes of Health Research to K.M.C. A.R.B. was the recipient of a Manitoba Health Research Council Studentship. The authors thank Kolawole Opanubi for expert technical assistance, and members of the laboratory for reviewing the manuscript. The funders had no role in study design, data collection and analysis, decision to publish, or preparation of the manuscript.
Competing Interests:The authors have declared that no competing interests exist.
* E-mail: [email protected]
Introduction
An understanding of how host cells respond to an invading pathogen may provide important clues about how to either attenuate pathogenesis mediated by the agent, or may facilitate attempts to subvert the pathogen into a ‘beneficial’ organism. At any given time, a cell’s genome remains constant. However, during a cell’s life cycle, proteins that are expressed within the cell (proteome) will vary depending on numerous external influences that alter genomic biochemical interactions. A cell’s proteome is dependent on the location of the cell, different stages of its life cycle or environmental conditions. When a cell becomes exposed to an invading microorganism, such as a virus that requires the host cell’s machinery and metabolism to replicate, the cell’s proteome reflects the specific alterations of the pathways induced by infection.
Previous analyses of how cells respond to various stimuli have used microarray technologies which measure the cellular ‘‘tran-scriptome’’ [1,2]. For example, tomato mRNAs are differentially expressed at different times post infection by Cucumber mosaic virus [3]. In addition, microarray analysis of host genetic expression profiles in different HIV disease progression patients detected differences in host responses that may influence severity of the disease [4]. However, there is frequently little concordance between microarray and protein data [5,6], partly because mRNA levels cannot provide information about protein post-translational
modifications that may prevent or initiate protein activation or degradation. In addition, genes may also encode more than one protein. Therefore, monitoring a cells’ proteome should provide additional insight into host responses during infection.
Recent advances in mass spectrometry and bioinformatics have now provided several general ways that allow in-depth quantitative analysis of large numbers of proteins, and these are being used in several systems to examine the proteome. These methods include 2D difference gel electrophoresis (2D DIGE), isotope-coded affinity tagging (ICAT) and the similar iTRAQ (Isobaric tag for relative and absolute quantitation), as well as stable isotope labeling by amino acids in cell culture (SILAC) [7,8]. We elected to use SILAC, which involves labeling two separate cultures, one light (L) and one heavy (H), with isotopically differentiated essential amino acids [9]. An advantage with SILAC is the early mixing of samples, which reduces sample-to-sample variability. In addition, several comparative studies have suggested that non-gel based methods such as SILAC can identify many more regulated proteins than gel-based studies (reviewed in [10]). SILAC has been recently used in virus studies to explore the secretory pathway of host cells in coronavirus replication [11], and examining A549 cell responses after infection by either respiratory syncytial virus [12], or influenza virus [13].
L929 HEK293 A549 Caco2 Hela
T1L T3D
Hours Post Infection
0 24 48 72
V
irus T
it
e
r (P
FU/
m
l)
105
106
107
108
109
1010
a)
T1L
Hours Post Infection
0 24 48 72
105
106
107
108
109
1010
b)
T3D
Hours Post Infection
0 24 48 72
V
irus T
it
e
r (P
FU/
m
l)
105
106
107
108
109
1010
c)
HEK293
d)
Hours Post Infection
0 24 48 72
105
106
107
108
109
1010
L929
T1L T3D
Puromycin
Mock
Hours Post Infection
0 3 6 9 12 15 18 24 30 36 48 72
Percentage Dead Cells
0 20 40 60 80 100
e)
HEK293
Hours Post Infection
0 3 6 9 12 15 18 24 30 36 48 72 0
20 40 60 80 100
f)
L929
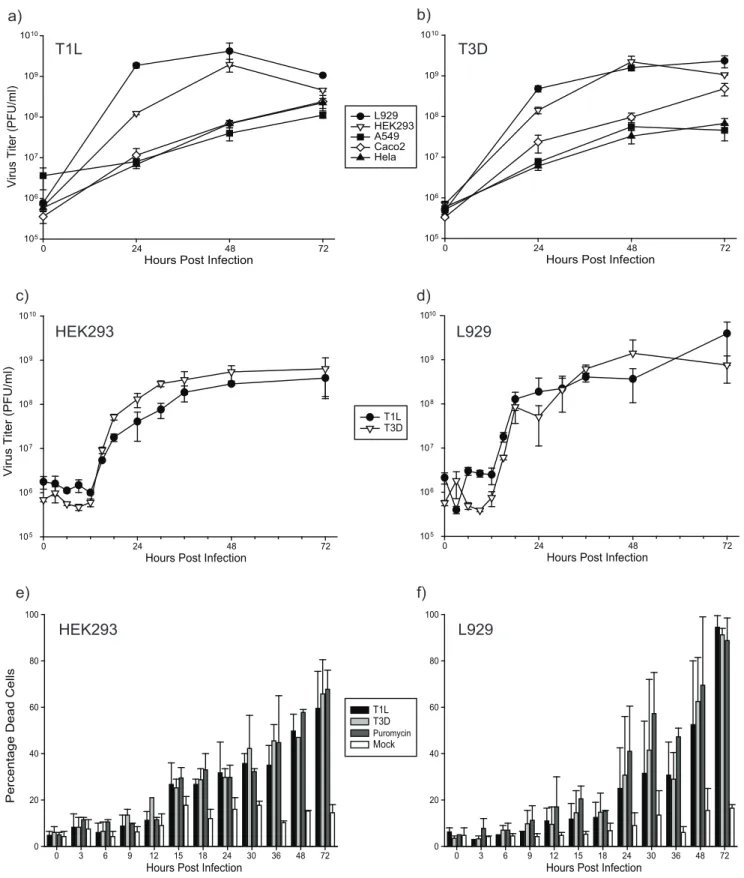
Figure 1. Kinetics of reovirus growth and viral-induced cytopathology.Each of five different cell lines (L929, A549, HEK293, CaCo2and Hela)
were infected at MOI = 1 PFU/cell with T1L (a) or T3D (b). Cell lysates were harvested at 0, 24, 48 and 72hpi and titrated. Experiments were performed in triplicate; error bars represent standard error. Virus titers were greatest in the L929 and HEK293 cells for both virus strains. HEK293 (c) and L929 (d) cells were then re-analyzed as in (a) and (b) after infection at MOI = 5 and at additional time points. Aliquots of the infections in (c) and (d) were also assessed for cell viability by trypan blue exclusion (e and f, respectively), with 100mg/ml puromycin used as a positive cell killing control. Experiments were performed in duplicate; error bars represent standard error.
[14], many of which, unlike the prototype virus, are highly pathogenic in their hosts. MRV are non-enveloped viruses with genomes of 10 segments of double-stranded (ds) RNA surrounded by 2 concentric protein capsids (for detailed reviews see [15,16]). Numerous stages in the MRV life cycle involve interaction of viral components with host proteins. MRV replication is primarily cytoplasmic, starting with binding of the virion to host receptors and receptor-mediated endocytosis. The virion is converted to intermediate subviral particles by proteolytic cleavage of the outer capsid proteins by host proteases. Once cleavage occurs, the virion enters the cell’s cytosol and the released core particles act as transcriptionally active RNA-dependent RNA polymerase com-plexes to produce viral mRNA. The viral mRNA molecules are translated by host ribosomes to produce viral proteins. Virus proteins coalesce into non-membrane inclusions in the cytoplasm by an unknown mechanism. Interactions with host interferon-regulated proteins, such as RNase-L and PKR aid to switch production of transcripts needed for replication purposes to production of progeny virions. Recoating occurs inside the cell producing infectious intracellular virions, which are released during cell lysis. Because of these viral-host interactions, it is expected that infection of the cell with reovirus will cause differential regulation of many host proteins. MRV affect the gastrointestinal system or cause respiratory infections in humans and recent work has shown that MRV may be a useful oncolytic agent [17,18]. Most studies have shown that MRV strain T3D has oncolytic properties, and this subtype has been used in clinical studies [19,20]. However, it has recently been shown that all of the reovirus subtypes show oncolytic potential [17]. Thus, a better understanding of host responses to MRV infection is needed. Previous gene array analyses showed that MRV infection induces transcription of genes involved in apoptosis and DNA repair, as well as alterations in the expression of genes involved in host cell cycle regulation [21,22]. A recent gel-based proteomic screen of MRV-infected murine myocytes demonstrated regulation of several proteins, including heat shock proteins and interferon-response proteins [23].
In this study we used SILAC to examine host protein responses in human embryonic kidney (HEK)-293 cells after 6 and 24 hours of infection by MRV strain T1L. The two time points were chosen to represent an early time point when viral particles are being assembled and a later time point when the mature virus particles are starting to be released. These time points in the viral life cycle are therefore potentially important in host cell and virus interactions that would be represented by differences in host protein abundances in the cell. We identified thousands of proteins at both time points, and a small percentage of these proteins were significantly differentially regulated at each time point. From these data, biological functions and network analysis were performed using DAVID bioinformatics resource [24,25], as well as Ingenuity Pathway Analysis (IngenuityH Systems, www.ingenuity.com). These pathway analyses indicated that cell death, cell growth and proliferation, molecular transport, gene expression, and inflammatory response pathways are most affected by MRV infection.
Methods
Cells and viruses
Viruses. Reovirus serotype 1 Lang (T1L) and serotype 3 Dearing, Cashdollar strain (T3D) are laboratory stocks. The viruses were grown and titrated in mouse L929 cell monolayers in Joklik’s Suspension Modified Minimal Essential Medium (J-MEM) (GIBCO products, Grand Island, NY, USA) supplemented with
5% fetal bovine serum (FBS), and 200 mM l-glutamine, as previously described [26].
Cells. All cell lines that were used, HEK293, L929, A549, CaCo2 and HeLa cells, were acquired from ATCC, catalogue numbers CRL-1573, CCL-1, CCL-185, HTB-37 and CCL-2, respectively. For SILAC preparation, HEK293 (Human embry-onic kidney) cells were grown in D-MEM (Dulbecco’s Modified Eagle Medium) supplied in a SILACTM Phosphoprotein Identi-fication and QuantiIdenti-fication Kit (Invitrogen Canada Inc.; Burling-ton, Ontario). D-MEM was supplemented to contain 10% dialyzed FBS, and either 100 mg/L ‘Light’ (normal) lysine and arginine or ‘Heavy’ (13C6-lysine and13C6-/15N4-arginine). One set
of HEK293 cells were allowed to double 7 times in L media and another set of HEK293 cells were allowed to double 7 times in H media. Three biologic replicates were performed.
SILAC Infection. Approximately 107L-labeled cells in T75 flasks were infected with T1L at a multiplicity of infection (MOI) of 5 PFU per HEK293 cell. Equivalent numbers of H cells were mock-infected as control. The flasks were incubated at 4uC for one hour, with gentle rocking every 10–15 minutes, to allow virus to adsorb and to synchronize infections. An overlay of 10 mls of pre-warmed appropriate L or H media was then added to each flask, and the infected cell cultures were incubated at 37uC for 6 and 24 hours.
Titration
The titers of samples were determined by plaque assays as previously described [27]. Briefly, samples were diluted and used to infect 12 well plates of L929 cells, then overlaid with a nutrient agar solution. After plaque development, cells were stained with crystal violet, and plaques were counted to determine viral titers.
Photomicrography
Infected and mock-infected cells in T25 flasks, and 12 well plates, were examined microscopically for cytopathic effect (CPE) at 0, 3, 6, 9, 12, 15, 18, 24, 30, 36, 48 and 72 hours post infection with a Nikon TE-2000, and cells were photographed with a Canon- A700 digital camera. Images were imported into Power-Point and slight adjustments made in brightness and contrast to the exact same degree for all of the pictures, which did not alter image context with respect to each other.
Cell Viability
HEK293 and L929 cells were infected with either T1L or T3Dc, mock infected, or treated with 100mg/ml puromycin to act as a positive control. At 0, 3, 6, 9, 12, 15, 18, 24, 30, 36, 48 and 72 hours post infection, cells were harvested, and aliquots were combined with Trypan Blue solution (Sigma, cat#T8154-100ML) at 1 1 ratio. A hemocytometer was used to count a total of 200 cells, as well as all dead cells, in each sample.
Immunofluorescence Microscopy
a)
Mock
T1L
T3D
0 6 12 24 36 48
b)
Phalloidin Virus DAPI Merged
Mock
8h
12h
18h
24h
5.31%
64.0%
83.2%
>99%
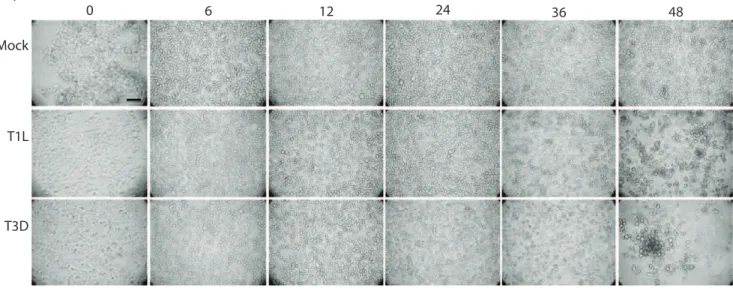
Figure 2. Microscopic evaluation of HEK293 cells infected with reovirus at MOI 5.(a) photomicrographs of 293 cells mock-infected (top row), or infected with T1L (middle row) or T3D (bottom row) for various times (indicated at top). Scale bar = 40mm. (b) HEK293 cells were infected with MRV strain T1L at MOI 5. Cells were stained for f-actin (red), reovirus (green), and DAPI (blue). At 8, 12, 18 and 24 hpi, 5.31%, 64.0%, 83.2% and 100% of cells were infected, respectively (indicated in upper rightmost corner of each image). Scale bar = 40mm.
Once fixed, all spots were washed and cells were permeabilized with 0.2% TritonX-100 in PBS for 5 mins. Spots were blocked using PBS with 1% BSA and 5% FBS, followed with primary antibody (in-house rabbit anti-reovirus), then with Alexa FluorH 488 Goat anti-Rabbit (Invitrogen, cat#A11008) secondary anti-body, DAPI (Invitrogen, cat#D1306), and Alexa FluorH 546 Phalloidin (Invitrogen, cat#A22283). Anti-fade reagent (Invitro-gen, cat#P36935) was added to each spot before slides were covered with coverslips. Slides were examined on a Zeiss Axio Observer Z1 inverted microscope using 206 objective and fluorescence illumination using Exfo Xcite. Images were acquired using AxioVision 4.8.2 software.
Cell Fractionation
At 6 and 24 hours post infection (hpi), both L infected and H mock-infected cells were collected and counted. Aliquots of cultures were also saved for virus titration to confirm infection status. Equal numbers of L and H cells were mixed, and mixed
cells were washed three times with ice-cold Phosphate Buffered Saline (PBS). The washed cells were re-suspended in NP-40 buffer (140 mM NaCl, 1.5 mM MgCl2, 10 mM Tris [pH 7.4], 0.5% NP-40) at a concentration of 2.06108cells/ml, with the addition of Pepstatin A to a concentration of 1.1mM.
The mixed, washed cells were then incubated on ice for 30 minutes with gentle mixing after 15 minutes. The nuclei were pelleted by centrifuging at 300xg for 10 minutes. The cytosol (supernatant) was transferred to a fresh microfuge tube; and the two fractions (nuclear pellet and cytosol) were frozen at280uC until further processing took place.
Reduction and Alkylation
Protein concentrations in cytosolic lysates were determined using a BCATMProtein Assay Kit (Pierce; Rockford, IL). Aliquots corresponding to 300mg of protein were diluted 6-fold with 100 mM ammonium bicarbonate. Samples were reduced with 10 mM (final concentration) of dithiothreitol (DTT) for 45 min-utes at 60uC, alkylated with 50 mM of iodoacetic acid for 30 min at room temperature in the dark. Excess alkylating agent was removed by addition of 16 mM DTT. Samples were digested with 6mg of sequencing grade trypsin (Promega, cat#V5111) overnight at 37uC. A different protein standard was used in the first experiment compared to the second and third experiments, which resulted in less protein being processed, loaded and identified in the second and third experiments.
First dimension fractionation
An Agilent 1100 Series HPLC system with UV detection at 214 nm was used for off-line first dimension fractionation. 100mg of each digested protein sample was loaded onto a 16100 mm XTerra C18 column (Waters, Milford, MA) and separated using a linear 0–35% water-acetonitrile gradient in 60 minutes at 150mL/min flow rate. Both eluents contained 20 mM ammonium formate pH 10 [28,29]. Sixty fractions were collected and concatenated pair-wise according to previously described proce-dures [28]. Briefly, 60 one-minute fractions were collected, and the first 30 fractions were combined with the second 30 fractions (for example, fraction 1 with fraction 31; fraction 2 plus fraction 32, etc). The 30 concatenated fractions were lyophilized, and stored at 280uC until second dimension LC-ESI/MS was performed.
Second dimension Liquid chromatography – Electrospray Mass Spectrometry
The 30 concatenated fractions collected from the first dimen-sion high pH reversed-phase (RP) fractionations were analyzed separately by low-pH RP LC with on-line ESI/TOF Quadupole MS/MS detection (QStar Elite) as was previously described [13]. Raw MS/MS data were analyzed using the Protein PilotTM (ABSciex) program that identifies proteins based on cumulative peptide scores, and generates Light:Heavy ratio scores based on intensity ratios of corresponding peptide peaks.
Protein quantitation
Within each experiment, proteins identified with L:H ratios were normalized using z-score analysis, described previously [13]. Briefly, all L:H ratios were converted to log2, and average ratios
and standard deviations were determined after removal of significant outliers. Each protein’s ratio was then converted to a z-score using the formula:
Expt 1
Expt 3 Expt 2
a)
b)
c)
884
525 132 182
605 90
658
Expt 1
Expt 3 Expt 2
1352
282 115 164
332 180
567
0 20 40 60 80 100 120 140 160 180 200
-18 -15 -12 -9 -6 -3 0 3 6 9 12 15 18
Protein Count
(log2 L:H - mean) / stdev (grouped nearest 0.1)
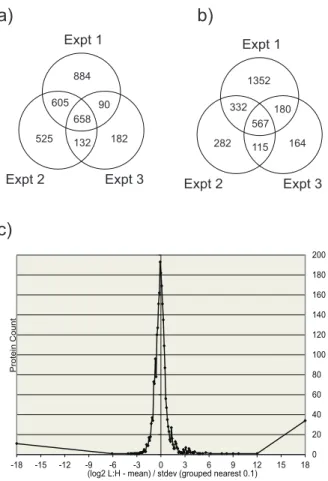
Figure 3. Identified protein analysis.Venn diagram summaries of the three separate T1L reovirus SILAC experiments at (a) 6hpi, when a total of 3076 unique proteins were identified and at (b) 24hpi where a total of 2992 unique proteins were identified. Overlapping numbers represent those proteins identified in more than one biological replicate (c) Population distribution represented by the log2 of L:H
ratios of identified proteins plotted against the protein counts. This population distribution is used to determine the z-scores indicating those proteins considered significantly up or down regulated. Most proteins are seen at a 1:1 ratio after infection, indicated by the peak of the population distribution indicated at 0. For clarity, only experiment 1 at 24hpi is shown, however population distributions were generated at both time points, for all biological replicates.
Table 1.HEK293 proteins increased.95% confidencea.
Accession HGNC Name
6h L:H ratiob
24h L:H ratiob
Proteins measured in.1 experiment (at a single time point)
34416 LTF Lactotransferrin 8.88 8.72
6013427 ALBU serum albumin precursor 5.85 5.02
17318569 K2C1 keratin 1 4.80 38.35
1683637 BAD Bcl-2 binding component 6 3.50 0.76
25058739 ALB ALB protein 3.00
9963783 Q9HBZ9 RNA helicase 2.71 2.51
4557325 APOE apolipoprotein E precursor 2.68 6.48
6563288 UBQL2 ubiquitin-like product Chap1/Dsk2 2.67 1.00
16553095 ASPC1 unnamed protein product 2.39 2.41
56204388 MEA1 male-enhanced antigen 2.27 0.88
20336350 HCD2 endoplasmic reticulum-associated amyloid beta peptide-binding protein 2.22 1.86
4885217 XPF excision repair cross-complementing rodent repair deficiency, complementation group 4
2.08
55959029 UBE2T ubiquitin conjugating enzyme 2.03 1.19
22671717 HBA2 hemoglobin alpha-2 2.02 3.58
55660909 SC23B Sec23 homolog B (S. cerevisiae) 2.00 1.21
29792115 SMAD3 SMAD, mothers against DPP homolog 3 (Drosophila) 1.99 2.01
48734878 Q6IPH7 RPL14 protein 1.97 1.85
7020506 UB2R2 unnamed protein product 1.96 1.08
4505571 SQSTM sequestosome 1 1.84 1.39
57208697 REPS1 RALBP1 associated Eps domain containing 1 1.77 1.70
14042287 NRBP unnamed protein product 1.74 1.02
4589628 PALLD KIAA0992 protein 1.73
55962212 CTBP2 C-terminal binding protein 2 1.72 0.72
55749758 DIP2B DIP2 disco-interacting protein 2 homolog B 1.64 1.36
5803123 PSMF1 proteasome inhibitor subunit 1 isoform 1 1.64 1.56
21961219 DNJB4 DnaJ (Hsp40) homolog, subfamily B, member 4 1.64 0.88
12654999 DPOA2 Polymerase (DNA directed), alpha 2 (70kD subunit) 1.63 0.94
13543689 SLD5 GINS complex subunit 4 (Sld5 homolog) 1.60
793843 RL29 ribosomal protein L29 1.57 1.67
3970842 AL1A2 RALDH2 1.57 1.36
56202415 STX12 syntaxin 12 1.54 1.18
28336 ACTB mutant beta-actin (beta’-actin) 1.53 1.46
56205198 SNAPN SNAP-associated protein 1.53 1.01
55962100 B1AN89 eukaryotic translation initiation factor 4 gamma, 3 1.51 0.94
13477351 CP080 Gene trap locus 3 (mouse) 1.50 0.95
54696534 ATPO ATP synthase, H+transporting, mitochondrial F1 complex, O subunit (oligomycin sensitivity conferring protein)
1.50 1.59
7705411 YTHDF2 YTH domain family, member 2 1.47 0.99
9623363 DPOE3 DNA polymerase epsilon p17 subunit 1.46
55962775 S10AD S100 calcium binding protein A13 1.38 1.34
7672784 HSP7E heat shock protein HSP60 1.37 1.75
7576229 VIME vimentin 1.35 0.99
21749793 Q8NB80 unnamed protein product 1.31 0.82
7705431 CCD72 coiled-coil domain containing 72 1.30
48146451 DBNL HIP-55 1.29 1.18
21750170 Q8NB11 unnamed protein product 1.28 1.29
55663125 SET SET nuclear oncogene 1.26 0.95
zscoreð Þs of b½ ~
Log2L=H b½ Average of ðlog2 of each member,a. . .:nÞ
Standard deviation of logð 2 of each member,a. . .:nÞ
where b represents a single protein in the dataset. The z-score measures standard deviation units (s) a ratio is from the mean. For example, a z-score of.1.960sor,21.960sindicates that it is outside the 95% confidence level, .2.567s or ,22.576s indicates 99% confidence, and.3.291sor,23.291sindicates 99.9% confidence.
DAVID analysis
Functional Annotation Tools. DAVID analysis was per-formed using lists of proteins up and down regulated previously generated from Protein Pilot analysis [24,25]. Proteins determined differentially regulated by statistical analysis were tabulated in Excel and their GI accession numbers were uploaded into DAVID for functional annotation tool analysis. DAVID analysis enabled enrichment of functional-related gene groups, cluster redundant annotation terms and visualization of BioCarta & KEGG pathway maps that may play a role in the dataset uploaded.
Ingenuity Pathway Analysis
Network Generation. Data sets derived from the Protein Pilot analysis, containing gene identifiers and corresponding expression values, were uploaded into the IngenuityH Systems application. Each gene identifier was mapped to its corresponding gene object in the Ingenuity Pathways Knowledge Base. A z-score cutoff of63.29,62.58 and61.96 (representing 99.9%, 99% and
95% confidence scores, respectively) was set to identify proteins whose expression was significantly differentially regulated. These proteins, called focus proteins, were overlaid onto a global molecular network developed from information contained in the Ingenuity Pathways Knowledge Base. Networks of these focus genes were then algorithmically generated based on their connectivity.
Functional Analysis of a Network. The Functional Analysis of a network identified the biological functions and/or diseases that were most significant to the genes in the network. The network genes associated with biological functions and/or diseases in the Ingenuity Pathways Knowledge Base were considered for the analysis. Fischer’s exact test was used to calculate a p-value determining the probability that each biological function and/or disease assigned to that network was due to chance alone.
Immunoblotting
Western blot analysis of infected HEK 293 cells was performed as described previously [13]. Briefly, at 6 and 24 hours post infection with T1L reovirus at MOI 5, unlabelled HEK293 cells were harvested similar to the cell preparation (above). Cytosolic proteins were resolved on 8 W66.5 H60.1 cm 10% SDS-PAGE gel at 120V for 70 min. Proteins were then transferred to a polyvinylidene difluoride (PVDF) membrane at 100V for 60 min, and the transfer was confirmed using Ponceau staining. The membranes were blocked using 5% skim milk in TBST and probed using various antibodies in 1% BSA in TBST. Primary antibodies were in-house rabbit anti-reovirus, rabbit anti-lacto-transferrin (Millipore, cat#07-685),a-ISG15 (Rockland, cat# 200-401-438), a-SCG2 (Abnova cat#PAB17107), a-hnRNPA1 (Cell Signaling, cat#8443), GAPDH (Cell Signaling, cat#2118), a
-Table 1.Cont.
Accession HGNC Name
6h L:H ratiob
24h L:H ratiob
6633995 SK2L2 KIAA0052 protein 1.16 2.13
6274552 STAT1 signal transducer and activator of transcription 1 isoform alpha 1.11 2.38
56203909 DDI2 DNA-damage inducible protein 2 (DDI2) 1.09 1.90
862457 ECHA enoyl-CoA hydratase/3-hydroxyacyl-CoA dehydrogenase alpha-subunit of trifunctional protein
1.04 1.81
34532659 Q6ZTT1 unnamed protein product 1.03 1.46
5738608 NFU1 HIRA-interacting protein HIRIP5 1.00 1.65
3287825 DC1L2 Cytoplasmic dynein 1 light intermediate chain 2 (Dynein light intermediate chain 2, cytosolic) (LIC53/55) (LIC-2)
0.93 1.56
31652283 ACO13 thioesterase superfamily member 2 0.87 1.65
31880783 PELO pelota homolog 0.77 1.40
18490917 SCG2 Secretogranin II (chromogranin C) 7.62
4731861 OAS3 29–59oligoadenylate synthetase 3 5.46
14550514 ISG15 ISG15 ubiquitin-like modifier 4.27
34192824 IFIT2 Interferon-induced protein with tetratricopeptide repeats 2 3.57
2653424 SHIP2 inositol polyphosphate 5-phosphatase 2.44
49574526 IFIT1 interferon-induced protein with tetratricopeptide repeats 1 2.21
47123412 Q6NSF2 RPLP0 protein 1.91
51476787 Q68D64 hypothetical protein 1.45
51476787 Q68D64 hypothetical protein 1.45
aProtein is included if at least half of the biologic z-score values are$1.960s(indicated by bolding) and there are no major disagreements between biological replicates. bL/H ratio refers to the geometric mean of all log
OAS3 (Abcam, cat#ab71780), a-IFIT2 (Abcam, cat#ab55837), and a-PTPN12 (Abcam cat#ab90641), and mouse anti-STAT1 (Cell Signaling, cat#9176) anda-BAD (Santa Cruz, cat#sc-8044). The secondary antibodies were the appropriate horseradish peroxidase (HRP)-conjugated rabbit mouse or goat
anti-rabbit (Cell Signaling, cat#7076 and cat#7074, respectively). Bands were detected by enhanced chemiluminescence using an Alpha Innotech FluorChemQ MultiImage III instrument.
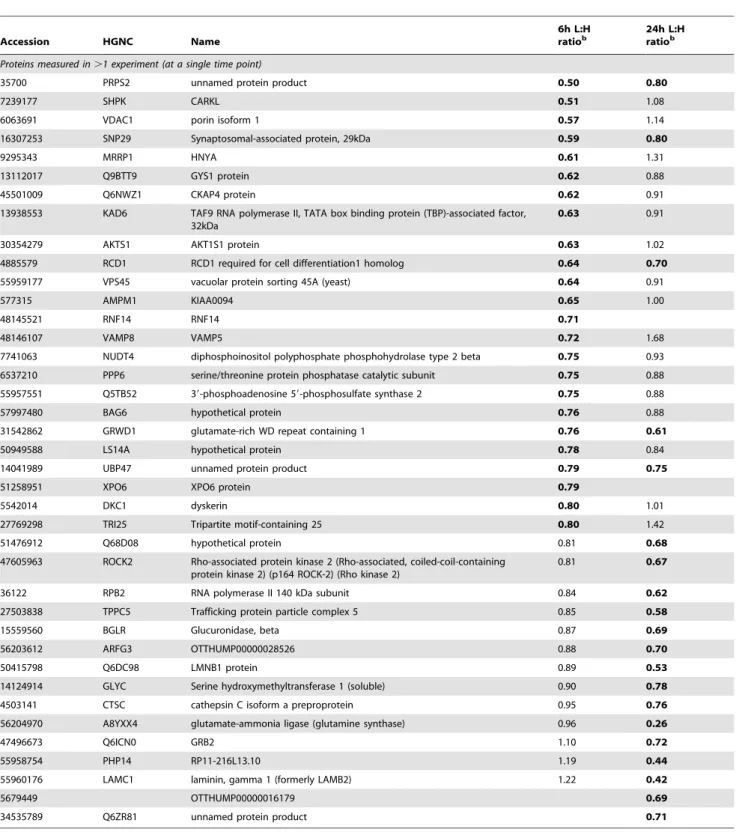
Table 2.HEK293 proteins decreased.95% confidencea.
Accession HGNC Name
6h L:H ratiob
24h L:H ratiob
Proteins measured in.1 experiment (at a single time point)
35700 PRPS2 unnamed protein product 0.50 0.80
7239177 SHPK CARKL 0.51 1.08
6063691 VDAC1 porin isoform 1 0.57 1.14
16307253 SNP29 Synaptosomal-associated protein, 29kDa 0.59 0.80
9295343 MRRP1 HNYA 0.61 1.31
13112017 Q9BTT9 GYS1 protein 0.62 0.88
45501009 Q6NWZ1 CKAP4 protein 0.62 0.91
13938553 KAD6 TAF9 RNA polymerase II, TATA box binding protein (TBP)-associated factor, 32kDa
0.63 0.91
30354279 AKTS1 AKT1S1 protein 0.63 1.02
4885579 RCD1 RCD1 required for cell differentiation1 homolog 0.64 0.70
55959177 VPS45 vacuolar protein sorting 45A (yeast) 0.64 0.91
577315 AMPM1 KIAA0094 0.65 1.00
48145521 RNF14 RNF14 0.71
48146107 VAMP8 VAMP5 0.72 1.68
7741063 NUDT4 diphosphoinositol polyphosphate phosphohydrolase type 2 beta 0.75 0.93
6537210 PPP6 serine/threonine protein phosphatase catalytic subunit 0.75 0.88
55957551 Q5TB52 39-phosphoadenosine 59-phosphosulfate synthase 2 0.75 0.88
57997480 BAG6 hypothetical protein 0.76 0.88
31542862 GRWD1 glutamate-rich WD repeat containing 1 0.76 0.61
50949588 LS14A hypothetical protein 0.78 0.84
14041989 UBP47 unnamed protein product 0.79 0.75
51258951 XPO6 XPO6 protein 0.79
5542014 DKC1 dyskerin 0.80 1.01
27769298 TRI25 Tripartite motif-containing 25 0.80 1.42
51476912 Q68D08 hypothetical protein 0.81 0.68
47605963 ROCK2 Rho-associated protein kinase 2 (Rho-associated, coiled-coil-containing protein kinase 2) (p164 ROCK-2) (Rho kinase 2)
0.81 0.67
36122 RPB2 RNA polymerase II 140 kDa subunit 0.84 0.62
27503838 TPPC5 Trafficking protein particle complex 5 0.85 0.58
15559560 BGLR Glucuronidase, beta 0.87 0.69
56203612 ARFG3 OTTHUMP00000028526 0.88 0.70
50415798 Q6DC98 LMNB1 protein 0.89 0.53
14124914 GLYC Serine hydroxymethyltransferase 1 (soluble) 0.90 0.78
4503141 CTSC cathepsin C isoform a preproprotein 0.95 0.76
56204970 A8YXX4 glutamate-ammonia ligase (glutamine synthase) 0.96 0.26
47496673 Q6ICN0 GRB2 1.10 0.72
55958754 PHP14 RP11-216L13.10 1.19 0.44
55960176 LAMC1 laminin, gamma 1 (formerly LAMB2) 1.22 0.42
5679449 OTTHUMP00000016179 0.69
34535789 Q6ZR81 unnamed protein product 0.71
aProtein is included if at least half of the biologic z-score values are
$1.960s(indicated by bolding) and there are no major disagreements between biological replicates. bL/H ratio refers to the geometric mean of all log2L/H values for each given gi number, expressed as relative protein quantity in infected cultures.
M
6
24
M
6
24
Reovirus
GAPDH
LTF
ISG15
OAS3
SCG2
hnRNPA1
IFIT2
BAD
PTPN12
STAT1
a)
b)
HGNC
GAPDH
LTF
ISG15
OAS3
SCG2
hnRNPA1
IFIT2
BAD
PTPN12
STAT1
1
2
3
Avg
WB
Experiment
SILAC L:H ratio
6hpi
1
2
3
Avg
WB
Experiment
SILAC L:H ratio
24hpi
1.11 0.92 1.24 1.09 1.02 1.09 1.02 1.16 1.09 0.98
8.88 ND*
*ND: not detected
ND 8.88 1.74 22.0 4.20 7.19 11.13 1.89
ND ND ND ND 2.45 7.24 4.06 2.66 4.65 16.48
ND ND ND ND 0.76 3.96 7.51 ND 5.74 10.59
ND ND ND ND 0.51 7.08 8.19 ND 7.64 1.96
1.11 0.95 0.94 1.00 1.36 1.21 1.11 0.83 1.05 1.02
ND ND ND ND 0.95 4.22 ND 3.02 3.62 1.28
2.71 4.52 ND 3.61 0.83 0.76 ND ND 0.76 0.54
0.40 ND ND 0.40 0.78 0.29 ND ND 0.29 0.38
1.31 0.94 ND 1.11 1.24 2.16 1.65 4.14 2.38 2.73
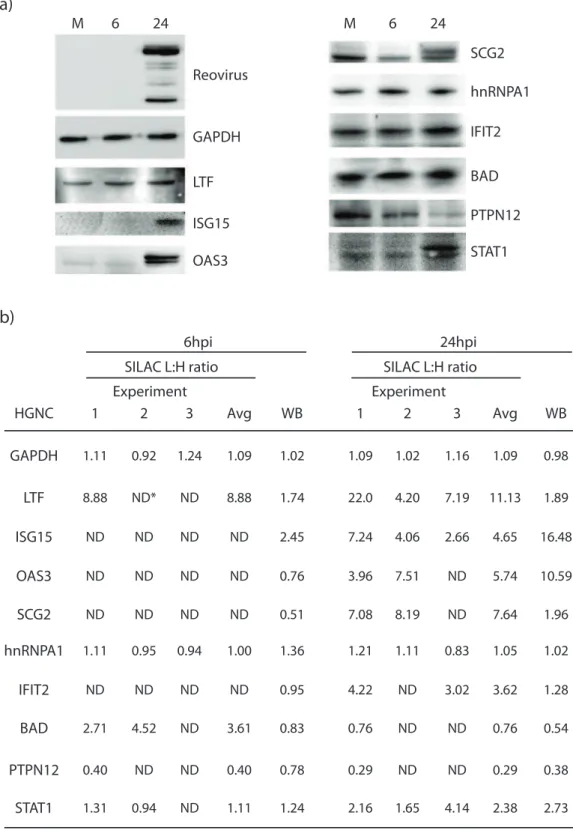
Figure 4. Validation of SILAC-determined protein abundances. (a) Western blot analyses of selected proteins. Mock-infected and T1L-infected cells were harvested at 24hpi, lysed with 0.5% NP-40, and 20–80mg of each cytosolic fraction resolved in each lane of 1066.560.1 cm 10%
SDS-mini-PAGE. Proteins were transferred to PVDF membranes, blocked, probed with various indicated primary antibodies, developed with appropriate secondary antibodies, and visualized with an Alpha Innotech FluorChemQ MultiImage III instrument. (b) Densitometry analysis comparison to SILAC L:H average ratios for the ten different host proteins in (a). Most of the Western blot results correlated to the regulation of the proteins observed in SILAC (whether or not they are up or down regulated). All of the proteins tested by Western blot were also identified at 24hpi in SILAC and were therefore used for confirmation. Some of these proteins were also identified at 6hpi in SILAC and these were used for WB comparison. (GAPDH – glyceraldehyde-3-phosphate dehydrogenase, LTF – lactotransferrin, ISG15 – interferon-stimulated protein 15kDa, OAS3 – 29– 59oligoadenylate synthetase 3, SCG2 – secretogranin II, hnRNPA1 – heterogeneous nuclear ribonucleoprotein A1, IFIT2 – Interferon-induced protein with tetratricopeptide repeats 2, BAD – Bcl-2 binding component 6, PTPN12 – protein tyrosine phosphatase, non-receptor type 12, STAT1 – signal transducer and activator of transcription 1).
a)
b)
Gene Expression, Cardiovascular Disease, Developmental Disorder Cell-To-Cell Signaling and Interacon, Cellular Funcon and Maintenance Genec Disorder DNA Replicaon, Recombinaon, and Repair, Post-Translaonal Modificaon Protein Degradaon Auditory Disease, Genec Disorder, Neurological Disease Infecous Disease, Cancer, Renal and Urological Disease RNA Post-Transcriponal Modificaon, Cellular Assembly and
Organizaon, Cell Death Connecve Tissue Disorders, Genec Disorder, Cell Cycle Cellular Assembly and Organizaon, Cell Cycle, Cancer Cellular Assembly and Organizaon, Cellular Movement, Cell Morphology Cell Cycle, Cell-To-Cell Signaling and Interacon, Cellular Movement Developmental Disorder, Neurological Disease, Cellular Growth and Proliferaon Infecous Disease, Inflammatory Response, Gene Expression DNA Replicaon, Recombinaon, and Repair, Gene Expression, Cell Cycle Post-Translaonal Modificaon, Organismal Injury and Abnormalies Embryonic Development Molecular Transport, RNA Trafficking, Lipid Metabolism
0 5 10 15 20 25
Network Score (based on number of molecules idenfied in each network)
Genec Disorder, Neurological Disease, Cellular Assembly and Organizaon Genec Disorder, Skeletal and Muscular Disorders, Connecve Tissue Disorders Cellular Assembly and Organizaon, Hair and Skin Development Cellular Assembly and Organizaon, Infecous Disease, Organismal Development Nucleic Acid Metabolism, Small Molecule Biochemistry, DNA Replicaon, Recombinaon Repair Infecous Disease, Cellular Assembly and Organizaon, Developmental Disorder RNA Damage and Repair, RNA Post-Transcriponal Modificaon, Organismal Survival Gene Expression, Genec Disorder, Neurological Disease Infecous Disease, Cancer, Renal and Urological Disease Cell Cycle, Embryonic Development, Tissue Development Cellular Development, Cellular Assembly and Organizaon Cell-To-Cell Signaling and Interacon, Cellular Funcon and Maintenance Cellular Development, Embryonic Development, Cancer Cell-To-Cell Signaling and Interacon, Drug Metabolism, Inflammatory Response Cell Morphology, Cellular Assembly and Organizaon, Cellular Compromise Molecular Transport, RNA Trafficking, Cell Cycle Cell Morphology, Cellular Assembly and Organizaon, Cellular Movement Gene Expression, RNA Post-Transcriponal Modificaon, Infecous Disease Cardiovascular System Development and Funcon, Cancer Carbohydrate Metabolism, Molecular Transport, Small Molecule Biochemistry Cellular Development, Cell Death, Angen Presentaon Gene Expression, Cardiovascular System Development and Funcon Cell Death, Cellular Growth and Proliferaon, Cellular Development Cell Death, Organ Morphology, Lymphoid Tissue Structure and Development Metabolic Disease, Cancer, Cellular Growth and Proliferaon
0 2 4 6 8 10 12 14 16 18
Network Score (based on number of molecules idenfied in each network)
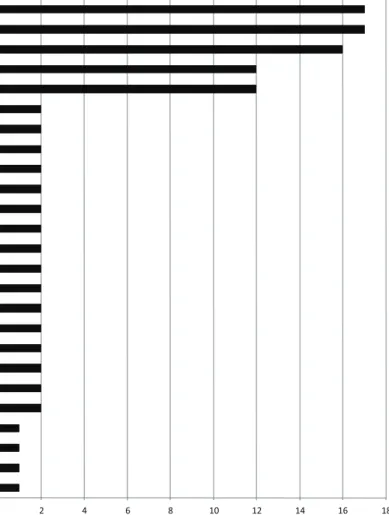
Figure 5. Top network functions generated using Ingenuity protein analysis for HEK293 cells infected with T1L reovirus at (a) 6hpi and (b) 24hpi.Graphs represent host cell functions with highest score (x-axis) based on the number of differentially regulated proteins observed in that network. The higher the score, the greater the number of proteins differentially regulated in that particular function network.
Results
Reovirus successfully infects HEK293 cells
To determine which virus subtype and cell line to use for proteomic analyses, we performed an initial growth assay of both MRV strains T1L and T3D in five different cell lines; mouse L929 which are usually used for reovirus work, and in human A549, HEK293, CaCo2and Hela cells (Figure 1a&b). The cell lines that
generated the highest virus titers were L929 and HEK293. Reovirus infection in L929 cells is well characterized [30]. However, reovirus growth has also been shown to be dependent on MOI and on cell type [31,32]. We therefore performed a more extensive growth analysis of both T1L and T3D in the L929 and 293 cells (Figure 1c&d). This assay showed virus titers of both strains began to increase at 12 hours post infection (hpi) in both cell types, that growth was exponential during the next 6– 12 hours, and that both strain’s titers continued to increase up to about 48 hpi and then plateau after this time point.
Cell viability was also measured by Trypan Blue exclusion in both HEK293 (Figure 1e) and L929 cells (Figure 1f). The percentage of dead HEK293 cells continually increased from about 15hpi to 72hpi, and reached approximately 65% mortality irrespective of virus types. This is a lower level of cell death compared to the L929 cells, which reached more than 90% mortality by 72hpi, indicating HEK293 cells are either more resistant to reovirus induced apoptosis or the cells are slower to respond to reovirus infection.
Because HEK293 cells are human and therefore potentially more relevant, we decided to use these cell lines in subsequent experiments. Many reovirus studies have been performed with both T1L and T3D, and although most oncolytic studies have focused on strain T3D, a recent study indicates that T1L may also have oncolytic relevance [17]. Both virus strains generated similar final titers by 48 hpi, which is within the time frame we elected for SILAC analysis. Thus, with the potential to gain new insight in T1L infections, and because T1L appeared to grow efficiently in 293 cells, we decided to use this strain for subsequent analyses.
Cytopathic effects in HEK293 cells were examined microscop-ically (Figure 2a). Little CPE was apparent by 24hpi, and only in cultures infected with the more pathogenic T3D strain. CPE was not visible in the T1L-infected cultures until 36hpi, and CPE was strongly apparent in both infected cultures by 48hpi. These results are comparable to those obtained by Trypan Blue exclusion, although Trypan Blue exclusion appeared to show some CPE occurring slightly earlier than observed microscopically. Taking into account the growth curves and cell viability of the HEK 293 cells when infected with the T1L reovirus strain, we decided to perform our SILAC proteomic analysis at an early time of infection (6hpi) before the onset of CPE and virus growth, and a later time point (24hpi) when the cells show minimal CPE and are producing a large amount of virus. These two time points should give a good indication of what is going on in the cell when the virus is first entering and replicating, then later on, when the virus is being packaged and released.
To ensure that an MOI of 5 T1L would infect the majority of HEK 293 cells, and that virus proteins were being expressed to affect host processes by the later chosen time point, immunoflu-orescence microscopy was performed at 8, 12, 18 and 24 hpi. AlmostOof the cells demonstrated infection by 12 hpi and.99%
of the cells showed virus infection by 24 hpi (Figure 2b). Previous studies indicated that increasing the MOI exponentially causes virus replication to start earlier, but the same proportion of cells become infected [30]. For our proteomic analyses, we used an MOI of 5 to ensure that by 24hpi the vast majority of cells are infected and also allowed a greater window of opportunity to observe the earlier infection process before virus production occurs (6hpi).
Protein identification
We quantitatively examined protein alterations in HEK293 cells at early (6 hpi) and late (24hpi) times after infection with MRV T1L. We performed three separate biological replicates of the infection for both time points. 2237, 1920 and 1062 proteins were identified in three experiments at the 6 h time point, with a total of 3076 unique identified proteins (Figure 3a). Of these, 1485 (48.3%) were identified in two or more experiments. After 24 hours of infection, 2431, 1296 and 1026 proteins were identified, with a total of 2992 unique species and 1194 (39.9%) found in two or more replicates (Figure 3b). More proteins were identified in the first experiment (at both time points) because, as indicated earlier, of greater sample loading. Although lower sample loading led to a decrease in the numbers of proteins identified in the second and third replicates, it had no influence on the L:H ratios that were observed.
Protein quantitation and statistical analysis
To facilitate inter-experiment comparisons, each protein’s L:H ratio was converted into log2space. These log ratios were plotted
in a population distribution graph and used to convert every L:H ratio into a z-score that measures how far each particular protein’s L:H ratio lies in relation to the population mean and standard deviation. A representation of this for experiment 1 at 24hpi is shown in Figure 3c. Other population distributions were similar (data not shown). The population distribution-based z-scores enable the direct comparison of proteins from different experi-mental runs. Different confidence level cutoffs were applied to the data by z-score analysis to indicate which proteins were considered significantly differentially regulated. We used 95%, 99% and 99.9% cutoffs, which correspond to z-scores of61.96,62.8 and
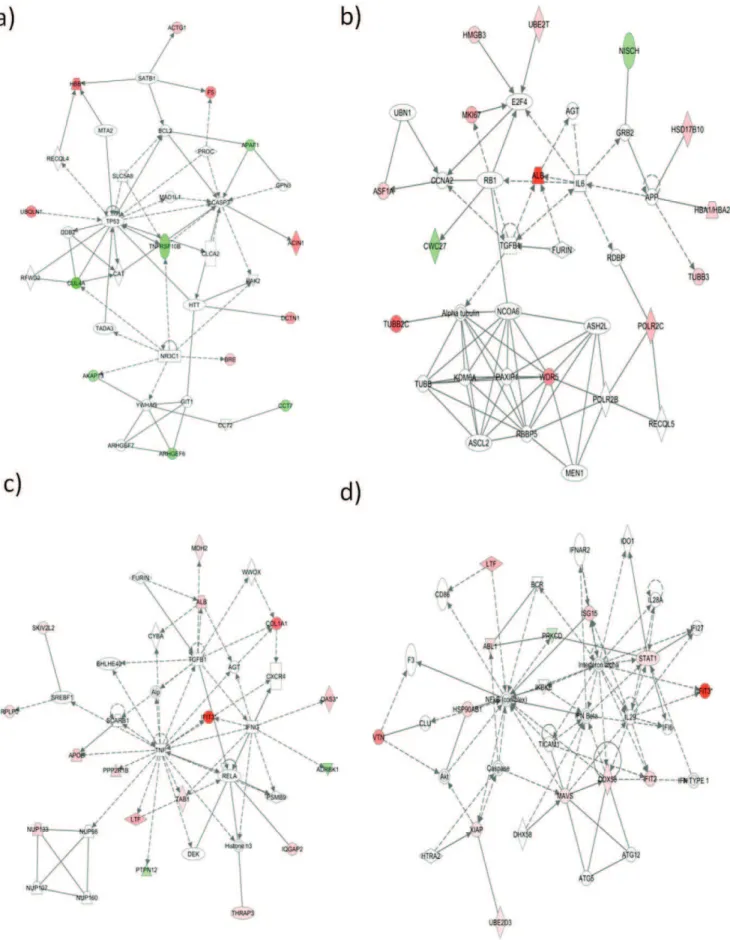
63.3, respectively. 200 proteins were observed differentially regulated in at least one experiment at 6 hpi (132 up regulated and 68 down regulated) at 95% confidence level, and 153 proteins were differentially regulated at 24hpi (104 up and 49 down regulated). Some differentially regulated proteins were observed in more than one experiment, whereas some were only identified once. Up-regulated or down-regulated proteins found in more than one experiment are listed in Table 1 and Table 2, respectively, with their corresponding average L:H score. A complete list of all differentially regulated proteins identified, including those observed in only one experiment, as well as the z-scores determined from each experiment, and how many independent screening rounds each protein ratio represents, are indicated in Supplementary Tables S1 and S2. Of those protein identified in all three experiments, ISG15, lactotransferrin and serum albumin were observed significantly up-regulated in all three experiments at 24hpi. We have used label swapping in similar experiments with other virus-cell systems (Coombs, submitted). In experiments in which infected samples are L-represent down-regulation. (a) Network 1, 6hpi; top functions include cell death (b) Network 2, 6hpi; top functions include cellular growth and proliferation. (c) Network 1, 24hpi; top functions include molecular transport. (d) Network 4, 24hpi; top functions include infectious disease and inflammatory response.
labeled, as here, albumin keratins, and lactotransferrin are also consistently found highly up-regulated; however, in reciprocal labelling, they appear to be highly down-regulated. In the current study, these proteins probably represent contaminants because they are consistently up-regulated after infection (a large L:H ratio) because they are naturally found in the environment in the light isotopic form, which, in the current study, corresponds to the infected sample. Because it may have antiviral properties, a western blot was performed on lactotransferrin (below) to detect whether the up-regulation observed was true or due to contam-ination. Other significantly up-regulated proteins include STAT1, identified in all three experiments at 24hpi, significantly regulated in two of the three experiments, and slightly up-regulated in the third. There were also numerous proteins, such as SCG2, IFIT2, OAS3 and BAD, that were identified in only two experiments but were significantly up-regulated in both experi-ments. In our study, proteins are considered up or down regulated if at least half of the biologic z-score values are$1.960sand there were no major disagreements between biological replicates. More focus was placed on those proteins identified in more than one experiment; however, proteins identified in only one experiment were also used to analyze infection-induced alterations in host pathways. Numerous proteins involved in the apoptotic pathway were differentially regulated, correlating with previous findings [21,22] as well as the virus’ observed cytopathic effect.
Validation of SILAC results by Western Blotting
Several of the SILAC-identified up-regulated and non-regulated proteins were examined by Western blotting (Figure 4) and most Western blot results confirmed the trends of the SILAC-determined regulation status, including LTF, ISG15, OAS3, SCG2, PTPN12 and STAT1. GAPDH, which is usually used as a loading control in Western blots, was seen at a 1:1 infected to mock ratio in all three experiments at both the 6 and 24 hour infection time points, and had SILAC ratios of 1.0960.11 (Figure 4b). HnRNPA1, another protein shown by SILAC not to be differentially regulated, with ratios of 1.0260.14, was seen in Western blot with ratios of 1.36 and 1.02 at 6 and 24hpi, respectively. We also used a reovirus antibody to confirm cell infection, which showed up strongly by the later time point. Lactotransferrin was slightly up-regulated at both 6 and 24hpi (1.74 and 1.89, respectively) using Western blot, but SILAC suggested a large up-regulation (8.88 and 11.13, respectively); this may indicate FBS contamination. IFIT2 was indicated in the SILAC experiments to be up-regulated at 24hpi but Western blot suggested a ratio of 1.28. BAD was observed up-regulated .2.5 fold at 6hpi in SILAC, but was only seen at a 0.83 ratio in WB. These few apparent SILAC:WB discrepancies may have been caused by inherent differences in sampling (partially degraded proteins that would not have been measured by Western blot but their peptides would have been detected by MS) or by inherent differences in the different methods’ levels of sensitivity.
Functional and pathway analyses
Lists of proteins observed to be either up- or down-regulated after averaging z-scores from all three biological replicates were uploaded into the DAVID analysis web-based tool [24] (http:// david.abcc.ncifcrf.gov/home.jsp) and functional categories were
obtained from both GO and Panther terms for both time points. We obtained metabolic and biological functions that are enriched for each list of proteins uploaded at 95, 99, and 99.9% confidence cutoffs respectively. Supplementary Figure S1 shows a list of significantly altered GO biological processes and molecular functions that are plotted against their respective fold enrichment values for each time point. At 6hpi, the top functions that were most affected by the differentially regulated proteins included transforming growth factorb-receptor, activation of pro-apoptotic gene products, cis-trans isomerase activity, late endosome functions and serine protease inhibitor processes (Sup Fig. S1 A, C). At 24hpi, top biological processes included positive regulation of interferon-alpha production, defense response to virus by host, interferon-mediated immunity and procollagen-lysine 5-dioxygen-ase activity (Sup Fig. S1 B, D). Further analyses were performed using the 95% cutoff, since the more stringent cutoffs identified fewer pathways with no apparent alterations in the top functional networks identified.
Proteins were also analyzed by using Ingenuity Pathways Analysis (IngenuityH Systems, www.ingenuity.com) to generate metabolic and canonical pathways and interconnecting proteins. The top network functions for each of the three separate experiments at 95% z-score cutoff were inflammatory disease, cellular development and tissue development, respectively. To take into account the diversity in identified proteins among the three separate biological replicates, average z-scores were used for further analysis (Figure 5). The top network functions identified as having the most differentially regulated proteins at 6hpi were cell death, cellular growth and proliferation, antigen presentation and gene expression (Figure 6 a, b). A similar analysis was performed for the 24hpi time point. The top networks generated for each of the separate biological experiments were molecular transport, DNA replication and repair, post translational modification and inflammatory response and infectious disease (Figure 6 c, d). This indicates that the host cell proteome changes, signifying host-virus interactions are continuously shifting depending on the stage of the virus life cycle.
Metabolic and cellular canonical signaling pathways were also used for analysis of uploaded datasets. Activation of IRF by cytosolic pattern recognition receptors is one such signaling pathway that was significantly altered by 24hpi. This pathway had an enrichment p-value of 3.761025based on the average z-score analysis at 24hpi. Figure 7 shows this pathway with overlaid expression values from the first biological replicate, which was representative of other replicates for this particular pathway. A number of proteins were identified by SILAC, and many were up-regulated, including RIG-1, ISG-15, MAVS (also known as interferon-b promoter stimulator), STAT1 and ISG-54 (also known as IFIT2). The proteins seen up-regulated in this canonical pathway are those having a role in the early phase of virus infection, functioning in antiviral innate immunity.
Discussion
SILAC is an effective way to observe differences in the relative protein concentrations of thousands of proteins that may differ in expression levels between two separate experimental cell cultures. Our study quantified changes in the physiological levels of several
Figure 7. Canonical pathway ‘‘Activation of IRF by cytosolic pattern recognition receptors’’ that was identified as significantly (p-value of 3.761025) altered after 24 h of T1L reovirus infection in HEK293 cells.Protein regulation expression patterns overlaid from first
biological replicate. Red indicates up-regulation, grey represents proteins not changed in abundance after infection and white represents molecules not identified in SILAC experiment but are part of the known canonical pathway.
thousand cellular proteins during T1L infection. We analyzed all data from all three experiments, both separately and in combination, by IPA and DAVID analysis to identify a large list of cell metabolic and biological pathways that were affected by MRV T1L infection. This approach was also used to confirm inter-experiment reproducibility. Comparing the top network (functions in molecular transport, RNA trafficking and lipid metabolism) generated after 24hpi from one experiment to another showed a significant up regulation of the whole network, with numerous proteins up regulated in more than one experiment (Supplemental Figure S2). By studying the difference in networks generated from multiple time points, we examined how the host cell’s response to infection changed during the virus life cycle. At the earlier time point, cell death and proliferation as well as antigen presentation are seen as major pathways affected which correlated with DAVID analysis that indicated apoptosis was influenced. At 24hpi, molecular transport, DNA replication and repair, post-translational modification and inflammatory response are more prominently affected, correlating with positive regulation of interferon-alpha production and defense response to virus identified with DAVID. In general, the host response to viral infection produced more up regulated proteins than down regulated ones. Detection of more up regulated proteins than down regulated ones correlates with a previous genomic assay performed on T1L in HEK293 cells that observed this same trend in differential regulation of mRNA [21].
Comparisons to previous findings
Differentially regulated apoptosis and DNA repair pathway mRNA is observed after infection with T1L and T3D by 24hpi [21]. We also observed differentially regulated proteins in the apoptotic pathway after 6 h and DNA repair after 24 h. Previous studies reported differences in the genomic response to reovirus T3D for proteins such as STAT-1, ISG-type and heat shock proteins [21,23,33,34] and we also observed differential regulation of these types of proteins in our assessment of T1L infection. A proteomic study using four reovirus strains, including T1L, T3D and reassortants identified heat shock proteins, interferon-induced proteins and serine-threonine protein phosphatase as regulated in murine myocytes [23]. We also found the hsp and INF-induced proteins were up-regulated and serine-threonine protein phospha-tase protein was down-regulated in our study.
Known canonical pathways were also examined and activation of IRF by cytosolic pattern recognition receptors pathway was shown to be significantly altered (p value 3.761025) after 24 h indicating this pathway is important in reovirus infection. Up-regulated proteins in this pathway are RIG-1, ISG15, MAVS, STAT1 and ISG-54 (also known as IFIT2). ISG15 has not previously been identified as affected by MRV infections, but has been identified in numerous other viral infections [35,36]. As well, numerous other ISG-like proteins have been observed for reovirus [34]. ISG15 plays an important role in antiviral response, and is strongly induced by the type 1 interferon system [37]. In particular, ISG15 production is mediated by the JAK/STAT pathway. IFIT2 RNA expression is induced following infection with MRV strain T3D [34,38]. Our study showed that the IFIT2 protein was up-regulated following infection with T1L, which may indicate that IFIT2 RNA expression is also induced after T1L infection. IFIT2 is part of a family of proteins that are normally not present in the cell, and are strongly expressed by stimuli such as viral infections. These proteins mediate numerous cell pathways involved in viral functions such as replication, dsRNA signaling, and translational initiation [39]. STAT1, up-regulated in our study, is a commonly activated antiviral protein induced by many
viruses, including MRV serotype 3 strain Abney (T3A) [36,40]. This activation is accomplished by the phosphorylation of STAT1. RIG-1 and MAVS (also known as interferon-b promoter stimulator 1) are required for IRF-3 activation and apoptosis induction in MRV strain type 3 Dearing infections, where rapid apoptosis in cardiac myocytes may play a protective role in infected cells by prohibiting virus spread [38].
Numerous proteins involved in apoptosis and oncolysis were differentially regulated
In addition to RIG-1 and MAVS, numerous other proteins involved in apoptosis were identified as differentially regulated. A major hub at 6hpi in network 1 (Figure 6a) is the tumor suppressor protein p53, which plays an important role in either the regulation of cell metabolism or apoptosis depending on the stress level of a cell [41]. As indicated earlier, reoviruses are currently being explored as oncolytic therapy because the virus preferentially replicates in cells with abnormal Ras-signaling pathways and induces apoptosis significantly more in these cells [42]. However, the possible role of MRV-induced p53-mediated oncolysis is only partially understood [42]. All reovirus types show oncolytic properties but most work has been performed on MRV strain T3D [17–20,43]. There are differences in the pathogenesis of the different strains of MRV. These differences may give insight into mechanisms of disease as well as oncolytic activity, if different strains are studied. Although p53 itself was not identified in our SILAC analysis, pathway analysis showed a significant interaction network involving this protein. The protein identified as TNFRSF10B, also known as DR5, interacts with p53 to induce apoptosis [44]. DR5 is a component of TRAIL-mediated apoptosis, and is required for reovirus-induced apoptosis in HEK293 cells [45]. TRAIL-mediated apoptosis is marked by an increase in cell surface DR5 expression, peaking at 24hpi [45]. We found DR5 was down-regulated at 6hpi, indicating either a delay in apoptosis, or a change in cell localization out of the cytosol. Two other proteins that interact with p53 are ubiquilin 1 (UBQLN1) and cullin 4A (CUL4A), which were up-regulated and down-regulated, respectively. In HeLa cells, ubiquilin 1 decreases degradation of p53 [46] and cullin 4A increases degradation of p53 in HEK293 cells [47], therefore the combined effect in T1L infection indicates that p53 is being stabilized.
Another hub at 6hpi in network 2 (Figure 6b) is of interest with respect to MRV and cancer therapy. E2F transcription factor 4 normally functions in cell cycle checkpoints, specifically important for entering mitosis. When DNA damage occurs, E2F4 can prevent mitotic entry by down-regulating many targets inducing cell cycle arrest [48]. This protein plays a role in other viral diseases such as SIV encephalitis [49] and is a target of virus protein interactions in Epstein-Barr infections [50]. Although E2F4 itself was not identified in our SILAC results, network analysis illustrated that three proteins recently shown to bind E2F4 [51], namely HMGB3, UBE2T and MKI67, were all up regulated at 6hpi. All three proteins have oncogenic properties [52,53] and might be of interest concerning the therapeutic use of reoviruses in cancer treatment studies.
SILAC identifies potentially novel important host regulatory proteins
interact with TNF, namely APOE, PPP2R1B, LTF, PTPN12, TAB1 and IFIT3. We are not aware of any of these proteins being previously associated with MRV infections. However, all except PTPN12 are associated with other viral infections. Lactotransfer-rin/lactoferrin (LTF) and IFIT3, both induced by TNF and up-regulated by reovirus at 24hpi, function in antiviral activities [54,55]. Apopoliprotein E (APOE) is another mulitifunctional protein that has different effects on virus infection depending on the virus. For example, APOE (isoform 4) is protective against some infections, such as chronic hepatitis C, but allows faster disease progression for HIV, and worse disease symptoms for herpes simplex latencies [56]. Conversely, APOE is essential for initial HCV infectivity [57]. TNF alpha also increases the expression of protein phosphatase 2 (PPP2R1B), which is part of a highly regulated phosphatase family functioning in multiple intracellular pathways, that also happen to be widely targeted by numerous viruses [58]. TAB1, when bound to TAK1, is activated by TNF alpha, and related to the JNK pathway [59,60]. One of the major roles of TAK1 is to mediate intracellular actions of proinflammatory cytokines [60]. The only protein identified in the TNF alpha hub that was down-regulated, namely PTPN12, is also the only protein that has not yet been reported in any other viral infections to date. Protein tyrosine phosphatases, of which PTPN12 is a member, regulate numerous cellular functions by selective dephosporylation, and dysregulation of these proteins is associated with many diseases [61]. PTPN12 in particular has been recently shown as a tumor suppressor [62,63]. Because this protein was down-regulated at 24 hpi by reovirus, it may be of particular interest in the oncolytic properties of reoviruses currently being studied. OAS3, identified in Network 1 at 24hpi, may also have an important role in T1L infection, since it has antiviral properties in other viral infections, such as dengue, tick-borne encephalitis and chikungunya virus [64,65].
In conclusion, we have used SILAC to identify a number of additional novel candidate proteins, more focused study of which should provide greater understanding of MRV-induced patho-genesis as well as a better understanding of how to use this virus as a more effective research tool.
Supporting Information
Figure S1 DAVID analysis of up (a, b) or down regulated (c, d) proteins using average z-scores from all three biological replicates. Metabolic and biological functions are shown that are enriched from the differentially regulated protein lists at 95, 99, and 99.9% confidence cutoffs (indicated by blue, red and green bars,
respectively). At 6hpi (a, c) top functions included transforming growth factor b-receptor, activation of pro-apoptotic gene products, cis-trans isomerase activity, late endosome functions and serine protease inhibitor processes. At 24hpi (b, d) top biological processes included positive regulation of alpha production, defense response to virus by host, interferon-mediated immunity and procollagen-lysine 5-dioxygenase activity. (TIF)
Figure S2 Inter-experiment reproducibility of 95% confidence IPA network analyses. Each of the three biologic replicates of the top 24hpi network; molecular transport, RNA trafficking and lipid metabolism, are depicted (a, b, c). Numerous proteins are up regulated in more than one replicate.
(TIF)
Table S1 Table showing all host proteins observed as up-regulated (at 95% confidence) after infection with T1L reovirus at both 6 and 24 hpi. Proteins at the top of the lists are those identified more than one time; proteins in the bottom half are those identified only once. Table shows the individual protein z-scores found for each of the three biological replicates, as well as the average L:H ratios for all three experiments. A protein is included in this table if at least half of the biologic z-score values are$1.960s(indicated by bolding; at least 95% confidence score) and there are no major disagreements between biological replicates.
(XLS)
Table S2 Table showing all host proteins observed as down-regulated (at 95% confidence) after infection with T1L reovirus for both 6 and 24 hpi. Proteins at the top of the lists are those identified more than one time; proteins in the bottom half are those identified only once. Table shows the individual protein z-scores found for each of the three biological replicates, as well as the average L:H ratios for all three experiments. A protein is included in this table if at least half of the biologic z-score values are$1.960s(indicated by bolding; at least 95% confidence score) and there are no major disagreements between biological replicates.
(XLS)
Author Contributions
Conceived and designed the experiments: ARB JAW AS KMC. Performed the experiments: ARB. Analyzed the data: ARB JPC OK JAW AS KMC. Contributed reagents/materials/analysis tools: JPC OK. Wrote the paper: ARB JPC OK JAW AS KMC.
References
1. Clarke P, Tyler KL (2003) Reovirus-induced apoptosis: A minireview. Apoptosis 8: 141–150.
2. Tan SL, Ganji G, Paeper B, Proll S, Katze MG (2007) Systems biology and the host response to viral infection. Nat Biotechnol 25: 1383–1389.
3. Lang QL, Zhou XC, Zhang XL, Drabek R, Zuo ZX, et al. (2011) Microarray-based identification of tomato microRNAs and time course analysis of their response to Cucumber mosaic virus infection. J Zhejiang Univ Sci B 12: 116– 125.
4. Salgado M, Lopez-Romero P, Callejas S, Lopez M, Labarga P, et al. (2011) Characterization of host genetic expression patterns in HIV-infected individuals with divergent disease progression. Virology 411: 103–112.
5. Nesvizhskii AI, Aebersold R (2005) Interpretation of shotgun proteomic data: the protein inference problem. Mol Cell Proteomics 4: 1419–1440.
6. Tian Q, Stepaniants SB, Mao M, Weng L, Feetham MC, et al. (2004) Integrated genomic and proteomic analyses of gene expression in Mammalian cells. Mol Cell Proteomics 3: 960–969.
7. Aggarwal K, Choe LH, Lee KH (2006) Shotgun proteomics using the iTRAQ isobaric tags. Brief Funct Genomic Proteomic 5: 112–120.
8. Yan W, Lee H, Yi EC, Reiss D, Shannon P, et al. (2004) System-based proteomic analysis of the interferon response in human liver cells. Genome Biol 5: R54.
9. Ong SE, Blagoev B, Kratchmarova I, Kristensen DB, Steen H, et al. (2002) Stable isotope labeling by amino acids in cell culture, SILAC, as a simple and accurate approach to expression proteomics. Mol Cell Proteomics 1: 376–386. 10. Coombs KM (2011) Quantitative proteomics of complex mixtures. Expert Rev
Proteomics 8: 659–677.
11. Vogels MW, van Balkom BW, Kaloyanova DV, Batenburg JJ, Heck AJ, et al. (2011) Identification of host factors involved in coronavirus replication by quantitative proteomics analysis. Proteomics 11: 64–80.
12. Munday DC, Hiscox JA, Barr JN (2010) Quantitative proteomic analysis of A549 cells infected with human respiratory syncytial virus subgroup B using SILAC coupled to LC-MS/MS. Proteomics 10: 4320–4334.
13. Coombs KM, Berard A, Xu W, Krokhin O, Meng X, et al. (2010) Quantitative proteomic analyses of influenza virus-infected cultured human lung cells. J Virol 84: 10888–10906.
14. Mertens P (2004) The dsRNA viruses. Virus Res 101: 3–13.
15. Coombs KM (2006) Reovirus structure and morphogenesis. Curr Top Microbiol Immunol 309: 117–167.
17. Alloussi SH, Alkassar M, Urbschat S, Graf N, Gartner B (2011) All reovirus subtypes show oncolytic potential in primary cells of human high-grade glioma. Oncol Rep 26: 645–649.
18. Thirukkumaran CM, Nodwell MJ, Hirasawa K, Shi ZQ, Diaz R, et al. (2010) Oncolytic viral therapy for prostate cancer: efficacy of reovirus as a biological therapeutic. Cancer Res 70: 2435–2444.
19. Harrington KJ, Vile RG, Melcher A, Chester J, Pandha HS (2010) Clinical trials with oncolytic reovirus: moving beyond phase I into combinations with standard therapeutics. Cytokine Growth Factor Rev 21: 91–98.
20. Lolkema MP, Arkenau HT, Harrington K, Roxburgh P, Morrison R, et al. (2011) A phase I study of the combination of intravenous reovirus type 3 Dearing and gemcitabine in patients with advanced cancer. Clin Cancer Res 17: 581– 588.
21. DeBiasi RL, Clarke P, Meintzer S, Jotte R, Kleinschmidt-Demasters BK, et al. (2003) Reovirus-induced alteration in expression of apoptosis and DNA repair genes with potential roles in viral pathogenesis. J Virol 77: 8934–8947. 22. Poggioli GJ, DeBiasi RL, Bickel R, Jotte R, Spalding A, et al. (2002)
Reovirus-induced alterations in gene expression related to cell cycle regulation. J Virol 76: 2585–2594.
23. Li L, Sevinsky JR, Rowland MD, Bundy JL, Stephenson JL, et al. (2010) Proteomic analysis reveals virus-specific Hsp25 modulation in cardiac myocytes. J Proteome Res 9: 2460–2471.
24. Huang da W, Sherman BT, Lempicki RA (2009) Bioinformatics enrichment tools: paths toward the comprehensive functional analysis of large gene lists. Nucleic Acids Res 37: 1–13.
25. Huang da W, Sherman BT, Lempicki RA (2009) Systematic and integrative analysis of large gene lists using DAVID bioinformatics resources. Nat Protoc 4: 44–57.
26. Coombs KM, Mak SC, Petrycky-Cox LD (1994) Studies of the major reovirus core protein sigma 2: reversion of the assembly-defective mutant tsC447 is an intragenic process and involves back mutation of Asp-383 to Asn. J Virol 68: 177–186.
27. Berard A, Coombs KM (2009) Mammalian reoviruses: propagation, quantifi-cation, and storage. Curr Protoc Microbiol Chapter 15: Unit15C 11. 28. Dwivedi RC, Spicer V, Harder M, Antonovici M, Ens W, et al. (2008) Practical
implementation of 2D HPLC scheme with accurate peptide retention prediction in both dimensions for high-throughput bottom-up proteomics. Anal Chem 80: 7036–7042.
29. Gilar M, Olivova P, Daly AE, Gebler JC (2005) Two-dimensional separation of peptides using RP-RP-HPLC system with different pH in first and second separation dimensions. J Sep Sci 28: 1694–1703.
30. Silverstein SC, Dales S (1968) The penetration of reovirus RNA and initiation of its genetic function in L-strain fibroblasts. J Cell Biol 36: 197–230.
31. Golden JW, Bahe JA, Lucas WT, Nibert ML, Schiff LA (2004) Cathepsin S supports acid-independent infection by some reoviruses. J Biol Chem 279: 8547– 8557.
32. Ooms LS, Kobayashi T, Dermody TS, Chappell JD (2010) A post-entry step in the mammalian orthoreovirus replication cycle is a determinant of cell tropism. J Biol Chem 285: 41604–41613.
33. O’Donnell SM, Holm GH, Pierce JM, Tian B, Watson MJ, et al. (2006) Identification of an NF-kappaB-dependent gene network in cells infected by mammalian reovirus. J Virol 80: 1077–1086.
34. Smith JA, Schmechel SC, Raghavan A, Abelson M, Reilly C, et al. (2006) Reovirus induces and benefits from an integrated cellular stress response. J Virol 80: 2019–2033.
35. Dai J, Pan W, Wang P (2011) ISG15 facilitates cellular antiviral response to dengue and west nile virus infection in vitro. Virol J 8: 468.
36. Perwitasari O, Cho H, Diamond MS, Gale M Jr. (2011) Inhibitor of kappaB Kinase {epsilon} (IKK{epsilon}), STAT1, and IFIT2 Proteins Define Novel Innate Immune Effector Pathway against West Nile Virus Infection. J Biol Chem 286: 44412–44423.
37. Lenschow DJ (2010) Antiviral Properties of ISG15. Viruses 2: 2154–2168. 38. Holm GH, Zurney J, Tumilasci V, Leveille S, Danthi P, et al. (2007) Retinoic
acid-inducible gene-I and interferon-beta promoter stimulator-1 augment proapoptotic responses following mammalian reovirus infection via interferon regulatory factor-3. J Biol Chem 282: 21953–21961.
39. Fensterl V, Sen GC (2011) The ISG56/IFIT1 gene family. J Interferon Cytokine Res 31: 71–78.
40. Goody RJ, Beckham JD, Rubtsova K, Tyler KL (2007) JAK-STAT signaling pathways are activated in the brain following reovirus infection. J Neurovirol 13: 373–383.
41. Suzuki K, Matsubara H (2011) Recent advances in p53 research and cancer treatment. J Biomed Biotechnol 2011: 978312.
42. Pan D, Pan LZ, Hill R, Marcato P, Shmulevitz M, et al. (2011) Stabilisation of p53 enhances reovirus-induced apoptosis and virus spread through p53-dependent NF-kappaB activation. Br J Cancer 105: 1012–1022.
43. Thirukkumaran C, Morris DG (2009) Oncolytic viral therapy using reovirus. Methods Mol Biol 542: 607–634.
44. Wang C, Qi R, Li N, Wang Z, An H, et al. (2009) Notch1 signaling sensitizes tumor necrosis factor-related apoptosis-inducing ligand-induced apoptosis in human hepatocellular carcinoma cells by inhibiting Akt/Hdm2-mediated p53 degradation and up-regulating p53-dependent DR5 expression. J Biol Chem 284: 16183–16190.
45. Clarke P, Meintzer SM, Gibson S, Widmann C, Garrington TP, et al. (2000) Reovirus-induced apoptosis is mediated by TRAIL. J Virol 74: 8135–8139. 46. Kleijnen MF, Shih AH, Zhou P, Kumar S, Soccio RE, et al. (2000) The hPLIC
proteins may provide a link between the ubiquitination machinery and the proteasome. Mol Cell 6: 409–419.
47. Nag A, Bagchi S, Raychaudhuri P (2004) Cul4A physically associates with MDM2 and participates in the proteolysis of p53. Cancer Res 64: 8152–8155. 48. Plesca D, Crosby ME, Gupta D, Almasan A (2007) E2F4 function in G2: maintaining G2-arrest to prevent mitotic entry with damaged DNA. Cell Cycle 6: 1147–1152.
49. Morgan KL, Chalovich EM, Strachan GD, Otis LL, Jordan-Sciutto KL (2005) E2F4 expression patterns in SIV encephalitis. Neurosci Lett 382: 259–264. 50. Ohtani N, Brennan P, Gaubatz S, Sanij E, Hertzog P, et al. (2003) Epstein-Barr
virus LMP1 blocks p16INK4a-RB pathway by promoting nuclear export of E2F4/5. J Cell Biol 162: 173–183.
51. Ren B, Cam H, Takahashi Y, Volkert T, Terragni J, et al. (2002) E2F integrates cell cycle progression with DNA repair, replication, and G(2)/M checkpoints. Genes Dev 16: 245–256.
52. Petit A, Ragu C, Della-Valle V, Mozziconacci MJ, Lafage-Pochitaloff M, et al. (2010) NUP98-HMGB3: a novel oncogenic fusion. Leukemia 24: 654–658. 53. Ueki T, Park JH, Nishidate T, Kijima K, Hirata K, et al. (2009) Ubiquitination
and downregulation of BRCA1 by ubiquitin-conjugating enzyme E2T overexpression in human breast cancer cells. Cancer Res 69: 8752–8760. 54. Berlutti F, Pantanella F, Natalizi T, Frioni A, Paesano R, et al. (2011) Antiviral
properties of lactoferrin–a natural immunity molecule. Molecules 16: 6992– 7018.
55. Liu XY, Chen W, Wei B, Shan YF, Wang C (2011) IFN-induced TPR protein IFIT3 potentiates antiviral signaling by bridging MAVS and TBK1. J Immunol 187: 2559–2568.
56. Kuhlmann I, Minihane AM, Huebbe P, Nebel A, Rimbach G (2010) Apolipoprotein E genotype and hepatitis C, HIV and herpes simplex disease risk: a literature review. Lipids Health Dis 9: 8.
57. Hishiki T, Shimizu Y, Tobita R, Sugiyama K, Ogawa K, et al. (2010) Infectivity of hepatitis C virus is influenced by association with apolipoprotein E isoforms. J Virol 84: 12048–12057.
58. Guergnon J, Godet AN, Galioot A, Falanga PB, Colle JH, et al. (2011) PP2A targeting by viral proteins: a widespread biological strategy from DNA/RNA tumor viruses to HIV-1. Biochim Biophys Acta 1812: 1498–1507.
59. Brown K, Vial SC, Dedi N, Long JM, Dunster NJ, et al. (2005) Structural basis for the interaction of TAK1 kinase with its activating protein TAB1. J Mol Biol 354: 1013–1020.
60. Cheung PC, Nebreda AR, Cohen P (2004) TAB3, a new binding partner of the protein kinase TAK1. Biochem J 378: 27–34.
61. Barr AJ, Ugochukwu E, Lee WH, King ON, Filippakopoulos P, et al. (2009) Large-scale structural analysis of the classical human protein tyrosine phosphatome. Cell 136: 352–363.
62. Sun T, Aceto N, Meerbrey KL, Kessler JD, Zhou C, et al. (2011) Activation of multiple proto-oncogenic tyrosine kinases in breast cancer via loss of the PTPN12 phosphatase. Cell 144: 703–718.
63. Villa-Moruzzi E (2011) Tyrosine phosphatases in the HER2-directed motility of ovarian cancer cells: Involvement of PTPN12, ERK5 and FAK. Anal Cell Pathol (Amst) 34: 101–112.
64. Barkhash AV, Perelygin AA, Babenko VN, Myasnikova NG, Pilipenko PI, et al. (2010) Variability in the 29–59-oligoadenylate synthetase gene cluster is associated with human predisposition to tick-borne encephalitis virus-induced disease. J Infect Dis 202: 1813–1818.