Syntheses, crystal structure and spectroscopic characterization
of novel
N
-R-sulfonyldithiocarbimate zinc(II) complexes
Genivaldo J. Perp
eetuo
a,*, Marcelo R.L. Oliveira
b, Jan Janczak
c,d, Heulla P. Vieira
b,
Fabiana F. Amaral
b, Vito M. De Bellis
da
Departamento de Fıısica, Instituto de Cieencias Exatas e Biol^ oogicas, Universidade Federal de Ouro Preto, Ouro Preto MG, CEP 35400-000, Brazil
bDepartamento de Quıımica, Universidade Federal de Vicßosa, Vicßosa MG, CEP 36571-000, Brazil
cInstitute of Low Temperature and Structure Research, Polish Academy of Science, P.O. Box 1410, Wrocław 50-950, Poland dDepartamento de Quıımica, Instituto de Ci^
e
encias Exatas, Universidade Federal de Minas Gerais, Belo Horizonte MG, CEP 31270-901, Brazil
Received 23 April 2003; accepted 5 August 2003
Abstract
Two new compounds of the general formula: (Ph4P)2[Zn(RSO2N@CS2)2], where R¼C6H5 (1) and 4-CH3C6H4 (2) were obtained in crystalline form by the reaction of the appropriate potassium N-R-sulfonyldithiocarbimate (RSO2N@CS2K2) with zinc(II) acetate dihydrate in dimethylformamide. The compounds crystallise in the centrosymmetric space group of the triclinic system withZ¼2. The single crystal X-ray analysis showed a similarly distorted tetrahedral configuration around the zinc(II) cation due to the bidentate chelation by two sulfur atoms of theN-R-sulfonyldithiocarbimate ligands. Ionic interaction between oppositely charged moieties, i.e., the bis(N-R-sulfonyldithiocarbimato)zincate(II) dianion [Zn(RSO2N@CS2)2]2and tetraphenylphosphonium
cation Ph4Pþand van der Waals interactions determine the crystal packing motif. The IR data are consistent with the formation of
zinc–dithiocarbimate complexes. The1H NMR and13C NMR spectra showed the expected signals for the tetraphenylphosphonium cation and the dithiocarbimate moieties.
Ó2003 Elsevier Ltd. All rights reserved.
Keywords:Dithiocarbimates; Zinc complexes; Crystal structure; NMR; IR-spectroscopy
1. Introduction
Compounds containing zinc–sulfur-coordinated
bonds have a wide range of application. For example, the Zn(II)–dithiocarbimate complexes are worldwide used in the rubber vulcanization process [1–7]. Several
dithiocarbimate and N-substituted dithiocarbimate
complexes and salts have been used as fungicides and pesticides mainly due to their high efficiency in con-trolling plant fungal diseases and relatively low toxicity [8–15]. 1,1-Dithiolates have been used for the removal of heavy metals cations from the mammalian systems [3,16]. Zinc dithiolates are used in metal organic chem-ical vapour deposition (MOCVD) processes for the growth of semiconductor ZnS films [17–21]. In all these applications, the use of anionic zinc–sulfur compounds
could be important. Vulcanization is greatly facilitated by the presence of anionic species. For example, vulca-nizing mixtures containing [Zn(Me2NCS2)3] are faster
accelerators of vulcanization than mixtures containing [Zn(Me2NCS2)2] [7]. The improvement of the anti-fungi
activity is another interesting possibility either by the use of active counter ions or by the variation on the solu-bility of the salts of the complexes by the use of different cations. The variation on the solubility could also be important in the extraction of toxic metals, like cad-mium, from biological systems [22]. In the MOCVD techniques, changing the counter ions could increase the salt volatility favouring an ideal film formation. As the zinc(II)–bisdithiocarbimate complexes are necessarily anionic species, it should be interesting to prepare and study this class of compounds.
Our interest in the syntheses and characterization of dithiocarbimate–metal complexes or salts is due to their similarities with the dithiocarbamate complexes. Earlier
www.elsevier.com/locate/poly
*
Corresponding author. Tel./fax: +55-31-35591667.
E-mail address:[email protected](G.J. Perpeetuo).
we have synthesized and characterized three novel
nickel(II) complexes with N-R-sulfonyldithiocarbimate
and triphenylphosphine ligands [23]. Here, we investi-gate two new zinc(II)–bis(N-R-sulfonyldithiocarbimate) anionic complexes that were isolated as
tetraphenyl-phosphonium salts with the general formula of
(Ph4P)2[Zn(RSO2N@CS2)2], where R¼C6H5 (1) and
4-CH3C6H4 (2). These compounds were obtained in the
crystalline form by the reaction of Zn(CH3COO)22H2O
with dithiocarbimate anions derived from sulfonamides and tetraphenylphosphonium chloride. The complexes were characterized by the single crystal X-ray diffraction
technique and by IR,1H and13C NMR spectroscopy.
2. Experimental
2.1.Methods and materials
The solvents were purchased from Merck and used without further purification. The sulfonamides, zinc acetate dihydrate and tetraphenylphosphonium chloride were purchased from Aldrich. Carbon disulfide and potassium hydroxide were purchased from Vetec. The
N-R-sulfonyldithiocarbimate–potassium salts dihydrate
were prepared in dimethylformamide from sulfonamides analogously as described in the literature [24,25]. These salts, which are soluble in water and insoluble in most organic solvents, were recrystallized from hot ethanol/ water solution. Melting points were determined with Mettler FP5 equipment. Microanalyses for C, H and N were obtained from a Perkin–Elmer 2400 CHN. Zinc was analysed by atomic absorption with a Hitachi Z-8200 Atomic Absorption Spectrophotometer. The ele-mental analyses of both Zn complexes have been also carried out on an energy dispersive spectrometer. The IR spectra were recorded with a Perkin–Elmer 283 B
infrared spectrophotometer using CsI pellets. The 1H
(400 MHz) and 13C (100 MHz) NMR spectra were
re-corded with a Bruker Advance RX-400
spectropho-tometer in CDCl3 with TMS as internal standard.
2.2.Syntheses
The syntheses of the zinc(II)–N
-R-sulfonyldithio-carbimate complexes were performed according to
Scheme 1. Zinc(II) acetate dihydrate (0.7 mmol) was
added to a suspension of the appropriate potassium N
-R-sulfonyldithiocarbimate dihydrate (1.5 mmol) in DMF (15 mL). The mixture was stirred for 1.5 h at room temperature and filtered. Water (15 mL) and tet-raphenylphosphonium chloride (1.5 mmol) were added to the solution obtained. The mixture was stirred for 15 min and the obtained yellowish solid product was fil-tered, washed with distilled water and dried under
re-duced pressure for three days, yielding (Ph4P)2
[Zn(RSO2N@CS2)2] (ca. 60%). Suitable colourless
crystals for X-ray structure analysis were obtained after slow evaporation of the solutions of the compounds in dichloromethane/methanol/water.
2.2.1.
Bis(tetraphenylphosphonium)bis(N-phenyl-sulfonyldithiocarbimato)zincate(II), (Ph4P)2
[Zn(S2CNSO2C6H5)2] (1)
Elemental analysis: Found (Calc. for C62H50N2O4
P2S6Zn): C, 61.55 (61.71); H, 4.31 (4.18); N, 2.24 (2.32);
O, 5.42 (5.30); P, 5.10 (5.13); S, 15.98 (15.94) and Zn, 5.40 (5.42)%. m.p. (°C): 157.5–159.7. IR (most intense
bands) (cm1): 1368 m(C
@N); 1278 mass(SO2); 1143 msym(SO2); 937mass(CS2) and 339m(ZnS).1H NMRðdÞ:
7.93–7.90 (m, 4H, H2 and H6 (R group)); 7.89–7.56 (m,
40H, Ph4Pþ); 7.25–7.14 (m, 6H, H3, H4 and H5 (R
group)). 13C{1H} NMR ðdÞ: 209.76 (N
@CS2); 143.42
(C1); 127.52 (C2 and C6); 127.84 (C3 and C5); 130.42
(C4); tetraphenylphosphonium cation signals (J (Hz)):
117.41 (d, J¼88:9, C10); 130.65 (d, J¼12:8, C20 and C60); 134.50 (d, J ¼10:3, C30 and C50); 135.51 (d,
J ¼3:0, C40).
2.2.2.
Bis(tetraphenylphosphonium)bis(N-4-methyl-phenylsulfonyldithiocarbimato)zincate(II), (Ph4P)2
[Zn(S2CNSO2C6H4CH3)2]: (2)
Elemental analysis: Found (Calc. for
C64H54N2O4P2S6Zn): C, 62.08 (62.25); H, 4.56 (4.41);
N, 2.29 (2.27); O, 5.31 (5.18); P, 4.98 (5.02); S, 15.52 (15.58) and Zn, 5.26 (5.29)%.m.p.(°C): 167.3–168.7.IR
(most intense bands) (cm1): 1383 m(C
@N); 1277
mass(SO2); 1141msym(SO2); 930mass(CS2) and 330m(ZnS).
1H NMRðdÞ: 7.83–7.55 (m, 44H, H2, H6 (R group) and
Ph4Pþ), 6.98 (d (J ¼8:2 Hz), 4H, H3 and, H5 (R
group)) and 2.20 (s, 6H, CH3). 13C{1H} NMR ðdÞ:
209.29 (N@CS2); 140.46 (C1 and C4); 127.85 (C2 and
2 RSO2N=CS2K2.2H2O
6 H2O, -2 KCl, -2 CH3COOK
-(Ph4P)2[Zn(RSO2N=CS2)2]
1, 2
1 (R = C6H5)
C6); 128.04 (C3 and C5); 21.31 (CH3);
tetraphenyl-phosphonium cation signals (J(Hz)): 129.33 (d,J ¼54, C10); 134.29 (t,J ¼ 6, C20and C60); 128.33 (t,J¼5, C30 and C50); 130.75 (s, C40).
2.3.X-ray crystallography
X-ray intensity data for both crystals were collected
using graphite monochromatic Mo Ka radiation on a
four-circlej-geometry K U M A K M - 4K U M A K M - 4 diffractometer with
a two-dimensional area CCD detector (in Department of Crystallography, Institute of Low Temperature and Structural Research, Polish Academy of Science, Wro-cław, Poland). The x-scan technique with Dx¼0:75°
for each image was used for data collection. The 960 images for six different runs covered about 95% of the Ewald sphere. Initially the lattice parameters were re-fined on about 150 reflections obtained from 40 images for eight runs with different orientation in the reciprocal space. Finally the lattice parameters were refined by least-squares methods based on all the reflections with
I>2rðF2Þ. One image was used as a standard for
monitoring the stability of the crystals as well as for monitoring the data collection after every 40 images, and no correction on the relative intensity variation was necessary. Integration of the intensities, correction for Lorenz and polarization effects were performed using a
K U M A
K U M A K M - 4K M - 4 C C DC C D program system [26]. The face-indexed
analytical absorption was calculated using theS H E L X T LS H E L X T L
program [27]. The structures were solved by direct methods using S H E L X SS H E L X S of the S H E L X LS H E L X L97 program [28].
The calculated E map revealed the Zn, S, P, O, N and most of the C atoms. The remaining C atoms were lo-cated from the difference Fourier synthesis. The
struc-tures were refined with the anisotropic thermal
parameters for all non-hydrogen atoms. Difference Fourier maps gave electron density concentrations ap-proximately located for all hydrogen atom positions; these positions were idealised (HFIX 43 for all H atoms of the phenyl rings with isotropic thermal parameters of 1.2Ueq of the carbon atoms joined directly to the
hy-drogen atoms, and HFIX 137 for the CH3group in the
compound 2 with isotropic thermal parameters of
1.5Ueq of the methyl carbon atom). Final difference
Fourier maps showed no peaks of chemical significance. Details of the data collection parameters and final agreement factors are collected in Table 1. Selected bond lengths and angles are listed in Table 2.
3. Results and discussion
Both compounds in solid state are quite stable at the ambient conditions. They are slightly soluble in water, methanol and ethanol, and are soluble in chloroform and dichloromethane. The ideal mixture of solvents used for crystallization of the compounds is methanol/water with some drops of dichloromethane. The low melting
Table 1
Crystal data, data collection and refinement details for1and2
Formula C62H50N2O4P2S6Zn C64H54N2O4P2S6Zn
Molecular weight 1206.71 1234.76
Crystal system triclinic triclinic
Space group P11 P11
Unit cell dimensions:
a;b;c(AA) 11.136(2), 16.273(3), 17.649(4) 9.422(2), 17.582(4), 20.081(4)
a;b;c(°) 89.50(3), 79.49(3), 72.20(3) 73.66(3), 82.79(3), 84.60(3) Volume,V(AA3) 2990.3(10) 3160.9(12)
Z 2 2
Dcalc:(g/cm3) 1.340 1.297
Dobs:(floatation) (g/cm3) 1.34 1.29
Radiation, Mo Ka(AA) 0.71073 0.71073 Index range:
h )14!10 )13!9
K )20!20 )23!24
L )22!22 )27!27
Reflections collected 25,635 29,512
Independent reflections 12,671 (Rint¼0.0214) 15,474 (Rint¼0.0609) Absorption coefficient,l(mm1) 0.721 0.684
Correction: Lorenz and polarization, absorption,
Tmin¼0:7515,Tmax¼0:9058
Lorenz and polarization, absorption,
Tmin¼0:832,Tmax¼0:947 Refinement onF2
R(F2>r) 0.0475 0.0688
wR(F2all reflections) 0.1107 0.0796
Residual electron density (eAA3)
)0.513 and +0.762 )0.755 and +1.001 R¼PkFoj jFck=PFo, wRðF2Þ ¼ f½PwðFo2Fc2Þ
2
=PwF4
og 1=2,
w1¼ ½r2ðF2
oÞ þ ð0:0330PÞ 2
points are desirable for liquid precursors in the
MOCVD techniques. As compounds1and2have lower
melting points (157.5–159.7 and 167.3–168.7 °C,
re-spectively) than either [Zn(Et2NCS2)2] (178 °C) or
[Zn(Me2NCS2)2] (ca. 250 °C) [17], they are potential
precursors for ZnS film deposition. Furthermore, lower melting points might be obtained by replacing the Ph4Pþ
cation by other counter ion.
There are no strong or medium bands in the 1400–
1600 cm1 region in the IR spectra of the compounds1
and 2as well as in the spectra of the potassium
dithio-carbimates related to the compounds. ThemCN band in
the spectra of the potassium dithiocarbimates is observed
at around 1260 cm1 [29]. This low value indicates a
great contribution of the canonical form (a) and (b) for the resonance hybrid in the dithiocarbimate potassium
salts (Scheme 2). A strong band at 1368 and 1383 cm1
observed in the spectra of the compounds 1 and 2,
re-spectively, is assigned to the mC@N vibration of the RSO2N@CS2group. In the spectral region of 1300–1100
cm1 two vibrational bands are observed. They are
as-signed to the sulfonyl SO2 group: one band at lower
frequency is assigned to the symmetric vibration mode of the sulfonyl group – msym(SO2) (1143 and 1141 cm1 in
the spectrum of1and2, respectively) and one at higher frequency (1278 and 1277 cm1in1and2, respectively)
is assigned to the asymmetricmass(SO2). The spectral
re-gion of 1000–900 cm1is characteristic for the disulfuric
chelation [30]. The massCS2 was observed at higher
fre-quency in the spectra of the potassium salts of dithio-carbimates (ca. 955 cm1) [29] than that in the spectra of the compounds here studied (937 and 930 cm1for1and 2, respectively). The shifts observed in the massCS2 and mCN in the spectra of the compounds here studied, when compared with the spectra of the ligands, are consistent with the increased importance of the canonical form (c) in both Zn complexes (Scheme 2). The spectra of the compounds also show the expected medium band in the
300–400 cm1 range assigned to the Zn
AS stretching vibration indicating the gem-disulfur ligand [31]. Only one band being observed in the spectral region of ZnAS stretching vibration may be explained by the fact that the differences between the ZnAS bond lengths are relatively small, as shown by the X-ray single crystal analysis.
The NMR spectra showed the expected signals for the
compounds. The1H NMR spectra showed the signals for
the hydrogen atoms of the tetraphenylphosphonium cation. The remaining signals could be assigned to the CH3group of the aromatic moiety and the other aromatic
hydrogen atoms. The integration curves on the1H NMR
spectra were consistent with a 2:1 proportion between the
tetraphenylphosphonium cation and the bis(N
-R-sul-fonyldithiocarbimato)zincate(II) dianions. The signals of the freeN-R-sulfonyldithiocarbimates [29] and those of
the N-R-sulfonyldithiocarbimate moieties of the
com-pounds here studied show approximately the same
chemical shifts. The13C NMR spectra showed, for both
compounds, only five signals assigned to the
dithiocarb-imate moiety (the signals of C1 and C4 of compound 2
R S N C R S N C R S N C R S N C S
S _
_
O O O O
S S_
_ _
S S
S S_
_
Scheme 2. Table 2
Selected bond lengths (AA) and angles (°)
1 2
Bond lengths
Zn1AS1 2.344(2) 2.321(2)
Zn1AS2 2.336(2) 2.365(2)
Zn1AS11 2.363(2) 2.321(2)
Zn1AS12 2.320(2) 2.379(2)
S1AC1 1.742(3) 1.758(6)
S2AC1 1.749(4) 1.716(6)
C1AN1 1.297(4) 1.333(6)
N1AS3 1.632(3) 1.621(5)
S3AO1 1.448(3) 1.420(4)
S3AO2 1.432(3) 1.444(4)
S3AC2 1.763(4) 1,773(6) S11AC11 1.849(5) 1.740(7) S12AC11 1.714(4) 1.791(6) C11AN11 1.252(4) 1.313(7)
N11AS13 1.642(4) 1.601(5)
S13AO11 1.381(3) 1.437(4)
S13AO12 1.472(3) 1.478(4)
S13AC12 1.779(4) 1.750(7)
Bond angles
S1AZn1AS2 77.73(4) 76.91(6)
S11AZn1AS12 78.33(5) 77.56(6)
S1AZn1AS11 134.38(5) 128.45(7)
S2AZn1AS12 126.78(5) 134.87(7)
S1AZn1AS12 122.90(5) 121.51(7)
S2AZn1AS11 124.47(5) 125.77(7)
S1AC1AN1 128.9(3) 128.6(5)
S2AC1AN1 116.5(2) 117.4(5)
S1AC1AS2 114.6(2) 114.0(4)
C1AN1AS3 123.0(2) 119.9(4) N1AS3AC2 105.2(2) 110.7(3) N1AS3AO1 113.6(2) 114.6(3)
N1AS3AO2 104.4(2) 102.8(3)
C11AN11AS13 127.0(3) 121.5(5)
S11AC11AN11 124.8(4) 119.2(5)
S12AC11AN11 122.3(4) 127.9(5)
S11AC11AS12 112.2(2) 113.0(4)
N11AS13AC12 102.5(2) 109.0(3)
N11AS13AO11 106.2(2) 101.5(3)
N11AS13AO12 113.2(2) 116.0(3)
were superimposed). This fact points to a magnetic equivalence of the corresponding atoms in both dithio-carbimate ligands in each compound in solution. The chemical shifts of the aromatic carbon atoms of the di-thiocarbimate anions in the compounds are similar to those of the corresponding sulfonamides [32]. The N@CS2 (C1) signal is shifted in the spectra of the
com-plexes to higher field if compared to the spectra of the li-gands. Although the solvents are necessarily different, this shift is expected. If the canonical form (c) (Scheme 2) is more important for the complexes than for the ligands, then the C1 carbon atom is expected to be more shielded in the complexes.
The X-ray single crystal analysis of the two ionic complexes here studied are the first examples of this type of dithiocarbimate structures. The molecular structures of (Ph4P)2[Zn(S2CNSO2C6H5)2] (1) and (Ph4P)2
[Zn(S2CNSO2C6H4CH3)2] (2) are shown in Figs. 1(a)
and (b), respectively. In both compounds the zinc atom
is coordinated by four sulfur atoms of two N
-R-sul-fonyldithocarbimate ligands into a similarly distorted tetrahedral configuration due to the chelating effect of the ligands, which is clearly manifested in the SAZnAS angles. The two SAZnAS angles containing both sulfur
atoms of the same N-R-sulfonyldithocarbimate
chelat-ing ligand (S1 and S2 or S11 and S12) are significantly
smaller, while the remaining four SAZnAS angles con-taining the sulfur atoms of twoN -R-sulfonyldithocarb-imate chelating ligands are significantly greater than the
angles observed for ideal ZnS4 tetrahedral geometry
(109.3°). The ZnS4 coordination polyhedron is
addi-tionally distorted due to the interaction with the large tetraphenylphosphonium cations that can be illustrated by the deviation from 90°(in an ideal tetrahedral) of the
dihedral angle between the Zn1, S1, S2 and Zn1, S11, S12 planes. This angle is equal to 83.4(3) and 82.0(3) in
compound 1 and 2, respectively. The slightly greater
deviation of the dihedral angle from 90° for the
com-pound 2 can be explained by the stereochemistry
affecting the large Ph4Pþcations that interact with thep
-CH3group of theN-R-sulfonyldithocarbimate chelating
ligands coordinated to the Zn atom. The N
-R-sul-fonyldithocarbimate dianion (RSO2N@CS2)2 as
bid-entate ligands form stable four membered rings by chelation through the two sulfur atoms (ZnS2C).
The four ZnAS bond lengths are ranging from
2.320(2) to 2.363(2) AA for compound 1 and they are
compared with those observed in compound 2
(2.337(2)–2.377(2)AA). The C1AN1 and C11AN11 bond lengths of 1.297(4) and 1.252(4) AA, respectively, in
compound 1 are shorter than in the N
-phen-ylsulfonyldithiocarbimate potassium salt (C6H5SO2N@ CS2K2) (1.342(9)AA) [25] and than those found in
com-pound 2 (1.333(6) and 1.313(7) AA, respectively). These values are shorter than the normal single C(sp2)
AN(sp2) bond length (ca. 1.35AA). In compound1the CAN bond lengths are similar to that of the double bond C(sp2)
@N(sp2) (1.273–1.295 AA) [33,34], while in
com-pound 2 the double character of this CAN bond
de-creases. The CAS bond lengths of both dithio CS2
chelating groups are very similar (average value of 1.748° and are slightly shorter than the typical CAS
single bond length (ca. 1.81 AA) due to partial p
-delo-calization in the SACAS groups. The S1AC1AN1 and
S11AC11AN11 angles are significantly greater than
S2AC1AN1 and S12AC11AN11 due to the interaction
between the SO2R groups and S1 and S11 atoms, which
are joined in cispositions in relation to the C1–N1 and C11–N11 bonds. The steric effect of the phenylsulfonyl
or 4-methyl-phenylsulfonyl (RSO2) groups are greater
than the effect of the non-bonding lone-pair of electrons
at the N1 and N11 atoms, since the C1AN1AS3 and
C11AN11AS13 angles are greater than 120° in both
complexes. If the group linked to the N atom is small
such asASO2CH3 [35] orACN [36] groups the
non-bonding effect of the lone-pair of electrons predicted by the valence-shell electron pair repulsion theory (VSEPR) [37,38] is greater than the steric effect of these groups.
The Zn1, S1, S2, C1, N1, S3 (plane 1) and Zn1, S11, S12, C11, N11, C13 (plane 2) fragments of the bis(N -R-sulfonyldithiocarbimato)zincate(II) dianion are almost
weighted mean plane through the fragments are smaller
than 0.1 AA. The dihedral angle between the
above-mentioned planes (1 and 2) is equal to 81.5(3)° and
84.6(3)°in compounds1and2, respectively. The planar
C2AC7 phenyl ring is inclined by about 91.5(3)° to
plane 1 and the second C12AC17 phenyl ring is inclined by 87.4(3)°to plane 2 in compound1, and the equivalent
angles in compound 2 are 79.9(3)° and 87.5(3)°,
re-spectively. The C1AN1AS3AC2 and N1AS3AC2AC3
torsion angles for one N-R-sulfonyldithocarbimate
li-gand and the torsion angles of C11AN11AS13AC12
and N11AS13AC12AC13 for the second ligand describe
the conformation of the ligands along the N1AS3 or
N11AS13 bonds (see Fig. 1a) and the orientation of the planar phenyl rings (the second torsion angles). These angles are equal to 68.1(3)°and 61.7(3)°for the first
li-gand and 66.7(3)°and )124.1(3)°for the second ligand
in compound 1. The corresponding torsion angles in
compound 2 (see Fig. 1(b)) are equal to )63.4(3)° and 113.2(3)°for one ligand and 67.7(3)°and)129.5(3)°for
the second ligand, respectively. Thus the conformation
of the ligands along N1AS3 and N11AS13 in the
com-pound 1 is similar [68.1(3)° and 66.7(3)°] and in
com-pound2the conformation of one ligand [along N1AS3,
)63.4(3)°] is opposite to the other ligand [along
N11AS13, 113.2(3)°].
The sulfonyl S3 and S13 atoms of both N
-R-dithio-carbimate ligands have an expected distorted tetrahedral
geometry. The O1AS3AO2 and O11AS13AO12 angles
are significantly greater than the value for ideal tetra-hedral geometry due to the steric effect of lone-pairs of
electrons on both oxygen atoms. The S3AO1 and
S3AO2 bond lengths indicate their double bond
char-acter (S@O); a typical distance of the double S@O bond ranges from 1.418 to 1.442 AA [34,36]. The difference
between the S13AO11 and S13AO12 bonds in
com-pound1[1.381(3) and 1.472(3)AA] is more obvious than
in compound 2 in which all SAO distances in the
sul-fonyl ASO2R groups are as expected. The chemically
equivalent SAO bond lengths of both N
-R-sulfonyldi-thiocarbimate ligands in the compound2 are very
sim-ilar, however in the compound1the differences between
the corresponding bonds of both N
-R-sulfonyldithio-carbimate ligands, especially the above-mentioned
S13AO11 and S13AO12 bonds are greater. These
dif-ferences can be explained by the slightly single character of the S13AO12 bond (1.472(3)AA, this value is slightly
longer than the normal double S@O bond) with
short-ening the other S13AO11 bond in the sulfonyl SO2
group. These SAO distances indicate a contribution of
the canonical form (d) (Scheme 2) in one of the N
-R-sulfonyldithiocarbimate ligands in compound 1. The
observed differences between the SAO bonds of the N -R-sulfonyldithiocarbimate ligand in the X-ray experi-ment might be due to the greater anisotropic thermal parameters of S13, O11 and O12 in comparison to the
other sulfonyl group (S3, O1, O2) indicating the possi-bility of disorder. However, when used for the sulfonyl group (atoms S13, O11, S12) some disorder models were not successful, thus the greater anisotropic thermal pa-rameters (in relation to the other SO2 group) indicate
rather on the greater molecular motion. The calculated corrections of the S13AO11 and S13AO12 bond lengths using the Schomaker and Trueblood [39] procedure for the librations indicate that the corrections of the SAO bond lengths are not greater than0.02AA. Thus, most probably, as suggested before, the difference between the SAO distances could be explained by the slightly single
character of the S13AO12 bond as shows the resonance
hybrid (d) (Scheme 2). The S3AC2 and S13AC12 bonds
with distances of 1.763(4) and 1.779(4)AA in compound1
and 1.773(6) and 1.750(7) AA in compound 2,
respec-tively, correlate well with the distances of 1.749–1.798AA
for CarAS bonds in related complexes which comprise
the CarASO2AN fragment [34]. The S3AN1 and
S13AN11 bond lengths with the average distance of
1.624AA indicate a single bond nature; the typical value of the N(sp2)
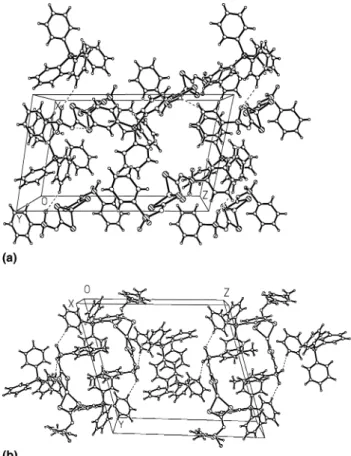
AS bond distance is 1.623–1.659AA [34]. The arrangement of the molecules in the crystal1and
2 (see Figs. 2(a) and (b)) is mainly determined by the
ionic interaction of the oppositely charged moieties, i.e., bis(N-R-sulfonyldithiocarbimato)zincate(II) dianion and tetraphenylphosphonium cations and by the van der
Waals forces. The structures are slightly stabilized by the
weak CAH O and CAH N interactions with the
C O and C N distances of approximately 3.33 and 3.45AA in the crystal of 1 and 3.44 and 3.30 AA in the crystal of2, respectively. Although in both crystals the
CAH O and CAH N interactions are weak, we
suppose that they are important for the crystal packing.
The usually weak CAH N and CAH O hydrogen
bonds play a significant role in the formation and sta-bilisation of supramolecular architectures, especially in biological systems. The formation of a non-covalent association of proteins and ligands, formation of a phospholipid bilayer, interaction of a transcription fac-tor with DNA, and folding of a tRNA into its three-dimensional conformation are examples of processes
that depend on noncovalent weak CAH O and
CAH N interactions [40]. As can be seen from the
crystal packing (Fig. 2) the hydrophobic phenyl rings of the Ph4Pþcations are located close on both sides of the
polar (hydrophilic) sulfonyl groups. This arrangement
together with the weak CAH O and CAH N
inter-actions are responsible for the observed only slightly solubility of these complexes in polar solvents like water, methanol or ethanol, as well as for the relatively low melting point.
4. Conclusion
Two novel anionic zinc(II) complexes with dithio-carbimates were obtained. Their tetraphenylphospho-nium salts were isolated in crystalline form and
characterized by IR, 1H and 13C NMR and by single
crystal X-ray diffraction techniques. The single crystal X-ray analysis and spectroscopic data show interesting correlations. The frequency value of the IR mC@N
vi-bration observed in the spectrum of compound 1 is
greater than that observed for the free ligand (around 1260 cm1) [29]. This observation is in agreement with
the suggestion that the CAN bond in the free ligand is more single (CAN, 1.342(9) AA [25]) and after complex-ation the double character of this CAN bond increases. The NMR spectra show that carbon atoms C1 and C11
of theN-R-sulfonyldithiocarbimate ligand of compound
1are more shielded than that of the parent ligands [29]. This fact is in accordance with an increase of the con-tribution of the canonical form (c) (Scheme 2) to the resonance hybrid from the free ligand to the Zn-com-plexes, and consequently with the increase of the CAN double bond character.
5. Supplementary material
Crystallographic data for the structural analysis have
Data Centre, CCDC Nos. 201751 and 201752 for1and
2, respectively. Copies of this information may be ob-tained free of charge from The director, CCDC, 12 Union Road, Cambridge, CB2 1EZ, UK (fax: +44 1223-336-033; e-mail: deposit@ccdc:cam:ac:uk or www:
http://www.ccdc.cam.ac.uk).
Acknowledgements
This work has been supported by CNPq, CAPES and FAPEMIG (Brazil).
References
[1] D. Coucouvanis, Prog. Inorg. Chem. 11 (1969) 233.
[2] P.J. Nieuwenhuizen, J. Reedijk, M. van Duin, W.J. McGill, Rubber Chem. Technol., Rubber Rev. 70 (1997) 368.
[3] M.J. Cox, E.R.T. Tiekink, Rev. Inorg. Chem. 17 (1997) 1. [4] W. Hofmann (Ed.), Rubber Technology Handbook, Carl Hanser
Verlag, Munich, 1989, pp. 242–259.
[5] L. Bateman, C.G. Moore, M. Porter, B. Saville, in: L. Bateman (Ed.), The Chemistry and Physics of Rubber-like Substances, first ed., Maclaren & Sons, London, 1963, pp. 449–561.
[6] P.J. Nieuwenhuizen, S. Timal, J.G. Haasnoot, A.L. Spek, J. Reedijk, Chem. Eur. J. 3 (1997) 1846.
[7] P.J. Nieuwenhuizen, A.W. Ehlers, J.G. Haasnoot, S.R. Janse, J. Reedijk, E.J. Baerends, J. Am. Chem. Soc. 121 (1999) 163. [8] K.H. Gustafsson, C.H. Fahlgren, J. Agric. Food Chem. 31 (1983)
461.
[9] H. van Lishaut, W. Schwack, J. AOAC Int. 83 (2000) 720. [10] S.M. Dogheim, S.A.G. Alla, A.M. El-Marsafy, S. Fahmy, J.
AOAC Int. 82 (1999) 948.
[11] Y. Jianren, Z. Yongquan, J. Shuzshen, W. Zhengguo, Z. Fuzhen, Sci. Agric. Sin. 22 (1989) 76.
[12] G.D. Thorn, R.A. Ludwig (Eds.), The Dithiocarbamates and Related Compounds, Elsevier, Amsterdam, The Netherlands, 1962.
[13] M.J. Burkitt, H.S. Bishop, L. Milne, S.Y. Tsang, G.J. Provan, C.S.I. Nobel, S. Orrenius, A.F.G. Slater, Arch. Biochem. Biophys. 353 (1998) 73.
[14] A.K. Malik, W. Faubel, Pestic. Sci. 55 (1999) 965.
[15] E. Humeres, N.A. Debacher, M.M. de S. Sierra, J. Org. Chem. 64 (1999) 1807.
[16] T. Kamenosono, H. Shimada, T. Funakoshi, S. Kojima, Toxi-cology 170 (2002) 103.
[17] M. Motevalli, P.OO Brien, J.R. Walsh, I.M. Watson, Polyhedron 15 (1996) 2801.
[18] B.L. Drue, Yu.N. Evtukhov, M.Ya. Rakhlin, Organomet. Chem. USSR 1 (1988) 357.
[19] D.M. Frigo, O.F.Z. Khan, P. OÕBrien, J. Cryst. Growth 96 (1989) 989.
[20] B.L. Druz, A.I. Dyadenko, Yu.N. Evtukhov, M.Ya. Rakhlin, A.E. Rodionov, Inorg. Mater. 26 (1990) 24.
[21] R.D. Pike, H. Cui, R. Kershaw, K. Dwight, A. Wold, T.N. Blanton, A.A. Wernburg, H.J. Gysling, Thin Solid Films 224 (1993) 221.
[22] E.I. Stiefel, in: E.I. Stiefel, K. Matsumoto (Eds.), Transition Metal Sulfur Chemistry: Biological and Industrial Significance, ACS Symposium Series, vol. 653, American Chemical Society, Wash-ington, DC, 1996.
[24] K. Hartke, Arch. Pharm. 299 (1966) 164.
[25] H.U. Hummel, U. Korn, Z. Naturforsch 44B (1989) 24. [26] KUMA Diffraction, KUMA KM-4 CCD program package, Ver.
163, 2000, Wrocław, Poland.
[27] G.M. Sheldrick, SHELXTL Program, Siemens Analytical X-ray Instrument Inc., Madison WI, 1991.
[28] G.M. Sheldrick, SHELXL-97, Program for the Solution and Refinement of Crystal Structures, University of Goottingen,€
Goottingen, Germany, 1997.€
[29] M.R.L. Oliveira, V.M. De Bellis, Trans. Met. Chem. 24 (1999) 127. [30] D.A. Brown, W.K. Glass, M.A. Burke, Spectrochim. Acta A 32
(1976) 137.
[31] K. Nakamoto (Ed.), Infrared and Raman of Inorganic and Coordination Compounds, 3rd ed., Wiley, New York, 1978, p. 339.
[32] M. Pomerantz, W.N. Chou, M.K. Witczak, C.G. Smith, J. Org. Chem. 52 (1987) 159.
[33] D. Coucouvanis, J.P. Fackler Jr., Inorg. Chem. 6 (1967) 2047.
[34] F.H. Allen, O. Kennard, D.G. Watson, L. Brammer, A.G. Orpen, J. Chem. Soc., Perkin Trans. 2 (1987) S1–S19.
[35] M.R.L. Oliveira, V.M. De Bellis, N.G. Fernandes, Struct. Chem. 8 (1997) 205.
[36] F.A. Cotton, C.B. Harris, Inorg. Chem. 7 (1968) 2140. [37] R.J. Gillespie, J. Chem. Educ. 40 (1963) 295.
[38] R.J. Gillespie, Chem. Soc. Rev. 21 (1992) 59.
[39] V. Schomaker, K.N. Trueblood, Acta Cryst. B 24 (1968) 63. [40] G.R. Desiraju, T. Solid (Eds.), The Weak Hydrogen Bond in