THE EFFECTS OF RENT CONTROL IN LISBON
PAULO ANDRÉ RAMALHO COSTA
MASTER IN ECONOMICS
Student 14000250
Under the supervision of:
André Castro Silva
2
THE EFFECTS OF RENT CONTROL IN LISBON
Abstract: I study the rent market and the effects of rent control in Lisbon with a review
on history of rent market laws and the unsuccessful rent actualizations, where the rent market represents 48% of the occupied dwellings, with old contracts representing circa 70% of the rented, with an estimated gap between old and new contracts of 394€,
according to a model based on the type and date of contract and other characteristics for each Lisbon Borough. Central borough presents high levels of old population and deterioration while Lisbon is reducing its housing park and population.
Keywords:
Rent Control, Asset Pricing, House Market
I dedicate this work to my family, friends and colleagues that always supported me.
I’ve to thanks to my advisor and the people who kindly helped me in Instituto Nacional de Estatistica, Direcção Municipal de Conservação e Reabilitação Urbana and Confidencial
I.
General Overview
I study the Residential Rent Market in Lisbon, the most know city in Portugal and which is the typical case of an ancient town strongly facing the consequences of the rent control effects and perversions, such as outdated and very low levels of rent, with an estimated difference of 394€, population fixation, reduction and aging of the population, with more than 65 years old representing 24% of the total population, lack of buildings’
maintenance, 55% of buildings needs maintenance, expropriation of property rights,
lack of rent units’ supply an increase current market values, with the population pushed
to own a house instead, about 12 percentage points more from 1991 to 2001 while the
landlord and tenant’s relation was even seen as fight interests, instead of a conjugation
4
where the rents were frozen for longer periods, a problem with a difficult overcoming, whose extensions and effects are even felt nowadays1.
For Portugal, to extend of my knowledge, there is any relevant literature or studies regarding this question, they are mainly about population and demography as studies from INE or about urban planning. So the purpose of this work is to present revealing data and show the deepness of the problem, analyzing the population, the rent market structure and the evolution of the rent market in Lisbon, studying the gaps in prices and house allocation, revealing indicators of misallocation, market and people stagnation and establishing a relation between the evidence of rent control and its indirect consequences, as far as possible for each distinct borough, and build a database with relevant data for the proposed analyze.
The data is very limited, without any series of micro studies regarding urban house market, being restricted to the decennial census of population and housing from INE and also some series of indicators but without the geographic division needed and just for a few space of time, without a direct relation with the individual/families and theirs characteristics and the dwellings rented/owned where they live, the close approximation its by boroughs, with main data from the 2001 census.
II.
Literature Review
Rent control is any imposition or restriction to the rent market causing impedance to attain the efficiency in detriment of another objective, as could be the transference of
1 Accordingly to the data of European Community Household Panel (ECHP) 1994-2000, European
Quality of Life Survey 2003 and 2007 (Portugal have high owing the dwelling percentage and low rent the dwelling percentage) and number eleven of the preamble of the Decree-Law nº 321-B/90 of 15th
October which establishes the old RAU (Urban Rent Regime) now revoked by the Law n.º 6/2006 of 27th
the market’s surplus to the other party or to regulate some temporary market’s
disturbance. Richard Arnott (1995) refers two types of rent control the “hard” or “first
generation” taken during the periods of war which are the nominal rent freeze and the
“second generation” that are “soft” but complex with allowable rent increases and
regulated conversion, maintenance and relations.
Miller, Benjamin and North (2009) exposed the cases of Santa Monica and New York City that is typical case of rent control. Cities where ruined houses can be found close to costly ones, because owners prefers to derelict the house once the rent couldn’t
pay for maintenance, while new constructions is discouraged too, leading to a house
gap, with families that can’t find a house, where others are underusing the houses that
are paying for a low price, without subletting to another by a marginal price of the housing service, there are other large families that are living in small apartments since
the market doesn’t have the enough freedom and flux to efficiently allocate the families,
tenant mobility becomes restricted. As housing becomes a scarce good in the city, the
vacancy rates are too low and landlord starts charging “key money”, with large amount
up-front payment for new move in’s. Rent Control started to protect the market and low
income people in periods of house scarcity or high levels of people mobility, as it’s the
case of war times, but what we have now are many landlord that lost their right to profit from theirs properties while in many cases they are poorer than theirs tenant, , as the bid
for house doesn’t work properly and prices are restricted who gets the house is who
have more financial capacity to accomplish with the rent payments while the poorest ones becames excluded. Regarding the question of rent distribution Gale Johnson
(1951) stated that “the vested interests of several million tenants will be so great,
6
the transfer of real income from landlords to tenants are made without regard to the income position of each ones, where the less mobile elements of the renting population have fared very well, while arriving families suffered real hardships and were forced to double-up in uncontrolled units, with prices increased by the impacts of rent controls.
Friedman and Stigler (1946), addressed the case of rent control in San Francisco where rent control difficult the allocation of the population in the post-war housing shortage in 1946, while in 1906 after an earthquake each house had to shelter 40 percent more people, but without rent control the city was rebuild quickly and after a month
there wasn’t mention to a shortage problem. As the price rationing allows bidding up of
rents, forcing the people to economize on space, there is always housing available for rent, incentives mobility and new construction, the market reacts and regulates by itself through the price system. The major criticism of the price system method is that “better
quarters go to those who have larger incomes or more wealth”, but in fact rent control
doesn’t solve the problem, because a man who has enough capital could purchase a
desirable house in the free sales market , similarly the landlords would prefer to rent to the more wealthier to guarantee their payment, while big families have troubles to find a house whiles the house for rent becomes scarce and the spaces already rented are freely underused. Rent control implies workers loss of mobility, incentive to take in more persons and the allocated ones lost the incentive to move or double-up when they have more house service than they need. So, we could also think in inefficient allocation of the work force, affecting the productivity of the industry which could be a barrier for firms to entering in the market according to Cabral, Luis (2005).
quantities offered, as well as part of the landlords surplus is transferred to consumers, which loses too some of their surplus, due to the haphazard and arbitrary allocation that distributes the housing service randomly or by favoritism, instead for whom valuates it most. Comparing New York renters and the characteristics of the house services rented with another free-market city with the same housing supply and demographic compositions, assuming that the demand would be constant across localities, they found a weak relation with the income of the families and the house rented and as more time the tenants are in a house the more misallocation can be found, not only by the reasons said before, also the tastes and conditions changes over time.
Moon and Stotsky (1993) studied the effects of rent control on housing quality discussing the transference of surplus from landlords to assists low and moderate income families, where direct spending programs would be more efficient or equitable. They suggested that rent control lowers the quality of the rental housing because landlords have no incentives or financial capacity to do the maintenance of the building, although it can be offset, the low rents and the long stays incentives the tenants to do it.
8
III.
A brief history of rent control in Portugal
In 1867 the Civil Code saw rent as a temporary lease contract. In the beginning of the century the pressures with urbanization’s quick growth changed the rules and rents become frozen to control the price escalade. Later during the First World War rents were frozen for all existing and new contracts and established many restrictions to regulate and guarantee allocation to everyone in a period of intense mobility.
The season was also marked by the devaluation of the Portuguese’s currency which together with the frozen rents brought imbalances in the rent market, with unreal, misallocated and outdated market values.
In 1948 actualizations became frozen just for Lisbon and Oporto and in the eve of the Revolution of 1974 many of the rents are outdated since the first war. Meanwhile
the old tenants’ benefit was being paid at higher rent costs by the new tenants, while the
housing park began to deteriorate. Instituted the Democracy, the rent regime was even more depressed, with landlords seeing their rent incomes and the property rights strangled with rents frozen and compulsive contracts for the incontrollable occupations.
Table 1 - Facts and Legislation from 1867 to 2006
Period Facts and Legislation
1867 - 1910 Civil Code 1867
- Rent saw as temporary contract lease of mobility - Limited time contracts renewed if no one dismisses it - Free rent values
- Evictions in case of tenants payment failure, bad use given or convenience of the landlord
- Landlords obligated to do maintenance of the building - Transmissible to successors after decease
- Disobedience crime in judicial decision eviction’s failure 1910 - 1914 Implantation of the Republic on 5th October of 1910
Pressure with urbanization’s quick growth
- Frozen rents for one year
- Advance time requirements of renewals’ opposition 1914 - 1918 First World War
(Emergency provisions effective for a year after the peace treaty) - Rents frozen to all existing and new contracts
- Obligation to rent derelict buildings
- Evictions by landlord convenience forbidden 1918 - 1926 After War –Devaluation of Portuguese’s currency
(Outdated market values)
- 1922: Rent actualizations according to matricidal taxable income and coefficients according to contact and building date (with no effects, also outdated and many rents was in foreign currency, latter was imposed the fixation to national currency)
1926 - 1948 Started the Dictatorial Regime (1926-1974)
- Complex rent actualizations based on matricidal values
- Rent liberalizations to new vacant buildings and for tenants with another habitation
- Allowed evictions by landlord convenience (rules suspended partially in 1928)
-1940: Evaluations to commercial buildings allowing new rents in line 1948 - 1966 Rents Frozen in Lisbon and Oporto
- Expropriation for public utility
- Caducity and transmission by divorce an decease regulated
- Rent actualizations according to matricidal values and evaluations to correct them
- Except Lisbon and Oporto: Rents frozen
- 1957: Allowed contract rescission to works intended to increase the capacity of the dwelling
1966 - 1974 Civil Code of 1966:
(maintained many of the previous dispositions) - free rents to first or new contracts
- evictions by landlords kept very restricted (non-temporary nature of rent contracts)
- Rent actualizations up to the twelfth of matricidal value phased in 5 years with evaluations to correct it
10
1974 - 1976 Ended the Dictatorial Regime and Started the Democracy - Rents frozen to urban buildings
- Suspension of evaluations and rent updates
- Suspension of contract rescission for demolishing, expansion of the dwelling and landlord own residence
- Obligation to rent and max rent values for old buildings
- Heavy restrictions to Landlords with compulsive contracts for legalization of occupied (expropriated) dwellings
- Measures to reallocate families in overload dwellings, injured by demolitions and the ones that couldn’t pay due to framework conditions
- Right of preference for tenants’ cohabitants in new contracts 1976 - 1985 An attempt to rebuild the rent market discipline
- Allowed evictions for landlord own residence and in some others cases - Right of tenants to buy the dwellings for own residence
- 1981: Established the free rent regime without rentupdates and conditional rent regime limited to 7% of the twelfth of dwelling’s value and updatable according to an annual coefficient approved by the government
- Revoked and reformulated the 1974 and 1975 dispositions
- Extraordinary rent updates by evaluations kept suspended except for commercial rents and due to improvement works
1985 - 1990 Law nº 46/85 – The Hope
- Rent actualization for all rents according to published coefficients
- Corrections for rents prior to 1980 by coefficients according to building condition and last update
- Improvements works could be reflected in rents
- Subside to compensate the rises in rent for low income tenants - Limited duration contracts
1990 - 2006 RAU – Urban Rent Regime
(Compilation of the many laws and dispositions, corrections of controversies and framework reforms)
- Founded on 1985 precepts as contracts of limited duration - Seek private autonomy on rent actualizations
- 1995: extended to commercial rents (DL nº 257/95)
- 2000: Improvement works possibility for landlords or tenants and many others issues as rent updates, evictions, subsidies regulated
Table 2 - New Urban Rent Regime - NRAU
General Rules
(compilation, review, easing and simplification of the many laws and disposition) - Contracts simplified in Housing and Non-Housing
- Regulates all the new and existing contracts
- Rent updates according to annual coefficients published - Extrajudicial resolution in case of 3 months payment failure
- Tenants can terminate any type of contract announcing it within 120 days - Penalties for derelict buildings
Limited Duration Contracts Renovation and Termination - Initial period ≥ 5 years and <30 years, renewed for periods of 3 years
- Landlord could just oppose to renewal announcing it within 1 year advance
Contracts prior to NRAU NEW Contracts
Termination in Unlimited Duration Contracts - For landlord own residence, to demolish or to
do improvement works announcing it within 6 months of advance
Condition: Tenant < 65 years
or live there for less than 30 years (those restrictions falls after transmission)
- Landlord own residence, demolish or improvement works announcing it within 6 months of advance or by convenience within 5 years of advance
Transmission - Housing: spouse, sons, stepsons and persons
residing in union with the tenant
- Non-Housing: successors who explores the activity for more than 3 years
- Housing: for spouse or people residing in union or common economy > 1 year
- Non-Housing: successors if they didn’t
renounce the transmission Transitory Rules for Contracts Prior to RAU and DL 257/95: Rent update:
- Up to the twelfth of 4% of the value of the leased, according to an evaluation in term of Municipal Property Taxation most recent than 3 years, multiplied by a factor of conservation from 0,5 to 1,2 according to conservation level in a scale of 1 to 5
- Conservation level ≤2: rent can’t be raised, obligation to do improvement works
- Tenants have the possibility to ask for evaluation and intimate the landlord to make improvement works or take the initiative of the works or even buy the dwelling
- Rent subsidy for low income tenants
Housing rent update phased: - 5 years: General rule
- 10 years: tenants ≥ 65 years old, deficiency > 60% of incapacity or annual gross income < 5 annual minimum remunerations
- 2 years: non-permanent residence or annual gross income > 15 annual min. remun.
Non-Housing rent update phased: - 5 years: General rule
12
IV.
Findings
To frame the analysis, let’s start to have a look over the evolution of the population
since 1991 to 2009 in Portugal, Lisbon City and the peripheral municipalities of Lisbon that have a completely different behavior. Lisbon is the one that presents the greater decrease in population over time, with a special emphasis to the population with more than 65 years old that have decreased with more expression in 2001 and after 2005.
Graph 1 - Population in Lisbon had decreased over time
Source: Author computation based on data from INE
Graph 2 - Lisbon has great levels of population with more than 65 years old
Source: Author computation based on data from INE -3% -2% -1% 0% 1% 2% 3% 4% 5% 6% 19 92 19 93 19 94 19 95 19 96 19 97 19 98 19 99 20 00 20 01 20 02 20 03 20 04 20 05 20 06 20 07 20 08 20 09 Annual Growth Mainland Total
Mainland ≥ 65
Great Lisbon w/o Lisbon City Total
Great Lisbon w/o Lisbon
City ≥ 65
Lisbon City Total
8% 10% 12% 14% 16% 18% 20% 22% 24% 26% 19 91 19 92 19 93 19 94 19 95 19 96 19 97 19 98 19 99 20 00 20 01 20 02 20 03 20 04 20 05 20 06 20 07 20 08 20 09
≥ 65 years % of total
Mainland ≥ 65
North ≥ 65
Center ≥ 65
Great Lisbon w/o Lisbon
City ≥ 65 Lisbon City ≥ 65
Alentejo ≥ 65
Lisbon is the City with the greater percentage of population with more than 65 years for all the periods, but after 2005 is the only city in the area maintaining its level of older population, while all the others have maintained its high growth levels.
As different regions and boroughs will be compared, the data will be presented as percentage of the total value for each geographic point to account for the different sizes. As Lisbon has 53 boroughs, I choose a few ones for each distinct type of borough such as Castelo, Santiago and Socorro, representing the boroughs from the hill of the Castle, where the old populations, low rent levels and low levels of population education are evident; Santa Justa, São Nicolau, Sacramento and Mártires representing the down-town of Lisbon, an area relatively more rich, with a bit higher levels of rent, but with high values of buildings crumbling; Encarnação and Santa Catarina, representing the known
“Bairro Alto”, with high levels of old population; São Mamede representing a second
line of boroughs around the center, where the effects of rent control aren’t so felt;
Campo Grande and São Sebastião da Pedreira, representing a third line of boroughs, here the rents are relatively higher than in the other areas and where the rent units are being converted in Owner Occupied ones; Lumiar, Santa Maria dos Olivais and Marvila as peripheral areas, where predominates the owner occupied dwellings, very low rents and specially for the last one, high percentages of social rents.
As rule for Lisbon, around 10% of the rent occupied units was being transformed in owner occupied units, with the great expression for Campo Grande and Santa Maria dos Olivais. For the peripheral areas the number of total dwellings increased, but the same
doesn’t applies for the central boroughs, where the crumbling dwellings dictated a
14 G rap h 3 L isb on d ec re ase in Re n te d an d T otal Occ u p ied Dw ell in gs (1991 to 20 01) Sourc e: A uthor com put at io n bas
ed on da
ta from IN E G rap h 4 Ow n er Occ u p ied are taki n
g the posi
tion to R en t Oc cu p ied Dw ell in gs, Ce n tr al B or ou gh s still h ave a h igh p er ce n tage of u n li m ite d d u ration r en t c on tr ac ts Sourc e: A uthor com put at io n bas
ed on da
ta
from
IN
E
-40% -30% -20% -10% 0% 10
% 20 % 30 % 40 % 50 % 60 % Mainland Noth Center Alentejo Algarve
Great Lisbon w/o Lisbon
Lisbon City Campo Grande Castelo Encarnação Lumiar Mártires Marvila Sacramento Santa Catarina Santa Justa
Santa Maria dos Olivais
Santiago
São Mamede
São Nicolau
S. Sebastião da Pedreira
Socorro O wne r O cc up ie d V ar iat io n as % o f 199 1 T o tal o cc up ie d dwe lli ng s T o tal O cc up ie d D w e lli ng Va riat io n (%) R e nt O cc up ie d Var iat io n as % o f 1 991 T o tal o cc up ie d dwe lli ng s
0% 10
Lisbon is the place where are less people living in an owner occupied dwelling, so
it’s the place that could be more affected with rent law changes, but is also the place
where the percentage of owner occupied dwellings growth more from 1991 to 2001. The boroughs of the Castle Hill are the ones that present the higher percentage of rented units, close to 70% and 80% of the total occupied units, where the unlimited duration
rents represents 80% to 90% of the total rented units. For “Bairro Alto” and Down
Town, the expression of rented units is not so high, and the unlimited duration contracts have a bit lower percentage. Very different are the case of peripheral boroughs with high percentages of owner occupied dwellings and where social rent represents a higher percentage of the rented units.
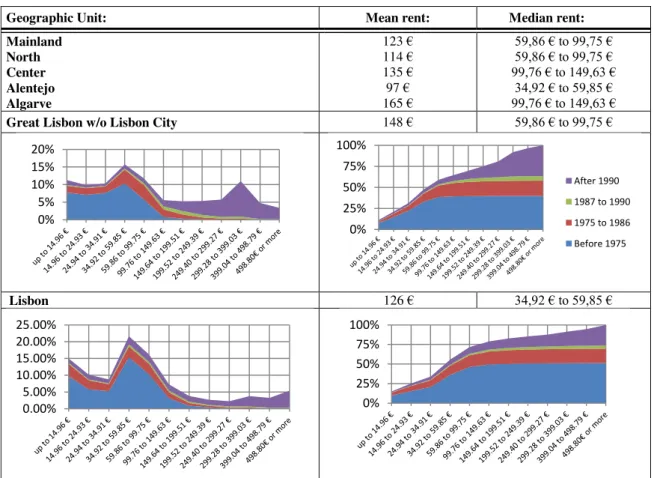
Table 3 – In 2001 Lisbon rents are strongly pushed to very low values with 75% of the contracts with values above the mean and 70% of contracts prior to 1986
Geographic Unit: Mean rent: Median rent:
Mainland North Center Alentejo Algarve
123 € 114 € 135 € 97 € 165 €
59,86 € to 99,75 € 59,86 € to 99,75 € 99,76 € to 149,63 €
34,92 € to 59,85 € 99,76 € to 149,63 €
Great Lisbon w/o Lisbon City 148 € 59,86 € to 99,75 €
Lisbon 126 € 34,92 € to 59,85 €
16
Castelo 54 € 14,96 € to 24,93 €
São Nicolau 127 € 34,92 € to 59,85 €
Marvila 55 € 24,94 € to 34,91 €
Source: Author computation based on data from INE
In terms of contracted rent values, Lisbon region was in 2001 one of the lowers median levels in the country, just surpassed by Alentejo. Lisbon city compared with the Great Lisbon without Lisbon has a first, second and third quartile of rent values generally in lower rent values than the others and an average rent level strictly above. Although compared to other areas, Lisbon as average rent level close to the mean of Mainland, which means that Lisbon as an high percentage of very low rents, but also some rents with high rent values.
0% 10% 20% 30% 40%
0% 25% 50% 75% 100%
0% 5% 10% 15% 20% 25% 30%
0% 25% 50% 75% 100%
0% 10% 20% 30% 40%
The gap is even greater if we look inside the boroughs of Lisbon, where for central ones the quartiles correspond to very low levels of rent. Especially for the Castle borough, which has the lowest mean and median, where the rents before 1975 represents 70% of the rent contracts and are pushing the rents for very low levels. For the Down-Town boroughs such as São Nicolau, the composition are similar to the Lisbon average, with 50% of rent contracts prior to 1975, but pushing the rents for bit higher level, with the contracts after 1991 pushing the rents to higher levels. We can notice the difference between the older and the newest contracts. For peripheral boroughs such as Marvilla, the values of the rents are very low, due to the quality and type of constructions in the area and also the social rent contracts, so each period of rent contracts are distributed for all levels of rent in a close proportion.
Table 4 - High levels of old population, living with no family and having very low levels of education in the central boroughs in 2001
Non-nuclear families
One person families with ≥ 65 years old
Populatio n ≥ 65 year old population without aca demic qualification Population with higher education Population living with pension %
Mainland 19.28% 8.87% 16.50% 11.38% 6.61% 20.20%
North 14.89% 6.94% 13.96% 12.06% 5.22% 17.90%
Center 19.34% 10.52% 19.45% 12.97% 5.29% 23.08%
Alentejo 21.30% 12.52% 22.34% 11.68% 4.46% 26.46%
Algarve 23.28% 9.54% 18.63% 11.19% 5.68% 20.75%
Grat Lisbon w/o Lisbon 20.46% 6.58% 12.61% 8.91% 9.58% 16.00%
Lisbon City 34.22% 14.38% 23.61% 8.47% 17.18% 26.30%
Campo Grande 35.24% 16.88% 28.57% 7.72% 18.57% 28.66%
Castelo 42.70% 24.20% 30.66% 10.56% 5.28% 37.31%
Encarnação 50.16% 20.07% 26.68% 9.59% 11.50% 29.20%
Lumiar 25.94% 5.98% 12.61% 7.01% 30.71% 14.89%
Mártires 53.33% 13.33% 23.46% 11.73% 18.77% 21.11%
Marvila 17.30% 7.29% 13.70% 11.72% 3.60% 20.24%
Sacramento 55.16% 19.51% 24.43% 9.20% 16.25% 27.16%
Santa Catarina 47.00% 20.23% 28.45% 9.02% 10.32% 32.05%
Santa Justa 49.40% 21.39% 32.43% 11.14% 6.29% 32.57%
Santiago 41.45% 21.50% 31.62% 11.20% 10.50% 34.42%
São Mamede 46.29% 18.87% 27.93% 7.26% 26.73% 28.30%
São Miguel 42.60% 19.74% 26.06% 11.82% 3.60% 32.58%
São Nicolau 53.72% 22.87% 32.51% 8.68% 9.11% 32.94%
São Sebastião da Pedreira 43.87% 18.07% 29.26% 6.78% 29.23% 24.37%
Socorro 45.97% 20.08% 25.94% 12.71% 4.71% 30.88%
18
The consequences are evident, the boroughs with higher values of rented units, unlimited duration rent contracts and high percentages of old contracts have higher values for indicators such as the percentage of non-nuclear families, most evident for the Down-Town boroughs, while the Castle Hill presents high values of population with more than 65 years old and high percentages of families of just one person with more than 65 years old, also high levels of people living with pension. For third line boroughs such as Campo Grande, the level of old population is high, although presenting an lower level for one person families with more than 65 years old, which means that despite having an high level of old population, they are living in family, maybe because, many of the houses there are owner occupied instead. Relatively to education level, the central boroughs present high levels of population without academic qualification, although Down-Town and “Bairro Alto” also have high levels of population with higher education. It gives us an idea of the fixation of old population, but also that different population with different backgrounds was searching the area.
Despite being areas of services and commerce, the population of “Bairro Alto” and
Down-Town, are not enjoying living in the same borough where they work, the levels are above the Lisbon mean, and for boroughs of Castle Hill the levels are even lower. Also revealing the fixation of population and especially for the Castle Hill, are the level of individuals living in the same borough since 1995 and individuals natural from the borough where they live, for other central boroughs those values aren’t so expressive.
occupied units. While for Down Town and third line boroughs, people are using dwellings with divisions in excess.
Table 5 - Population Fixation and high percentages of Derelict Buildings in the central boroughs, Divisions in lack or Excess
Working or studying in the same borough Natural from the borough where actually live Individual that live in the same borough since 1995 Index of divisions in excess Index of divisions in lack Partially derelict as % of 2001 total buildings
Totally derelict as % of 2001 total buildings Buildings needing repairs 2001
Mainland 24.88% 47.92% 78.88% 0.95 0.22 38.10%
North 24.44% 53.17% 79.34% 0.91 0.21 40.40%
Center 27.56% 59.14% 82.52% 1.21 0.12 37.30%
Alentejo 30.67% 57.16% 84.04% 1.01 0.15 35.10%
Algarve 35.21% 43.52% 76.98% 0.88 0.19 32.80%
Grat Lisbon w/o Lisbon 20.47% 27.58% 72.16% 0.71 0.21 36.18%
Lisbon City 15.35% 26.73% 77.22% 0.99 0.17 5.27% 3.52% 55.90%
Campo Grande 17.08% 24.05% 74.67% 1.27 0.12 0.48% 1.75% 36.30% Castelo 6.81% 47.36% 90.12% 0.43 0.30 8.85% 7.96% 25.60% Encarnação 15.93% 26.15% 76.52% 1.10 0.16 1.72% 3.02% 61.40% Lumiar 17.03% 21.99% 69.02% 0.94 0.13 0.53% 1.44% 38.90% Mártires 17.89% 26.69% 72.73% 1.56 0.14 26.67% 21.67% 61.60% Marvila 19.84% 33.03% 82.27% 0.62 0.26 7.13% 4.39% 68.70% Sacramento 15.57% 23.64% 68.98% 1.11 0.14 14.62% 2.31% 74.60% Santa Catarina 12.72% 28.38% 79.20% 1.01 0.17 2.45% 4.29% 77.10% Santa Justa 12.43% 19.00% 78.00% 1.09 0.15 43.92% 14.19% 78.30% Santiago 9.68% 33.37% 87.40% 0.92 0.19 24.40% 4.17% 54.70% São Mamede 13.72% 22.73% 73.68% 1.51 0.11 17.56% 6.54% 39.00% São Nicolau 11.91% 20.51% 73.62% 1.46 0.11 25.62% 6.20% 57.40% São Sebastião da Pedreira 18.99% 28.67% 75.95% 1.84 0.14 18.23% 4.70% 52.80% Socorro 12.56% 31.21% 81.79% 0.75 0.26 4.42% 2.72% 80.70%
Source: Author Computations based on Data from Census 2001 – INE;
Derelict buildings from Direcção Municipal de Conservação e Reabilitação Urbana
20
Graph 5 - Rent Actualizations Grew above the Price index since 1980, Price index Grew 50% and 185% more
Source: Author Computations based on Data from INE.
Actualization coefficients computed from factors in “Portal Habitação”
Rent actualizations was allowed in 1981 for conditional rent, while the free rent
regime doesn’t have, the situation was corrected in 1985 when was stated the
actualization for all contracts, although the free rents had already missed the actualizations in a period of high inflation, nevertheless the free rents could be less outdate at the time than the conditional rent. Even so the index of actualization since 1980 was above the price index for the same period and if we go back a while the difference is enormous. The reason for comparing the price index with the next year actualization index is because it is the one that incorporates the previous year inflation.
Extraordinary rent actualizations where stated to correct the prior to 1980 contracts, to the current date, at the time 1986, and then were update according to the annual
coefficients published. But those factors aren’t in line with the inflation index from the
same year until 1986. And the value of the factor for the first year was in farthest years about half of the factor in this table and in the next years the update is done according to
652.80 2 234.54 992.75 346.74 0 250 500 750 1000 1250 1500 1750 2000 2250 2500 19 76 19 78 19 80 19 82 19 84 19 86 19 88 19 90 19 92 19 94 19 96 19 98 20 00 20 02 20 04 20 06 20 08 20 10 Conditional Rent Actualization index 1981=100
Price index 1976=100
Price index 1980=100
one plus half of the annual coefficient published. The actualization became well short of the necessary.
Graph 6 - For contracts prior to 1980 the extraordinary actualization was insufficient for the early years, for the farthest the factor to apply in the first year
was about half of the global factor
Global correction coefficients to apply in 1986
year of last rent fixation
Municipalities of Lisbon and Oporto
Others Municipalities
Inflation Index Until 1986
w/o gate and w/o lift
w/o gate and w/ lift
w/ gate and w/o lift
w/ gate and w/ lift
Before 1955 6.51 7.15 7.79 8.42
3.48
1995 to 1959 5.98 6.51 7.05 7.57
1960 5.58 6.04 6.49 6.49
1961 4.9 5.22 5.54 5.86 4.091
1962 4.63 4.9 5.16 5.42 4.077
1963 4.62 4.89 5.14 5.4 4.07
1964 4.35 4.5 4.77 4.97 4.064
1965 3.97 4.12 4.28 4.43 4.044
1966 3.43 3.51 3.59 3.67 4.005
1967 3.18 3.952
1968 2.99 3.913
1969 2.94 3.46 3.896
1970 2.65 3.12 3.822
1971 2.64 3.11 3.804
1972 2.52 2.97 3.754
1973 2.32 2.73 3.676
1974 2.12 2.24 3.581
1975 1.65 1.65 3.392
1976 1.47 1.47 3.23
1977 1.31 1.31 3.067
1978 1.27 1.27 2.793
1979 1.21 1.21 2.573
Source: Inflation Index Author Computations based on Inflation excluding Housing Data from INE until 1977, before from Inflation Data from Google.
Actualization coefficients from Law nº 46/86
22
Graph 7 - Rent Actualizations Grew in line with the Price index since 1987, but above the House market index and Conservation costs
Source: Price Index and Conservation Costs - Author Computations based on Data from INE. Actualization coefficients computed from factors in “Portal Habitação”
CI index Author computations based on data from Confidencial Imobiliário
I will explain next is how the characteristics of the dwellings, boroughs, buildings and contracts could explain the average rent price and the accumulated percentage of buildings up to each rent level. Regressing for each corresponding rent level and the average the accumulate percentage of usual classic familiar residence rented or subleased dwellings falling before that level for each borough (53 observations). I used
this method because I don’t have a detailed data, just the number of contracts falling in
each rent level for each borough, so I can’t estimate a hedonic price model for the
controlled and uncontrolled market, instead I’ve to estimate both together and verify
whether having a greater percentage of old and unlimited contracts influences the number of houses falling before each rent quartile. The idea is to evaluate how the explanatory variables influence the accumulate level of dwellings falling before that rent level, so as great is the accumulate percentage for that level the more dwellings are falling before that rent level, so lower will be the rent (an increase in accumulate value
263 286 324 154 145 137 80 100 120 140 160 180 200 220 240 260 280 300 320 340 19 87 19 89 19 91 19 93 19 95 19 97 19 99 20 01 20 03 20 05 20 07 20 09
Actualization index 1988=100 Price index 1987=100 CI index Mainland 1987=100 CI index Lisbon Metropolitan Area 1987=100
Mainland Conservation cost index 1997=100
Lisbon Conservation Cost index 1997=100
CI index Lisbon Metropolitan Area 1997=100
is equal to a decrease in rents value). Accordingly as higher is the accumulate value compared to other boroughs, the lower are the rents in that borough.
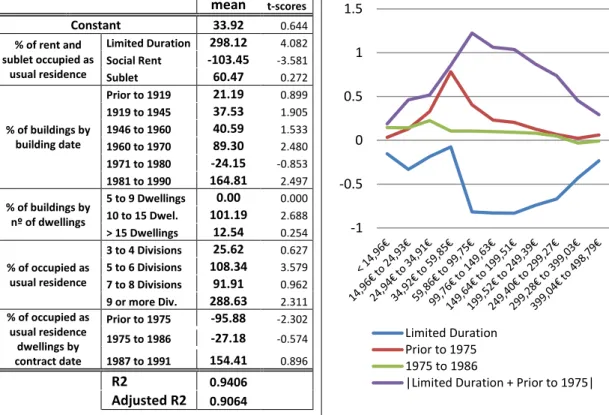
Table 6 - Model for the average borough rent value based on rent type, buildings’ date and nº of dwellings, nº of divisions and contract date, Graph with coefficients
based on the same model for each accumulated level of rent percentage
mean t-scores
Constant 33.92 0.644 % of rent and
sublet occupied as usual residence
Limited Duration 298.12 4.082 Social Rent -103.45 -3.581
Sublet 60.47 0.272
% of buildings by building date
Prior to 1919 21.19 0.899 1919 to 1945 37.53 1.905 1946 to 1960 40.59 1.533 1960 to 1970 89.30 2.480 1971 to 1980 -24.15 -0.853 1981 to 1990 164.81 2.497 % of buildings by
nº of dwellings
5 to 9 Dwellings 0.00 0.000 10 to 15 Dwel. 101.19 2.688 > 15 Dwellings 12.54 0.254 % of occupied as
usual residence
3 to 4 Divisions 25.62 0.627 5 to 6 Divisions 108.34 3.579 7 to 8 Divisions 91.91 0.962 9 or more Div. 288.63 2.311 % of occupied as
usual residence dwellings by contract date
Prior to 1975 -95.88 -2.302 1975 to 1986 -27.18 -0.574 1987 to 1991 154.41 0.896
R2 0.9406
Adjusted R2 0.9064
Source: Author Computations based on Data from INE
Each explanatory variable was expressed as percentage of the total of the belonging group, with different values for each borough, where each group has an omitted variable, so each of the coefficients should be compared with the omitted variable. So what we have is that an percentage point increase in the limited duration rent contracts,
will increase the average rent by 2.98 €. If we imagine an universe of one unlimited rent
with a contract prior to 1976, updating it for an limited rent in those days, the rent
should be 298.12€ plus 95.88€, 394€ higher. In the graph we have the same model -1 -0.5 0 0.5 1 1.5 Limited Duration Prior to 1975 1975 to 1986
24
applied to the percentage of houses falling before each rent level, where we can see that the contracts prior to 1975 are influencing the rent for contracts in lower levels of rent, while the limited duration rent contracts, with value closer to the market, are pushing the rents for higher values. Higher rent levels could be attained by transforming the contracts prior to 1975 in unlimited contracts, being more effective pushing the rent for levels greater than 24,94 € since many of the previous are explained by social rent
contracts.
V.
Conclusion
Old rent control laws established the rules on today rent market. Lisbon being one of expensive Portuguese cities, have high percentage of actual rent contracts falling in very low levels of monthly rent, and the results are known, the center of the cities is
crumbling as owners don’t have incentive and economical capacity to keep subsidizing
the old tenant with perverted and outdated rent contracts. Where to update the value of rents the landlords, already without economic capacity have to make the needing repairs and even revaluated its property in terms of municipal tax payment, to account for a 5 or more probably 10 years phased rent update, due to high percentage individuals with more than 65 years.
processes, municipal taxes increases in line with the reevaluation, high phasing time of the update and the landlord could be obligated to do maintenance works before increasing the rent.
Sawing the question in the other way, currently it’s easier to evict a tenant due to
the non-payment of the rents or even to do structural works in the building. But the lack of rent units in the market, also established high prices for new contracts, having a look to currently square meter price for rent from CI data, the most inflicted by the rent controls boroughs are the ones where the prices are higher, such as Down-Town and Castle which is leading the table, a contrast with the very low rents evidenced. It is just to say that evicted tenants don’t have an alternative.
The solution which I propose, in line with the agreement with the “Troika”, is to obligate evaluations and rent updates, with subsidies to tenants instead of phasing updates. The equality in the rent market should be restored and it will allow the convergence of the high prices charged in the market lowering them as well the old lower rents converge to higher values and then the market should work by itself
26
Note 1 - For Further Studies
It will be interesting to analyze again when the data for census 2011 where released. The expected result for 2011 is a decrease in limited rent contract effect since they become more usual and with more weight while Unlimited rent contracts should became more close to the market conditions and to evaluation of the dwellings. With the date of contract becoming less related with the unlimited rent contract and so more expressive in explaining the lower rent levels.
It will be also interesting to analyze the effects of rent control losses on the population’s mobility, unsound and derelict buildings and current market prices. Also the especial rent updates in terms of the NRAU, analyzing the amplitude of rent update according to the conditions of the contract, I asked this data, but I had no answer.
VI.
References
Arnott, Richard. 1995. “Time for Revisionism on Rent Control?”. The Journal of Economic Perspectives, 9(1): 99-120.
Cabral, Luís. 2006. “Small firms in Portugal: A selective survey of stylized facts, economic
analysis, and Policy implications” presented in conferences Desenvolvimento Económico Portugues no Espaço Europeu, Economic Studies, Banco de Portugal. Friedman, Milton, and George J. Stigler. 1946. “Roofs or Ceilings? The Current Housing
Problem”. Popular Essays on Current Problems. Foundation for Economic Education. Glaeser, Edward L., and Erzo F. P. Luttmer. 2003. “The Misallocation of Housing under Rent
Control”. The American Economic Review, 93(4): 1027-1046.
Johnson, D. Gale. 1951. “Rent Control and the Distribution of Income”. The American Economic Review, 41(2), Papers and Proceedings of the Sixty-third Annual Meeting of the American Economic Association: 569-582.
Miller, Roger L., Daniel K. Benjamin, and Douglass C. North. 2009. “Bankrupt Landlords, from Sea to Shining Sea.” In The Economics of Public Issues, 16th edition, Addison Wesley.
Moon, Choon-Geol, and Janet G. Stotsky. 1993. “The Effect of Rent Control on Housing Quality Change: A Longitudinal Analysis”. The Journal of Political Economy, 101(6): 1114-1148.
Eurofound. 2004. First European Quality of Life Survey 2003. Dublin: European Foundation for the Improvement of Living and Working Conditions.
Eurofound. 2009. Second European Quality of Life Survey 2007. Dublin: European Foundation for the Improvement of Living and Working Conditions.
CML. 2005. “Planeamento Habitação e Mercado Imobiliário na Área Metropolitana de Lisboa”. Colecção de Estudos Urbanos – Lisboa XXI. Lisboa, July 2005 – 2nd edition. Câmara Municipal de Lisboa - Licenciamento Urbanístico e Planeamento Urbano.
INE. 2010. Estatísticas da Construção e da Habitação - 2009. Lisboa: Instituto Nacional de Estatística.
INE. 2010. Anuário Estatistico da Região Lisboa 2009. Lisboa: Instituto Nacional de Estatística.
INE. 2002. Censos - Resultados definitivos. Região Lisboa – 2001. Lisboa: Instituto Nacional de Estatística.
Annex I
Other Bibliography
Basu, Kaushik, and Patrick Emerson. 2000. “The Economics of Tenancy Rent Control”. The
economic Journal, 110(466): 939-962.
Basu, Kaushik and Patrick Emerson. 2003. “Efficient Pricing, Tenancy Rent Control and Monopolistic Landlords”. Economica, New Series, 70(278): 223-232.
Breen, Richard. 1997. “Inequality, Economic Growth and Social Mobility”. The British Journal of Sociology, 48(3): 429-449.
Caudill, Steven B. 1993. “Estimating the Costs of Partial-Coverage Rent Controls: A Stochastic Frontier Approach”. The Review of Economics and Statistics. 75(4): 727-731.
Caudill, Steven B., Richard W. Ault, and Richard P. Saba. 1989. “Efficient Estimation of the Costs of Rent Controls”. The Review of Economics and Statistics, 71(1): 154-159. Fallis, George and Lawrence B. Smith. 1984. “Uncontrolled Prices in a Controlled Market: The
Case of Rent Controls”. The American Economic Review, 74(1): 193-200.
Lewis, Thomas J., and R. Andrew Muller. 1992. “Contracting out of Rent Control”. Canadian Journal of Political Science, 25(3): 557-572.
Melo, Inês Q. 2009. “O Mercado de Arrendamento: Principais Oportunidades e Fragilidade Face ao Mercado de Habitação Própria”. MSc diss. Instituto Superior Técnico. Moon, Choon-Geol, and Janet G. Stotsky. 1993. “Efficient Estimation of the Costs of Rent
Controls: A comment”. The Review of Economics and Statistics, 75(1): 184-187. Olsen, Edgar O. 1988. “What do Economists Know About the Effect of Rent Control on
Housing Maintenance?” Journal of Real Estate Finance and Economics, 1: 295-307. Salgueiro, Teresa B. 2002. “Desenvolvimento Urbano de Lisboa”. Revista de Estudos
Annex III
Lisbon decrease in Rented and Total Occupied Dwellings
Annex V
Percentage of Owner and Rent Occupied Dwellings,
Percentage Point Variation and Total Occupied Dwelling
Variation from 1991 to 2001
Occupied Dwellings Weight in 2001
(% of Lisbon - Value: 221868)
Owner Occupied Dwellings Total Occupied
Dwelling Variation
(%)
Rent Occupied Dwellings
Geographic Unit Weight 1991 (%) Weight 2001 (%) Variation of the weight (P.P.) Variation of the weight (P.P.) Weight 1991 (%) Weight 2001 (%) Mainland 1537 64.21 75.38 11.17 16.39 -7.12 27.74 20.62
Noth 532 60.97 73.62 12.65 20.74 -7.76 29.36 21.60
Center 373 78.41 85.25 6.84 12.39 -3.13 15.06 11.93
Alentejo 128 68.08 79.58 11.50 5.11 -6.22 21.10 14.88
Algarve 64 66.59 75.70 9.11 24.92 -4.46 23.34 18.89
Great Lisbon w/o
Lisbon City 221 61.14 72.73 11.59 25.96 -8.47 32.49 24.02 Lisbon City 100 33.83 47.91 14.08 -2.53 -11.70 59.42 47.72
Ajuda 3.19 33.66 47.93 14.28 -8.67 -13.25 61.72 48.47
Alcântara 2.81 32.73 41.42 8.68 -13.54 -6.39 61.27 54.88
Alto do Pina 1.87 41.96 54.80 12.84 9.03 -9.10 49.44 40.34
Alvalade 1.90 35.70 44.82 9.13 -2.48 -7.08 56.06 48.98
Ameixoeira 1.57 41.79 52.51 10.72 2.08 -6.12 50.91 44.79
Anjos 1.89 28.62 39.97 11.36 -13.62 -11.03 66.05 55.02
Beato 2.59 34.05 38.70 4.64 -0.42 -2.36 59.98 57.62
Benfica 7.48 48.24 60.51 12.27 3.59 -8.33 43.38 35.05
Campo Grande 1.98 17.25 59.91 42.66 7.72 -42.45 77.00 34.54
Campolide 2.78 34.28 41.87 7.59 -16.61 -0.55 54.55 54.01
Carnide 2.83 49.98 50.99 1.02 52.72 4.12 41.04 45.16
Castelo 0.12 7.27 11.65 4.38 -19.39 -3.46 90.30 86.84
Charneca 1.13 28.39 20.38 -8.01 15.89 16.37 59.89 76.26
Coração de Jesus 0.84 34.11 39.72 5.61 -9.85 -2.85 57.21 54.36
Encarnação 0.62 17.48 30.48 13.00 19.83 -13.51 79.04 65.53
Graça 1.34 27.75 31.95 4.20 -11.94 -2.20 67.88 65.69
Lapa 1.60 29.01 40.30 11.29 -10.94 -9.97 63.70 53.74
Lumiar 6.11 54.52 72.71 18.19 28.94 -13.86 36.79 22.92
Madalena 0.07 3.24 15.53 12.28 -12.97 -15.49 91.89 76.40
Mártires 0.06 9.30 26.61 17.31 -3.88 -19.20 83.72 64.52
Marvila 5.35 14.97 24.95 9.99 0.41 -6.82 79.61 72.80
Mercês 1.00 22.02 32.49 10.47 -8.03 -9.76 73.26 63.50
Nossa Sra. de Fátima 2.83 31.15 47.09 15.94 -6.83 -14.83 60.87 46.04
Pena 1.17 17.33 28.62 11.29 -9.64 -8.68 75.93 67.25
Penha de França 2.70 31.24 45.46 14.22 -10.53 -12.93 63.90 50.97
Prazeres 1.47 42.34 38.93 -3.41 -12.13 4.98 51.85 56.83
Santa Justa 0.13 18.37 20.34 1.97 -33.11 0.54 74.38 74.92
Santa Maria de Belém 1.72 42.94 50.24 7.30 -8.61 -6.67 51.48 44.80 Santa Maria dos
Olivais 7.75 42.69 72.49 29.79 10.07 -28.49 53.39 24.90
Santiago 0.17 12.13 15.28 3.15 -21.97 -2.63 83.05 80.43
Santo Condestável 3.46 28.44 39.38 10.94 -8.57 -9.00 64.93 55.92
Santo Estêvão 0.45 28.69 22.52 -6.17 -25.56 6.07 68.41 74.47
Santos-o-Velho 0.78 21.51 28.37 6.86 -19.41 -6.42 73.59 67.17
S.Cristóvão
S.Lourenço 0.35 15.46 20.15 4.69 -21.79 -1.38 78.01 76.64
S. Domingos de
Benfica 6.13 48.33 62.53 14.20 11.97 -11.33 43.38 32.06
São Francisco Xavier 1.38 69.48 73.89 4.41 6.13 -3.26 23.03 19.78
São João 3.03 31.82 44.64 12.82 -14.80 -9.50 61.36 51.86
São João de Brito 2.47 35.12 49.13 14.01 -5.78 -13.73 58.48 44.75
São João de Deus 2.12 27.80 40.52 12.72 -10.57 -11.71 64.48 52.77
São Jorge de Arroios 3.43 27.43 39.58 12.15 -16.12 -9.86 64.49 54.64
São José 0.66 16.96 28.38 11.42 -16.85 -10.02 77.82 67.80
São Mamede 1.14 23.88 36.92 13.04 -6.92 -10.46 67.18 56.72
São Miguel 0.36 11.29 17.62 6.33 -22.87 -4.51 84.78 80.27
São Nicolau 0.21 6.55 24.19 17.64 -13.30 -16.47 88.39 71.92
São Paulo 0.67 17.50 25.47 7.97 -14.10 -5.94 76.91 70.98
S. Sebastião Pedreira 1.10 21.20 44.33 23.13 -16.76 -20.66 68.60 47.95
São Vicente de Fora 0.87 17.74 27.89 10.14 -10.60 -9.43 78.29 68.87
Sé 0.23 12.09 23.93 11.84 -23.28 -11.09 82.69 71.60
Socorro 0.52 14.48 23.75 9.27 -32.40 -8.83 83.01 74.18
Annex VI
Accumulated percentage of Dwellings by monthly rent value
in 2001 (€)
less than 14,96 14,96 to 24,93 24,94 to 34,91 34,92 to 59,85 59,86 to 99,75 99,76 to 149,63 149,64 to 199,51 199,52 to 249,39 249,40 to 299,27 299,28 to 399,03 399,04 to 498,79 Average monthly rent (€)
Mainland 15.81 25.53 34.52 48.24 59.38 68.47 76.72 83.51 89.11 95.80 98.11 123 North 15.30 24.58 33.99 45.99 57.07 68.89 79.49 87.43 93.01 98.17 99.31 114 Center 15.46 23.07 29.58 38.83 47.94 59.53 71.78 82.31 90.53 97.81 99.39 135 Lisbon 14.78 25.75 35.58 53.32 66.04 72.06 76.76 80.98 85.17 92.63 96.35 126 Alentejo 27.40 37.99 46.23 57.16 65.79 74.49 82.24 88.36 93.20 97.91 99.26 97 Algarve 14.42 21.81 28.46 37.79 44.58 50.83 59.61 69.46 81.13 95.46 98.53 165 Great Lisbon w/o Lisbon 11.23 21.02 31.28 46.94 58.57 64.17 69.51 74.93 80.76 91.81 96.61 148 Lisbon City 15.01 25.16 33.87 55.34 71.38 78.63 82.52 85.23 87.51 91.30 94.56 118
Ajuda 18.90 35.82 46.69 72.01 81.36 85.21 88.38 90.62 92.66 95.97 98.45 81
Alcântara 13.64 23.00 33.53 61.34 75.84 80.74 84.55 86.97 89.10 92.76 96.22 106
Alto do Pina 6.87 17.03 25.43 52.20 69.35 76.34 80.04 82.03 84.50 87.90 91.96 136
Alvalade 2.82 6.70 14.88 42.78 65.89 76.22 79.95 82.58 84.11 87.13 90.96 147
Ameixoeira 32.00 42.33 51.53 68.44 76.08 79.65 82.59 86.98 90.23 95.80 98.06 91
Anjos 7.36 16.58 24.96 46.02 66.33 74.53 78.47 81.22 84.48 88.75 93.95 138
Beato 19.16 31.35 41.62 64.97 77.04 81.48 84.16 86.69 88.61 93.64 97.53 99
Benfica 8.16 18.76 27.41 56.28 74.67 80.26 82.94 84.97 86.91 90.73 94.90 118
Campo Grande 7.90 12.86 18.60 35.44 73.37 81.79 85.05 87.14 88.84 90.73 92.89 126
Campolide 16.85 27.02 36.84 55.07 68.39 77.04 82.74 86.59 88.83 92.65 95.97 114
Carnide 30.75 44.10 53.25 71.58 84.56 90.33 94.02 95.58 96.28 97.39 98.05 64
Castelo 35.06 56.28 68.40 80.09 86.58 90.91 92.21 94.81 97.40 98.70 98.70 54
Charneca 26.08 41.50 50.43 63.98 74.78 83.16 88.38 92.95 96.25 99.59 100.0 75
Coração de Jesus 6.90 15.06 23.71 41.69 65.01 74.44 80.56 83.97 86.01 89.89 92.81 138
Encarnação 13.17 23.00 34.13 51.84 64.04 70.52 75.92 79.37 83.05 90.17 95.25 136
Graça 16.46 26.98 37.04 59.86 73.42 78.56 82.57 85.37 87.35 92.07 96.34 111
Lapa 9.25 18.96 25.55 44.05 63.52 72.92 77.16 79.71 81.81 85.39 88.71 155
Lumiar 23.84 29.32 34.76 51.81 65.43 73.84 77.28 79.94 81.70 84.29 87.08 150
Madalena 12.70 23.02 32.54 42.86 60.32 69.05 73.81 78.57 82.54 88.89 93.65 147
Mártires 4.94 9.88 22.22 39.51 58.02 70.37 76.54 81.48 83.95 86.42 91.36 155
Marvila 30.79 45.05 55.26 72.94 85.43 91.98 95.56 97.25 98.19 99.09 99.59 55
Mercês 13.53 23.80 35.25 53.30 66.83 74.32 78.42 82.44 85.84 89.94 94.17 129
Nossa Sra. de Fátima 5.22 10.84 17.18 40.30 60.62 70.54 76.24 79.17 81.62 85.54 89.12 161
Pena 12.89 23.37 32.06 48.93 62.50 69.11 73.49 77.19 81.84 89.18 93.50 146
Penha de França 13.23 23.81 31.62 56.21 73.15 77.93 81.09 83.64 85.64 91.13 96.45 118
Prazeres 18.53 30.24 39.72 59.42 73.38 79.13 82.85 84.88 87.49 91.75 94.46 113
Sacramento 9.02 20.08 31.15 49.18 54.92 67.21 72.95 76.64 80.33 88.11 93.44 154
Santa Catarina 13.78 27.55 37.69 54.02 66.10 72.29 76.32 80.88 85.29 91.10 95.90 128
Santa Engrácia 11.68 21.03 31.84 59.61 70.89 75.37 78.44 81.31 84.05 91.99 97.40 121
Santo Condestável 14.21 22.79 29.96 50.79 70.09 76.96 80.15 82.52 85.10 89.48 93.29 130
Santo Estêvão 25.07 40.50 51.72 64.38 74.14 79.82 84.96 89.45 93.27 97.36 99.21 86
Santos-o-Velho 17.67 28.66 39.39 57.31 70.75 77.77 81.83 84.28 86.73 91.80 94.93 116
S. Cristóvão e S.
Lourenço 23.15 35.47 43.35 59.93 68.47 73.89 79.80 85.22 89.49 94.58 96.55 110
São Domingos de
Benfica 5.55 12.04 19.26 50.86 68.22 76.03 78.69 81.10 82.61 86.83 91.84 143
São Francisco Xavier 4.40 7.01 9.79 29.20 51.71 65.58 67.86 70.47 72.27 75.53 78.96 214
São João 10.15 19.29 28.45 56.40 73.99 79.45 82.65 85.04 87.35 92.13 96.51 114
São João de Brito 5.97 11.97 20.76 48.37 70.70 76.74 81.74 83.43 85.13 88.19 91.09 137
São João de Deus 2.23 6.46 11.97 28.80 57.88 72.80 77.78 80.73 83.01 85.96 88.71 165
São Jorge de Arroios 5.57 13.36 19.66 38.54 60.57 72.18 77.17 80.18 82.55 86.29 91.09 155
São José 9.94 20.68 30.12 49.50 64.31 71.47 75.84 79.22 83.50 90.95 95.33 137
São Mamede 7.26 13.76 20.60 39.70 58.18 68.45 72.96 76.18 78.51 82.34 85.56 177
São Miguel 24.39 37.12 47.24 62.27 70.09 77.45 82.36 86.66 93.40 97.24 98.62 95
São Nicolau 7.44 18.75 30.06 53.87 67.86 75.89 78.27 81.55 84.52 92.56 95.54 127
São Paulo 12.93 24.28 35.44 53.77 65.21 71.91 75.91 79.35 83.63 90.98 96.19 131
S. Sebastião da Pedreira 6.23 11.29 16.26 28.81 51.81 67.90 75.82 80.45 83.32 85.43 87.87 171
São Vicente de Fora 20.04 30.77 39.57 57.47 67.68 73.89 78.40 82.03 85.87 93.42 97.04 118
Sé 16.62 29.22 36.73 53.62 68.10 76.14 80.16 83.38 85.79 91.42 94.64 123
Socorro 18.84 31.96 42.24 59.70 70.55 76.60 82.19 85.05 89.84 96.35 99.09 102
Annex VII
Population and Families
Non-nuclear families One person families
with ≥ 65
years old
Population
≥ 65 year
old population without ac ademic qualificatio n Population with higher education Population living with pension %
Mainland 19.28% 8.87% 16.50% 11.38% 6.61% 20.20%
North 14.89% 6.94% 13.96% 12.06% 5.22% 17.90%
Center 19.34% 10.52% 19.45% 12.97% 5.29% 23.08%
Lisbon 23.33% 8.64% 15.40% 8.97% 10.47% 18.94%
Alentejo 21.30% 12.52% 22.34% 11.68% 4.46% 26.46%
Algarve 23.28% 9.54% 18.63% 11.19% 5.68% 20.75%
Grat Lisbon w/o Lisbon 20.46% 6.58% 12.61% 8.91% 9.58% 16.00%
Lisbon City 34.22% 14.38% 23.61% 8.47% 17.18% 26.30%
Ajuda 31.55% 14.24% 25.52% 9.45% 7.67% 31.45%
Alcântara 37.33% 16.78% 29.00% 8.53% 13.37% 33.51%
Alto do Pina 34.74% 14.32% 22.51% 8.06% 23.12% 23.34%
Alvalade 38.54% 20.60% 35.27% 5.59% 28.61% 31.54%
Ameixoeira 23.71% 6.68% 12.86% 10.28% 14.70% 17.34%
Anjos 43.74% 19.15% 28.85% 8.32% 14.74% 30.75%
Beato 31.77% 13.99% 23.16% 9.42% 9.65% 29.65%
Benfica 29.99% 10.90% 21.15% 7.35% 18.34% 25.20%
Campo Grande 35.24% 16.88% 28.57% 7.72% 18.57% 28.66%
Campolide 35.57% 15.22% 23.95% 8.89% 11.72% 26.81%
Carnide 21.41% 6.74% 13.48% 9.54% 16.86% 17.16%
Castelo 42.70% 24.20% 30.66% 10.56% 5.28% 37.31%
Charneca 17.60% 7.65% 12.56% 12.96% 1.35% 16.87%
Coração de Jesus 54.43% 18.62% 27.48% 7.50% 19.19% 28.48%
Encarnação 50.16% 20.07% 26.68% 9.59% 11.50% 29.20%
Graça 38.42% 17.47% 29.63% 8.69% 11.25% 33.48%
Lapa 38.16% 17.25% 27.94% 8.12% 25.21% 27.17%
Lumiar 25.94% 5.98% 12.61% 7.01% 30.71% 14.89%
Madalena 51.53% 17.86% 27.11% 7.37% 12.37% 29.21%
Mártires 53.33% 13.33% 23.46% 11.73% 18.77% 21.11%
Marvila 17.30% 7.29% 13.70% 11.72% 3.60% 20.24%
Mercês 48.61% 21.24% 27.19% 9.46% 16.16% 29.28%
Nossa Sra. de Fátima 40.81% 15.79% 27.20% 6.79% 26.62% 25.47%
Pena 51.58% 19.19% 27.37% 9.71% 12.41% 29.65%
Penha de França 39.91% 18.62% 29.67% 9.62% 12.22% 33.05%
Prazeres 39.58% 15.29% 24.58% 8.71% 20.08% 27.18%
Sacramento 55.16% 19.51% 24.43% 9.20% 16.25% 27.16%
Santa Maria de Belém 34.92% 16.69% 28.70% 7.25% 19.02% 29.91% Santa Maria dos Olivais 22.41% 10.49% 24.23% 8.97% 12.89% 29.04%
Santiago 41.45% 21.50% 31.62% 11.20% 10.50% 34.42%
Santo Condestável 40.43% 18.77% 28.35% 8.60% 16.44% 30.11%
Santo Estêvão 45.99% 23.48% 30.58% 10.55% 6.11% 37.71%
Santos-o-Velho 41.53% 20.33% 28.13% 10.02% 13.61% 31.72% S. Cristóvão e S. Lourenço 53.11% 21.92% 27.61% 9.99% 7.94% 31.89% São Domingos de Benfica 32.50% 11.98% 20.82% 6.20% 27.97% 22.85% São Francisco Xavier 27.20% 9.87% 19.52% 6.34% 33.79% 19.00%
São João 35.44% 16.98% 26.74% 9.44% 10.82% 30.24%
São João de Brito 33.95% 18.45% 33.45% 6.65% 24.76% 31.14% São João de Deus 41.28% 21.23% 33.13% 5.39% 28.95% 29.91% São Jorge de Arroios 46.40% 19.20% 30.00% 7.53% 19.42% 29.96%
São José 52.44% 20.43% 29.71% 9.98% 11.17% 31.76%
São Mamede 46.29% 18.87% 27.93% 7.26% 26.73% 28.30%
São Miguel 42.60% 19.74% 26.06% 11.82% 3.60% 32.58%
São Nicolau 53.72% 22.87% 32.51% 8.68% 9.11% 32.94%
São Paulo 42.29% 16.80% 24.74% 9.37% 9.86% 28.71%
São Sebastião da Pedreira 43.87% 18.07% 29.26% 6.78% 29.23% 24.37% São Vicente de Fora 43.26% 19.27% 28.43% 9.61% 10.12% 34.45%
Sé 46.34% 19.05% 29.74% 9.31% 13.02% 33.79%
Socorro 45.97% 20.08% 25.94% 12.71% 4.71% 30.88%
Annex VIII
Population Fixation, Divisions in lack or Excess and Derelict
Buildings
Working or studying in the same borough Natural from the borough where actualy live Individual that live in the same borough since 1995 Index of divisions in excess Index of divisions in lack Partially derelict as % of 2001 total buildingsTotally derelict as % of 2001 total buildings Buildings needing repairs 2001
Mainland 24.88% 47.92% 78.88% 0.95 0.22 38.10%
North 24.44% 53.17% 79.34% 0.91 0.21 40.40%
Center 27.56% 59.14% 82.52% 1.21 0.12 37.30%
Lisbon 19.92% 28.72% 73.81% 0.79 0.19 38.80%
Alentejo 30.67% 57.16% 84.04% 1.01 0.15 35.10%
Algarve 35.21% 43.52% 76.98% 0.88 0.19 32.80%
Grat Lisbon w/o Lisbon 20.47% 27.58% 72.16% 0.71 0.21 36.18%
Lisbon City 15.35% 26.73% 77.22% 0.99 0.17 5.27% 3.52% 55.90%
Ajuda 14.32% 37.60% 84.09% 0.69 0.23 0.94% 3.69% 62.10%
Alcântara 16.86% 30.55% 80.07% 0.88 0.17 1.14% 2.67% 68.00%
Alto do Pina 11.23% 21.41% 74.48% 1.09 0.15 5.25% 1.93% 61.80%
Alvalade 13.90% 21.21% 80.85% 1.36 0.12 3.95% 0.63% 66.30%
Ameixoeira 11.34% 23.42% 74.38% 0.58 0.24 0.51% 3.04% 66.30%
Anjos 11.97% 22.63% 75.27% 1.29 0.14 2.10% 5.10% 64.10%
Beato 13.26% 31.28% 82.05% 0.66 0.25 3.16% 5.03% 48.20%
Benfica 15.10% 27.29% 80.04% 0.83 0.17 1.88% 2.02% 37.20%
Campo Grande 17.08% 24.05% 74.67% 1.27 0.12 0.48% 1.75% 36.30%
Campolide 17.50% 32.22% 75.87% 0.76 0.26 0.70% 3.91% 65.00%
Carnide 14.67% 22.29% 68.96% 0.67 0.22 0.54% 1.52% 78.00%
Castelo 6.81% 47.36% 90.12% 0.43 0.30 8.85% 7.96% 25.60%
Charneca 14.60% 28.18% 62.54% 0.39 0.31 0.68% 1.03% 59.80%
Coração de Jesus 15.07% 23.20% 74.25% 1.38 0.14 5.26% 5.64% 61.80% Encarnação 15.93% 26.15% 76.52% 1.10 0.16 1.72% 3.02% 61.40%
Graça 12.33% 26.59% 78.32% 0.99 0.16 18.75% 5.82% 53.60%
Lapa 15.47% 28.63% 77.70% 1.32 0.14 12.30% 4.86% 60.40%
Lumiar 17.03% 21.99% 69.02% 0.94 0.13 0.53% 1.44% 38.90%
Madalena 11.05% 21.05% 76.05% 1.64 0.11 31.08% 12.16% 59.40% Mártires 17.89% 26.69% 72.73% 1.56 0.14 26.67% 21.67% 61.60%
Marvila 19.84% 33.03% 82.27% 0.62 0.26 7.13% 4.39% 68.70%
Mercês 14.39% 30.28% 77.05% 1.03 0.18 5.77% 2.04% 48.70%
Nossa Senhora de Fátima 18.50% 23.86% 74.66% 1.36 0.14 4.90% 3.80% 44.10%
Pena 11.24% 23.42% 74.98% 0.98 0.17 11.79% 3.39% 63.90%
Penha de França 13.04% 26.56% 78.69% 0.88 0.17 0.98% 0.91% 64.30%
Santa Isabel 15.27% 27.36% 75.30% 1.10 0.17 12.36% 3.60% 54.90% Santa Justa 12.43% 19.00% 78.00% 1.09 0.15 43.92% 14.19% 78.30% Santa Maria de Belém 17.55% 28.15% 78.64% 1.17 0.15 2.79% 5.58% 46.80% Santa Maria dos Olivais 16.25% 24.83% 79.55% 1.05 0.16 0.39% 3.54% 38.40%
Santiago 9.68% 33.37% 87.40% 0.92 0.19 24.40% 4.17% 54.70%
Santo Condestável 16.75% 36.21% 80.81% 0.91 0.19 1.06% 1.64% 75.80% Santo Estêvão 8.45% 35.27% 84.03% 0.57 0.26 30.73% 11.45% 77.00% Santos-o-Velho 14.03% 39.35% 80.19% 1.12 0.18 12.23% 4.60% 58.80% S. Cristóvão e S. Lourenço 8.37% 27.36% 75.62% 0.77 0.24 10.53% 3.83% 60.70% São Domingos de Benfica 15.05% 20.84% 75.14% 0.94 0.15 11.65% 2.05% 42.60% São Francisco Xavier 15.85% 20.86% 74.83% 1.40 0.10 0.10% 2.81% 25.00%
São João 12.73% 28.51% 79.95% 0.74 0.21 1.45% 1.72% 64.70%
São João de Brito 14.21% 22.72% 82.65% 1.44 0.11 10.83% 2.49% 29.70% São João de Deus 14.68% 20.54% 78.71% 1.61 0.11 0.37% 3.05% 44.40% São Jorge de Arroios 16.60% 23.39% 75.99% 1.35 0.13 2.93% 2.81% 62.80%
São José 12.69% 24.62% 76.94% 1.06 0.15 20.04% 7.75% 69.70%
São Mamede 13.72% 22.73% 73.68% 1.51 0.11 17.56% 6.54% 39.00% São Miguel 9.06% 40.41% 80.87% 0.45 0.31 26.07% 3.30% 44.50% São Nicolau 11.91% 20.51% 73.62% 1.46 0.11 25.62% 6.20% 57.40% São Paulo 15.54% 29.20% 77.73% 1.10 0.17 19.41% 12.03% 59.00% São Sebastião da Pedreira 18.99% 28.67% 75.95% 1.84 0.14 18.23% 4.70% 52.80% São Vicente de Fora 13.78% 29.48% 78.46% 0.76 0.19 1.75% 3.50% 57.10% Sé 10.60% 25.69% 77.50% 1.47 0.14 26.84% 5.79% 82.60%
Socorro 12.56% 31.21% 81.79% 0.75 0.26 4.42% 2.72% 80.70%
Source: Author Computations based on Data from Census 2001 – INE;