AR
TICLE
1 Diretoria Técnico-Científica, Instituto Nacional de Criminalística, Polícia Federal. SAS 07 LT 23, Setor Policial Sul. 70610-200 Brasília DF Brasil. aline.minervino14@ gmail.com
2 Faculdade de Medicina, Universidade de Brasília. Brasília DF Brasil.
Loss and damage affecting the public health sector and society
resulting from flooding and flash floods in Brazil between
2010 and 2014 - based on data from national and global
information systems
Abstract This article outlines the results of a descriptive study that analyses loss and damage caused by hydrometeorological disasters in Brazil between 2010 and 2014 using the EM DAT (glob-al) and S2iD (nation(glob-al) databases. The analysis shows major differences in the total number of disaster events included in the databases (EM-DAT = 36; S2iD = 4,070) and estimated costs of loss and damage (EM-DAT – R$ 9.2 billion; S2iD – R$331.4 billion). The analysis also shows that the five states most affected by these events are Santa Catarina, Rio Grande do Sul, Minas Gerais, São Paulo and Paraná in Brazil’s South and Southeast regions and that these results are consistent with the findings of other studies. The costs of disasters were highest for housing, pub-lic infrastructure works, collectively used pubpub-lic facilities, other public service facilities, and state health and education facilities. The costs associ-ated with public health facilities were also high. Despite their limitations, both databases demon-strated their usefulness for determining seasonal and long-term trends and patterns, and risk ar-eas, and thus assist decision makers in identifying areas that are most affected by and vulnerable to natural disasters.
Key words Natural disasters,
Hydrometeorolog-ical disaster, Flooding, Damage assessment, Da-tabase
M
ine
rv
ino
A
C,
D
Introduction
Disaster is defined as a serious disruption in the functioning of a community or society involving widespread human, material, economic and en-vironmental loss and damage, which exceeds the ability of the affected community or society to cope using its own resources1. Climate events
lar-gely associated with unplanned growth in cities in areas that are unsuitable for occupancy are res-ponsible for the occurrence of natural disasters2.
These events are the result of a combination of four factors that have implications for public health: 1) the occurrence of natural threats; 2) an exposed population; 3) the social and environ-mental vulnerability of this population; 4) lack of capacity to reduce the potential risks and public health consequences of disasters3.
Although human history has always been marked by natural disasters, this problem is in-creasingly part of everyday life as the number and extent of disasters has increased sharply4,5,
resulting in over 3.3 million registered disaster -related deaths over the last 40 years6. The
econo-mic consequences of disasters between 2000 and 2010 amounted to a trillion dollars, and disas-ter relief during the same period accounted for around 20% of all humanitarian aid7. Disasters
have a significant impact on agriculture and re-lated systems and adversely affect the health and education sector, which in turn has negative con-sequences for the long-term economic and social development of affected communities8.
Brazil occupies a prominent position in the world in terms of number of natural disasters over recent years. An assessment of the occur-rence of natural disasters during the period 1991 and 2010 showed that there were 31,909 disasters in the country2 and an increase in the frequency
and intensity of storms and the number of pe-ople directly and indirectly affected by extreme climate events9. Although this increase is partly
due to improvements in the recording and dis-semination of information related to disasters, these figures are also the result of an increase in the rate of urbanization, deforestation, environ-mental degradation and climate change2,4,10.
The most common types of disaster in Brazil during this period were, in order of frequency: droughts, flash floods, flooding, strong winds, hailstorms, erosion, forest fires, landslides, torna-dos, pluvial flooding and frost. Although the se-cond most common type of disaster, flash floods accounted for most human losses and impacts, followed by flooding11. Disasters related to
alte-rations in the normal water cycle, such as flash floods, flooding and pluvial flooding, are known as hydrometeorological disasters12. Due to
Bra-zil’s size, diverse atmospheric conditions and a large hydrological network comprising of over 55,457 km of watercourses, all regions of Bra-zil are subject to extreme hydrometeorological events at some time throughout the year2.
Apart from causing human damage, flooding, flash floods and pluvial flooding have an impact
on the environment and human development3.
Socioeconomic effects include: damage and des-truction of income sources and physical struc-tures, such as houses, buildings and roads; bre-aking of flood protection dykes and fuel tanks; interruption of water, electricity and gas supplies, and transport and communication services; in-terruption of health, education and commercial services; adverse effects on agricultural activities; and loss and damage of personal goods and items of sentimental value3.
In 2012, the Law Nº 12608/12 created the
In-tegrated Disaster Information System (Sistema
Integrado de Informações sobre Desastres - S2iD), a joint database run by the Ministry of National Integration and utilized by civil defense agen-cies at national, state and local level13. Decision
makers also use global databases14 to help
identi-fy areas that are most affected by and vulnerable to natural disasters, the most prominent of
whi-ch is the Emergency Events Database(EM-DAT).
The EM-DAT was created in 1988 and is run by the Centre for Research on the Epidemiology of Disasters (CRED) at the Catholic University of Leuven in Belgium.
Comparative studies show significant dif-ferences between disaster databases concerning information regarding the number of people affected by disasters and loss and damage9,14,15.
Despite an unquestionable focus on the human losses and impacts caused by disasters, little re-search has been carried out into disaster-related material losses. This study therefore aims to esti-mate, compare and contrast the material losses caused by hydrometeorological disasters in Bra-zil between 2010 and 2014 based on information obtained from the EM-DAT and S2iD databases.
Materials and methods
aúd
e C
ole
tiv
a,
21(3):685-694,
2016
obtained from these databases, the study estima-ted the occurrence of, and loss and damage cau-sed by, hydrometeorological disasters in Brazil during the period 2010 to 2014.
Disasters must meet at least one of the following EM-DAT entry criteria: 10 or more de-aths; 100 or more affected people; declaration of a state of emergency or calamity; there is a call for international assistance16.
The S2iD compiles information on disasters in Brazil including location (municipality), type of disaster, date of occurrence, causes and effects, and human, material and environmental loss and damage. This information is recorded on a spe-cific form filled in by a member of the Civil De-fense Agency or locally responsible government agency, which must be sent within 120 hours af-ter the occurrence of the disasaf-ter.
All hydrometeorological disasters contained on the EM-DAT and S2iD databases that occurred between 2010 and 2014 and resulted in loss and damage were considered eligible for the study.
The relevant data was inputted into an Excel spreadsheet using the following categories: year, type of disaster, number of occurrences, the cost of resulting loss and damage (in Brazilian Real – R$), and, for disasters registered on the S2iD, type of loss and damage.
The costs of loss and damage on the S2iD and EM-DAT are calculated in Brazilian Real (R$) and US dollars, respectively. To enable compari-son, loss and damage in dollars was converted to Brazilian Real based upon the average annual ex-change rate obtained from the Brazilian Central Bank’s website17.
Spending on housing made through the
Minha Casa Minha Vida (My House, My Life) program was calculated based on total spending since the program was created in 2009 up to 15 October 2014 using information available on the website Portal Brasileiro de Dados Abertos - Indi-cadores sobre Minha Casa Minha Vida18.
Health sector spending between 2010 and 2014 was calculated based on the total amount of funding for the purchase of equipment, per-manent material, and material for the Mobile
Emergency Care Service (Serviço de
Atendimen-to Móvel de Urgência – SAMU), primary heal-th centers, and healheal-th services and pre-hospital fixed services provided by the comprehensive emergency care network throughout Brazil. This information is available on the Health with More Transparency website of the Ministry of Health19.
The study used only secondary data from the databases that is available to the public. As a
result, after written inquiry, the Research Ethics Committee of the University of Brasília (CEP -UnB, acronym in Portuguese) waived the requi-rement to apply for ethical approval.
Results
The analysis of information on hydrometeoro-logical disasters contained in the EM-DAT and S2iD databases concerning flooding, flash floods and pluvial flooding in Brazil between 2010 and 2014 showed that there were considerable diffe-rences in information, both in terms of the num-ber of occurrences (36 compared to 4,070, res-pectively) and loss and damage (9.2 compared to R$ 331.4 billion, respectively). Loss and damage caused by hydrometeorological disasters in Brazil registered by the EM-DAT was less than that re-corded by the S2iD (Table 1) for each year during the period 2010 to 2014.
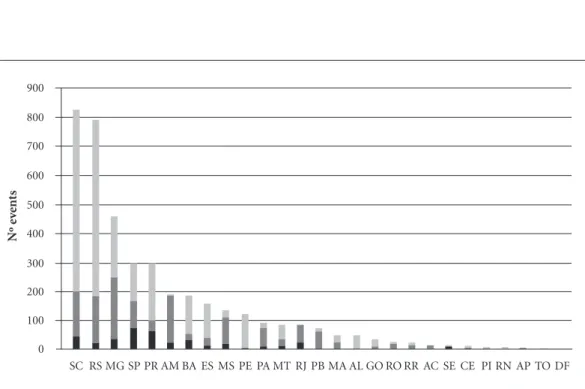
The analysis of the data obtained from the S2iD also shows that the five states most affec-ted by flooding, flash floods, and pluvial flooding during the period were Santa Catarina (n = 826), Rio Grande do Sul (n = 792), Minas Gerais (n = 461), São Paulo (n = 299) and Paraná (n = 297), which are all located in the South and Southeast Regions of the country (Figure 1). Flash floods were most frequent in Santa Catarina (n = 627), followed by Rio Grande do Sul (n = 607), Mi-nas Gerais (n = 213), Paraná (n = 198), Bahia (n = 132), São Paulo(n = 130), Espírito Santo (n = 120), Pernambuco (n = 116), Mato Gros-so (n = 52) and Alagoas (n = 46). The 10 states most affected by flooding were Minas Gerais (n = 213), Rio Grande do Sul (n = 163), Amazonas (n = 162), Santa Catarina (n = 153), São Paulo (n = 94), Mato Grosso do Sul (n = 91), Pará (n = 65), Paraíba (n = 63), Rio de Janeiro (n = 62) and Paraná (n = 36). Pluvial flooding was most fre-quent in the states of São Paulo (n = 75), Paraná (n = 63), Santa Catarina (n = 46), Minas Gerais (n = 35), Bahia (n = 33), Rio de Janeiro (n = 25), Amazonas (n = 24), Rio Grande do Sul (n = 22), Mato Grosso do Sul (n = 19), and Espírito Santo (n = 12).
M
ine
rv
ino
A
C,
D
The analysis of loss and damage cost data shows a decreasing trend over the period (Tab-le 1): in 2014 the cost was R$ 6.9 billion, a 61% reduction in relation to 2010 (R$ 205.7 billion). Damage to housing and public infrastructure works was particularly high between 2010 and 2011, compared to the previous period. For example, the cost of damage to houses in 2010 was R$ 136 billion, compared to R$ 2 billion in 2014. This peak in 2010 and 2011 is due to high levels of damage to housing and public infras-tructure in the states of Rio de Janeiro, São Paulo, Minas Gerais, Santa Catarina, Paraná and Per-nambuco in 2010, and in the states of Espírito
Santo, São Paulo, Rio Grande do Sul and Santa Catarina in 2011 (Figure 3).
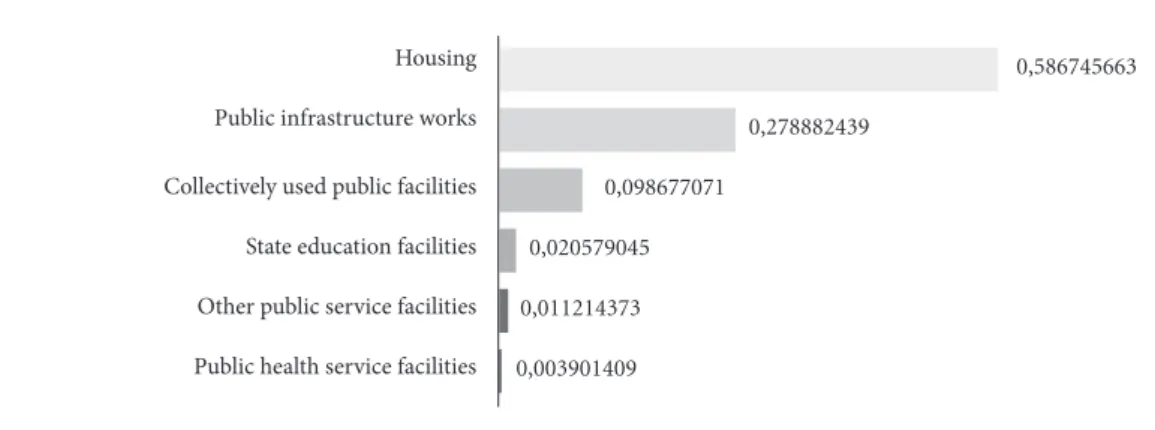
According to S2iD data, destruction or da-mage of housing accounted for the large majori-ty of total loss and damage (58.7%), followed by public infrastructure works (27.9%), and public facilities (9.9%) (Figure 4).
The data showed that the cost of damage to housing caused by hydrometeorological disasters between 2010 and 2014 was R$ 194 billion, while public spending on housing between 2009 and
2014 was R$ 89 billion, through the Minha Casa
Minha Vida program, and spending in the health sector between 2010 and 2014 on the purchase of permanent material and the construction of fa-cilities was R$ 4 billion. During the same period, the cost of loss and damage caused by hydrome-teorological disasters to public health facilities was R$ 1.2 billion.
Discussion
The present study describes variations in the no-tification of occurrences of hydrometeorological disasters and associated loss and damage in
Bra-2014
6.89 0 Database/
Year
S2iD EM-DAT
2010
205.71 2.82
2011
109.53 3.35
Table 1. Costs associated with loss and damage caused by the hydrometeorological disasters occurring between 2010 and 2014 included in the S2iD and EM-DAT (R$ billion).
2012
0.023 0.67
2013
9.24 2.34
Figure 1. Number of hydrometeorological disasters between 2010 and 2014 by state included in the S2iD. Federation unity
Nº e
ve
nts
0 100 200 300 400 500 600 700 800 900
SC RS MG SP PR AM BA ES MS PE PA MT RJ PB MA AL GO RO RR AC SE CE PI RN AP TO DF
aúd
e C
ole
tiv
a,
21(3):685-694,
2016
zil. The number of events registered by the S2iD was notably greater than that recorded by the EM-DAT. Furthermore, the analysis of S2iD data
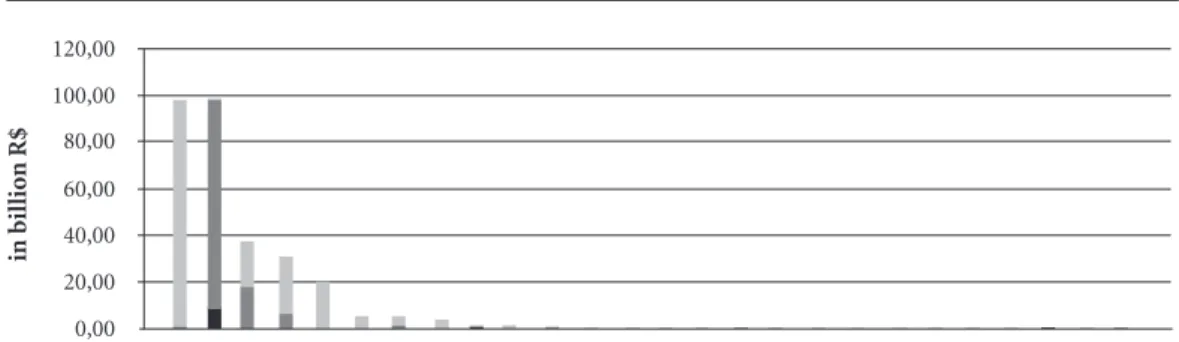
showed that occurrences and loss and damage between 2010 and 2014 was greatest in the states of São Paulo, Minas Gerais, Espírito Santo, Santa
Figure 2. Loss and damage caused by hydrometeorological disasters occurring between 2010 and 2014 included in the S2iD by state (R$ billion).
Federation unity
in bil
lio
n R$
0,00 20,00 40,00 60,00 100,00 120,00
80,00
SP RJ ES SC RS BA MG PE SE PR AM RO MS PA AL AC RR MT MA GO CE PB RN TO PI AP DF
pluvial flooding flash floods flooding
Figure 3. Loss and damage caused by hydrometeorological disasters in Brazil by year between 2010 and 2014 according to the S2iD (R$ billion).
Year 0,00
50 150
100
2010 250
200
2011 2012 2013 2014
em bilhões d
e R$
Public health service facilities State education facilities Other public service facilities Collectively used public facilities Public infrastructure works Housing
M
ine
rv
ino
A
C,
D
Catarina, Rio Grande do Sul, and Paraná. Both databases revealed a downward trend in disasters during the study period.
A comparative analysis of disaster notifi-cations in both databases during the period in question showed that coverage of hydrometeoro-logical events (flooding, flash floods and pluvial flooding) was considerably greater (113 times) in the S2iD. Furthermore, the estimated cost of loss and damage was 36 times greater according to the S2iD.
The EM-DAT estimates costs based on dama-ge to property and agriculture16, while the S2iD
only considers loss and damage related to public health, education and other service facilities, housing and public infrastructure works20. Since
the S2iD does not consider agriculture, it would be expected that estimated costs are lower than those recorded in the EM-DAT; however, this was actually not the case. This is probably due to the adoption of different event inclusion criteria for each database, which leads to a considerably higher number of notifications in the S2iD. This observation corroborates the findings of other studies that have shown that the EM-DAT re-cords a significantly lower number of events than Brazilian disaster data sources9,10.
The EM-DAT has been compiling informa-tion on disasters around the world since 1900 using various sources, such as agencies of the United Nations (UN), nongovernmental orga-nizations, insurance companies, research institu-tions and news agencies9,14. The database has
glo-bal reach and credibility among universities and research institutions since it clearly presents data collection and storage methodology10 and is used
by various institutions, including the UN, to
in-form natural disaster mitigation and prevention actions and policies21.
The S2iD was created in 2012 as a joint data-base used by national, state and local civil defense agencies13 and offers up-to-date information on
disaster prevention, mitigation, alert, response and recovery across the country13.
The Civil Defense Agency or locally responsi-ble government agency must fill in specific forms and documents available on the S2iD and send them to the SINPDEC within 120 hours (five days) after the occurrence of the disaster22.
According to Ministerial Order Nº 526/2012-MI, the aim of the S2iD is to computerize the transfer of central government funding to state and local governments in regions hit by disasters where a state of emergency or calamity has been declared20,23.
A state of emergency or calamity is declared to return a situation to normal at the earliest fea-sible time. It is the Civil Defense Agency’s task to restore normality by working together with other institutions and society22. A state of emergency is
understood as an intense and serious change in normal conditions in a given municipality, sta-te or region that partially compromises response capacity, while a state of calamity is an intense and serious change in normal conditions that considerably compromises response capacity. A state of public calamity is the consequence of im-portant, intense, and significant human, material and environmental loss and damage, which is of-ten irreversible or where recovery is particularly difficult20.
According S2iD data, the five states with the largest number of notifications of hydrometeo-rological disasters between 2010 and 2014, in
or-Figure 4. Loss and damage caused by hydrometeorological disasters in Brazil between 2010 and 2014 by type, according to the S2iD.
0,003901409 0,011214373 0,020579045
0,098677071
0,278882439
0,586745663
Housing
Public infrastructure works
Collectively used public facilities
State education facilities
Other public service facilities
aúd
e C
ole
tiv
a,
21(3):685-694,
2016
der of frequency, were Santa Catarina, Rio Gran-de do Sul, Minas Gerais, São Paulo and Paraná, while the greatest losses were registered in the states of São Paulo, Rio de Janeiro, Espírito Santo, Santa Catarina and Rio Grande do Sul. All these states are located in Brazil’s South and Southeast regions. These results are consistent with the fin-dings of other studies2,11.
This situation is probably associated with unplanned urban growth and environmental degradation in these regions5 and heavy rainfall
events during the rainy season2. Furthermore,
high population density in these regions means that a greater number of people and buildings are exposed and vulnerable to disasters24, thus
me-aning that impacts tend to be more severe and costly8.
Apart from material losses, the damage and destruction of housing affects the physical and emotional integrity of residents25. Over half of
the losses and damage caused by the hydromete-orological disasters included in the S2iD for the period 2010 to 2014 were housing-related. This could be explained by rapid urban growth, evi-denced by the increase in the number of munici-palities in Brazil over the last two centuries, from 1,121 municipalities in 1900 to 1,890 in 1950,
and reaching 5,565 in 201026. Unplanned urban
growth in Brazil’s cities has led to the construc-tion of housing on areas that are unsuitable for occupancy and therefore more vulnerable to di-sasters. Hydrometeorological disasters present a major human development challenge, particu-larly in rapidly growing cities in developing cou-ntries8.
The Minha Casa Minha Vida program, co-ordinated by the National Housing Secretariat of the Ministry of Cities, aims to make housing accessible to families with a gross monthly in-come of up to R$ 1,600. Spending on housing through this program up to October 2014 was R$ 89 billion18. The figures show that the costs
of damage to housing caused by hydrometeoro-logical disasters between 2010 and 2014 (R$ 194 billion) were 2.18 times greater than spending
during the same period through the Minha Casa
Minha Vida program. This situation shows that it is necessary to increase spending on housing and the prevention of potentially damaging na-tural events.
Despite comprising a relatively small pro-portion of total disaster-related costs (0.39%), another aspect that deserves highlighting is the damage caused to public health facilities (R$ 1.2 billion): the cost of damage caused by
hydrome-teorological disasters to public health facilities was equivalent to 30% of total government spen-ding on material and equipment and new heal-th facilities during heal-the period in question (R$ 4 billion).
The Pan American Health Organization (PAHO) estimates that 73% of the population and 67% of health facilities in Latin America and the Caribbean were located in risk zones in 2012. Between 1982 and 2012, at least one in eight he-alth facilities in Latin America was severely affec-ted by natural disasters, interrupting operations and leaving over 24 million people without any access to health services over a period of months or even years27,28.
The main limitation of this study is that it is difficult to verify the reliability and accuracy of secondary data. Inconsistencies were found between EM-DAT and S2iD data regarding no-tifications of hydrometeorological disasters and, consequently, in loss and damage estimates. This problem may be due to the use of different event inclusion criteria and data collection and storage methods, the low number of disasters registered by EM-DAT for Brazil, and the overestimation of loss and damage by local and state government managers in an attempt to obtain external fun-ding. The main aim of the forms used for the S2iD is disaster notification, rather than measu-rement of overall loss and damage caused by a disaster. Disasters must be notified within a short space of time (120 hours), meaning that the in-formation given about damage is not likely to be an accurate estimate of overall loss and damage.
A report produced by the World Bank in 2014 specifies measures that can be adopted to mini-mize the effects of disasters, including the crea-tion of an effective nacrea-tional disasters fund, stren-gthening the financial management of disaster aid programs and improvements in disaster data collection and management systems29. Despite
li-mitations associated with the use of varying data collection concepts and methodologies in diffe-rent countries, the EM-DAT is an easily accessible global disaster database, while the S2iD provides records of the type of disasters covered by this study over the period in question.
These kinds of databases are valuable tools for epidemiological research and enabling, for example, the creation of historical data to assess the vulnerability of particular states or regions
and inform budget forecasting30,31. Improving
im-M
ine
rv
ino
A
C,
D
pacts of flooding and the planning and funding of measures to minimize disasters should be part of current development thinking and included in wider development goals8.
Conclusions
The interdisciplinary and intersectoral nature of disaster prevention and response requires public health managers to have a broad perspective of the process and the formulation of policies and actions geared directly towards addressing the social and environmental determinants of di-sasters3. Quality data concerning the causes and
consequences of disasters is therefore critical to inform prevention and mitigation plannning and intersectoral responses. However, despite the existence of a special department of the Ministry of Health – the Health Surveillance Secretariat – where such matters are discussed, this topic is given little attention in the Public Health field in Brazil.
The analysis of large databases allows resear-chers to identify seasonal and long term trends and patterns, and risk areas3, and this study shows
the usefulness of national and international in-formation systems. The EM-DAT global database uses stricter event inclusion criteria and therefore only more specific, medium and large-scale di-sasters are entered, leaving out many small but relevant disasters; while the coverage of the S2iD national database is wider and includes small-s-cale disasters. However, the latter system is likely to notify events as disasters often when they do not meet the appropriate definition of disaster - “an event that exceeds local response capacity”.
This study aims to promote debate among government managers, especially those working
in the health sector, regarding the occurrence of and damage caused by desasters to inform inter-sectoral prevention and mitigation policies and improve disaster preparedness and response. The EM-DAT global database compiles data on disasters in Brazil and is particularly useful for national government managers, while the S2iD includes data on national, state and local-level disasters, making it an excellent source of infor-mation for national, state and local government managers.
Certainly the worst aspect of disasters is loss of human life, injury and other health impacts and the social suffering they induce. However, the assessment of loss and damage is important to inform decision making regarding the alloca-tion of resources and assistance to the affected population and the prevention of further loss and damage from future events. The present stu-dy therefore serves as a tool to promote debate on this topic and mobilize government mana-gers and society. The challenge of coping with disasters is common to many cities and tends to be accentuated by climate change. It is therefo-re necessary to therefo-reflect on this issue and develop sustainable solutions to ensure the coexistence of society and environment32.
aúd
e C
ole
tiv
a,
21(3):685-694,
2016
Collaborations
AC Minervino and EC Duarte participated equally in all stages of preparation of the article.
References
International Strategy for Disaster Reduction, United Nations (UN). Words Into Action: A Guide for Imple-menting the Hyogo Framework. Genebra: UN; 2007. Centro Universitário de Estudos e Pesquisas sobre De-sastres (CEPED). Atlas Brasileiro de Desastres Naturais 1991 a 2010: volume Brasil. Florianópolis: UFSC; 2011. Freitas CM, Silva DRX, Sena ARM, Silva EL, Sales LBF, Carvalho ML, Mazoto ML, Barcellos C, Costa AM, Oliveira MLC, Corvalán C. Desastres naturais e saúde: uma análise da situação do Brasil. Cien Saude Colet
2014; 19(9):3645-3656.
Leaning J, Guha-Sapir D. Natural Disasters, Armed Conflict, Public Health. N Engl J Med 2013; 369(19): 1836-1842.
Tominaga L K, Santoro J, Amaral R. Desastres Naturais: conhecer para prevenir. São Paulo: Instituto Geológico-da Secretaria do Meio Ambiente do Governo do Estado de São Paulo; 2009.
Freitas CM, Miranda ES, Osorio-de-Castro CGS. A redução dos riscos de desastres naturais como de-safio para a saúde coletiva. Cien Saude Colet 2014; 19(9):3628-3628.
United Nations (UN), World Bank. Natural hazards, unnatural disasters the economics os effective prevention.
Washington: UN; 2010.
Grupo Banco Mundial. Cidades e Inundações: um guia para a gestão integrada do risco de inundação urbana para o século XXI. Washington: Banco Internacional para Reconstrução e Desenvolvimento; 2012.
Marcelino EV, Nunes LH, Kobiyama M. Banco de da-dos de desastres naturais: análise de dada-dos globais e regionais. Caminhos da Geografia 2006; 6(19):130-149. Carmo R, Anazawa T. Mortalidade por desastres no Brasil: o que mostram os dados. Cien Saude Colet 2014; 19(9):3669-3681.
Centro Universitário de Estudos e Pesquisas sobre De-sastres (CEPED). Atlas Brasileiro de Desastres Naturais 1991 a 2012: volume Brasil. Florianópolis: UFSC; 2013. Secretaria Nacional de Defesa Civil (SENAD). Glossário de Defesa Civil. Estudos de riscos e medicina de desastres.
Brasília: Ministério da Integração Nacional; 2010. Brasil. Lei nº 12.608, de 10 de abril de 2012.Institui a Política Nacional de Proteção e Defesa Civil - PNPDEC; dispõe sobre o Sistema Nacional de Proteção e Defesa Civil - SINPDEC e o Conselho Nacional de Proteção e Defesa Civil - CONPDEC e outras providências. Diário Oficial da União 2012; 11 abr.
Peduzz P, Dao H, Herold C. Mapping Disastrous Nat-ural Hazards Using Global Datasets. Natural Hazards
2005; 35:265-289.
Pimenta-de-Souza P, Miranda ES, Osorio-de-Castro CGS. Preparação da assistência farmacêutica para de-sastres: um estudo em cinco municípios brasileiros.
Cien Saude Colet 2014; 19(9):3731-3742.
Emergency Events Database. The International Di-saster Database. [Online]. Centre for Research on the Epidemiology of Disasters. [acessado 2015 mar 3]. Dis-ponível em: http://www.emdat.be/.
Banco Central do Brasil. Taxas de Câmbio. [Online] [acessado 2015 maio 15]. Disponível em: http://www4. bcb.gov.br/pec/taxas/port/ptaxnpesq.asp?id=txcotacao 1.
2.
3.
4.
5.
6.
7.
8.
9.
10.
11.
12.
13.
14.
15.
16.
M
ine
rv
ino
A
C,
D
Brasil. Ministério das Cidades (MC). Indicadores so-bre Minha Casa Minha Vida. [Online]. [acessado 2015 ago 20]. Disponível em: http://dados.gov.br/dataset/ minha-casa-minha-vida.
Brasil. Ministério da Saúde (MS). Saúde Com Mais Trans-parência. [Online]. [acessado 2015 maio 21]. Disponível em: http://aplicacao.saude.gov.br/portaltransparencia/ visao/dadosTransparencia.jsf?uf = %27AM%27. Centro Universitário de Estudos e Pesquisas sobre De-sastres (CEPED). Capacitação dos gestores de defesa civil para uso do Sistema Integrado e Informações sobre De-sastres (S2iD). Florianópolis: CAD UFSC; 2012. International Strategy for Disaster Reduction (ISDR), United Nations (UN). Living with Risk: A global review of disaster reduction initiatives. Genebra: UN; 2004. Centro Universitário de Estudos e Pesquisas sobre De-sastres (CEPED). Capacitação Básica em Defesa Civil.
Florianópolis: CAD UFSC; 2012.
Brasil. Portaria nº526, de 6 de setembro de 2012. Es-tabelece procedimentos para a solicitação de reconhe-cimento de Situação de Emergência ou de Estado de Calamidade Pública por meio do Sistema Integrado de Informações sobre Desastres - S2ID. Diário Oficial da União 2012; 10 set.
Furtado F, Priori Júnior L, Alcantara E. Mudanças Cli-máticas e Resiliência de Cidades. Recife: Pickimagem; 2015.
Siena M, Valencio NFLS. Moradias Afetadas pelas Chu-vas: dimensões objetivas e subjetivas dos danos pelo recorte de gênero. In: III Encontro da ANPPAS; Brasília; 2006.
Instituto Brasileiro de Geografia e Estatística (IBGE).
Atlas do Censo Demográfico 2010. Rio de Janeiro: IBGE; 2013.
Organização Pan-Americana da Saúde (OPAS). O Meio Ambiente e a Segurança Humana. Brasília: OPAS; 2012. Organización Panamericana de la Salud (OPAS). Un Sector Salud Mejor Preparado y Más Seguro frente a De-sastres en Las Américas: Plan Estratégico 2008-2012. Wa-shington: Oficina Regional de la Organizacíon Mundial de La Salud; 2007.
Grupo Banco Mundial. Lidando com perdas: opções de proteção financeira contra desastres no Brasil. Washig-ton: Banco Internacional para Reconstrução e Desen-volvimento; 2014.
Silva DRD. Proposta conceitual de um gerenciamento de resposta a desastres. Rio de Janeiro: PUC-RIO; 2015. Xavier DR, Barcellos C, Barros HS, Magalhães MAFM, Matos VP, Pedroso MM. Organização, disponibilização e possibilidades de análise de dados sobre desastres de origem climáticae seus impactos sobre a saúde no Bra-sil. Cien Saude Colet 2014; 19(9):3657-3668.
Silva EAB, Suassuna CCA, Furtado MFRG, Bezerra OG. Resiliência e Vulnerabilidade de Cidades Brasileiras: Lições Aprendidas com os Desastres da Região Serrana do Rio de Janeiro e da Zona da Mata de Pernambuco. In: VI Encontro Nacional da Anppas 18 a 21 de setembro de 2012. Belém, Brasil: Anppas; 2012.
Article submitted 07/10/2015 Approved 17/12/2015
Final version submitted 19/12/2015 18.
19.
20.
21.
22.
23.
24.
25.
26.
27. 28.
29.
30. 31.