Original Article
Artigo Original
The contrast between alveolar and velar
stops with typical speech data: acoustic and
articulatory analyses
O contraste entre oclusivas alveolares e
velares em dados típicos de fala: análises
acústica e ultrassonográfica
Roberta Michelon Melo1Helena Bolli Mota1 Larissa Cristina Berti2
Keywords
Speech Ultrasonography Speech Acoustics Adult Child
Descritores
Fala
Ultrassonograia
Acústica da Fala Adulto Criança
Correspondence address: Roberta Michelon Melo
Universidade Federal de Santa Maria – UFSM
Rua Marechal Floriano Peixoto, 1751, Centro, Santa Maria (RS), Brazil, CEP: 97015-372.
E-mail: [email protected]
Received: June 19, 2016
Accepted: January 15, 2017
Study carried out at Programa de Pós-graduação em Distúrbios da Comunicação Humana, Universidade Federal de Santa Maria – UFSM - Santa Maria (RS), Brazil.
1 Universidade Federal de Santa Maria – UFSM - Santa Maria (RS), Brazil. 2 Universidade Estadual Paulista – UNESP - Marília (SP), Brazil.
Financial support: Coordenação de Aperfeiçoamento de Pessoal de Nível Superior (CAPES) (Edital CAPES
025/2011). The irst author received a doctoral scholarship from the Coordenação de Aperfeiçoamento de Pessoal
de Nível Superior (CAPES) and the Fundação de Amparo à Pesquisa do Estado do Rio Grande do Sul (FAPERGS).
Conlict of interests: nothing to declare. ABSTRACT
Purpose: This study used acoustic and articulatory analyses to characterize the contrast between alveolar and velar stops with typical speech data, comparing the parameters (acoustic and articulatory) of adults and children with typical speech development. Methods: The sample consisted of 20 adults and 15 children with
typical speech development. The analyzed corpus was organized through ive repetitions of each target-word (/’kapə/, /‘tapə/, /‘galo/ e /‘daɾə/). These words were inserted into a carrier phrase and the participant was asked to
name them spontaneously. Simultaneous audio and video data were recorded (tongue ultrasound images). The data was submitted to acoustic analyses (voice onset time; spectral peak and burst spectral moments; vowel/consonant
transition and relative duration measures) and articulatory analyses (proportion of signiicant axes of the anterior
and posterior tongue regions and description of tongue curves). Results: Acoustic and articulatory parameters were effective to indicate the contrast between alveolar and velar stops, mainly in the adult group. Both speech
analyses showed statistically signiicant differences between the two groups. Conclusion: The acoustic and
articulatory parameters provided signals to characterize the phonic contrast of speech. One of the main indings in the comparison between adult and child speech was evidence of articulatory reinement/maturation even after
the period of segment acquisition.
RESUMO
Objetivo: Caracterizar acústica e articulatoriamente o contraste entre oclusivas alveolares e velares em dados típicos de fala, além de comparar os parâmetros (acústicos e articulatórios) de adultos e de crianças com desenvolvimento típico de fala. Método: A amostra consistiu de 20 adultos e 15 crianças com desenvolvimento típico de fala. O corpus analisado no presente estudo foi composto por cinco repetições de cada palavra-alvo
(/’kapə/, /‘tapə/, /‘galo/ e /‘daɾə/). Essas palavras foram inseridas em frase-veículo e o indivíduo foi instruído
a nomeá-las espontaneamente. Foi realizada a gravação simultânea de áudio e vídeo (imagens de ultrassom de língua). Os dados passaram por análise acústica (voice onset time; pico espectral e momentos espectrais do burst;
transição consoante/vogal e medidas de duração relativa) e articulatória (proporção de eixos signiicantes da
região anterior e posterior de língua e descrição das curvas de língua). Resultados: Os parâmetros acústicos e articulatórios investigados foram sensíveis em marcar o contraste entre oclusivas alveolares e velares, principalmente, no grupo de adultos. Ambas as análises de fala sinalizaram também algumas diferenças estatisticamente
signiicantes entre os dois grupos da pesquisa. Conclusão: Os parâmetros acústicos e articulatórios investigados forneceram indícios para a caracterização do contraste fônico alvo do estudo. Dentre as principais contribuições
da comparação da fala adulta e infantil, destaca-se a evidência de um período de reinamento/amadurecimento
INTRODUCTION
The Brazilian Portuguese (BP) phonic system is comprised of stop segments and these consonants can be categorized by the contrast in voicing (voiced or voiceless, according to the closing or opening of the glottal gesture), degree of constriction (degree of closing, characteristic of the articulatory gestures of stop sounds in BP) and also the location of constriction of articulatory gestures (labial/p/ and /b/, alveolar /t/ and /d/ and velar /k/ and /g/(1).
This class of sounds is acquired early in childhood development. By the age of three all stop consonants have already been acquired in the phonic system(2).
A study of stops and fricatives in(3) BP speaking children with typical speech development (TSD) showed the existence
of a period of “articulatory reinement”, i.e. even after the “end” of phonological acquisition, there seems to be a period of
improvement of speech production motor skills, during which time the articulatory gestures become gradually more stable both in temporal organization and magnitude.
The notion of gradient states during the process of acquisition is related to the Gesture Phonology theoretical perspective(4,5). This theory considers speech events as dynamic tasks and advocates the adoption of instrumental analyses to research the articulatory gestures involved in the production of phonic contrasts.
Stops, the target segments of the present study, have been investigated using acoustic parameters(3,6-13) and, less extensively, using articulatory parameters, such as those obtained by ultrasound images of tongue movement (13-22).
Because ultrasound tongue images during production of /t/, /k/, /g/ and /d/ has been a relatively little used technique in research, unlike acoustic analysis, there is no consensus in the literature about the methodology of data collection or the type of articulatory measures to be adopted. To date, stop consonants have been described in relation to constrictions of tongue curves during production of different stops(16,19,21,22) and complex articulatory parameters(13,18,23).
Tongue ultrasound studies in BP are even more scarce. To date, this analytical instrument has been used to research liquid(24,25), stop(19,22) and fricative(26) consonants.
Thus, the present study focuses on the acoustic and articulatory characterization of the typical contrast between alveolar and velar stops in BP. Two research hypotheses have been formulated:
(i) A comparison of acoustic and articulatory speech data of stops in adult and children that presents TSD will reveal particularities in the production of alveolar and velar constrictions.
(ii) The comparison of productions of adults and children with TSD will show differences when using both instruments of speech analysis (acoustic and articulatory analyses).
This article aims to perform acoustic and articulatory characterizations of the contrast between alveolar and velar stops in typical speech data, as well as to compare the parameters (acoustic and articulatory) in adults and children with TSD.
METHODS
This transversal and quantitative/descriptive study is part of a research project approved by the Ethics Committee of the Universidade Federal de Santa Maria (protocol number 14973013.8.0000.5346). All individuals included in this research, or their legal guardians in the case of children, signed an Informed Consent Form. The children’s agreement to participate, or not, was also respected.
The sample was composed of:
(i) Twenty adults, 10 female and 10 male, between the age of 19 and 38 (M=24; SD=5.9 years in the acoustic analysis; and M=24; SD 6.1 years in the articulatory analysis). Three female individuals in the acoustic analysis were excluded because of the poor quality of the images at the highest tongue elevation during the production of velar stops. Three new female individuals were included to replace them.
(ii) Fifteen children with TSD, six females and nine males, between the age of four years and seven months and seven years
and ive months (M=5.7 years; SD= 10.9 months).
Sample selection was based on an initial interview and speech-therapy triage (orofacial myofunctional, speech, voice and auditory evaluations).
Inclusion criteria included:
(i) not presenting omissions and/or substitutions of identiied
segments using auditory perceptual analysis;
(ii) ages between 19 and 44 years for adults and between four and eight years for children with TSD. According to the
Descritores em Ciências da Saúde (DECs), individuals in the adult group are within the age range considered to be adult. For the children with TSD, the minimum age of four was selected because stops are often acquired at this age. As this study is part of a larger study which also analyzes data of children with speech deviation, the maximum age of children
with TSD was deined based on the criteria used for the group
with speech alterations. This is because, based on the literature, after nine years of age, speech deviation has normally been overcome and substitutions of sounds are considered residual
speech errors. In addition, we also aimed to avoid inluences
related to the maturation of neuromotor structures which occur as children get older;
(iii) not having been in or not being in speech-therapy; and (iv) being a monolingual speaker of BP, based on the initial interview (residential locations; period and duration of contact with a second language).
Exclusion criteria included: (i) presence of vocal, auditory and/or language alterations; (ii) apparent damage of neurological, cognitive, psychological and/or emotional aspects; and (iii) myofunctional orofacial alterations that could interfere in correct production of speech sounds.
For the data recording procedure, the following equipment was used: unidirectional microphone (Shure – SM48); pedestal;
endocavitary transductor (65C10EA – 5 MHz) coupled to a portable ultrasound (Mindray – DP6600); computer; speaker;
Articulate Assistant Advanced Software – AAA (the three latest programs of Articulate Instruments Ltd).
The corpus of both analyses consisted of four BP words,
all two syllable, with stress on the irst syllable, with stop
consonants at initial onset and in the vowel context of /a/ /’kapə/, /‘tapə/, /‘galo/ and /‘daɾə/, based on selection criteria used in the Instrumento de Avaliação de Fala para Análise Acústica (IAFAC)(27).
The target words were represented by igures and presented on
a computer screen for the individuals to name them. Individuals were instructed to include the target word in a carrier phrase
“Fala ____ de novo” (“Say ____ again”), repeated six times,
using a normal vocal pattern (intensity, frequency and speed). The individuals remained seating during recording, with an erect posture inside an acoustic booth. The transductor of the
ultrasound was positioned below the jaw and ixed to the head
stabilizer. Gel for the contact between skin and the transductor was used to aid in image capture. For children, recordings were
supervised by the irst author of this article, who also remained
in the booth. Collection time varied between 15 and 20 minutes and was performed in a single session.
Three repetitions of the target word were used for the acoustic analysis (4 words x 3 repetitions x 35 individuals = 420 stop
segments analyzed) and ive repetitions were used for the articulatory
analysis (4 words x 5 repetitions x 35 individuals = 700 stop segments analyzed).
Some productions were excluded from the acoustic analysis due to incorrect naming of the target word or carrier phrase, a long pause between words in the sentence, outside noise and/or acoustic register not differentiated from the burst.
Due to the exclusion of these segments and the statistical design, it was necessary to select the same number of repetitions of stops for the acoustic parameters and both groups. Thus, three repetitions of each consonant were used for the acoustic experiment. Five repetitions of each consonant were used in the ultrasound image analysis. Images with poor quality at the greatest point of tongue constriction were excluded as were those in which the
target word or carrier phrase were named incorrectly. The irst
repetitions of each individual were prioritized for inclusion in the analyses. In the case of excluded segments, the next repetition was included until the total number of repetitions was obtained.
Audio and image capture were carried out using AAA software. Images were analyzed using AAA software and audio signals were analyzed using Praat Software.
In the acoustic analysis, target sounds were analyzed using the following parameters: voice onset time (VOT); spectral peak at burst spectral moments (centroid, variance, asymmetry and kurtosis); consonant-vowel transition (CV) and measurements of relative duration of the burst in relation to the total duration of the segment. These parameters were measured manually, following procedures described in other studies(3,9-11).
In the articulatory analysis, instances corresponding to the production of each segment analyzed ([t], [k], [d] and [g]) were selected: based on the spectrogram obtained from the program, data from the last regular cycle of the second vowel
of the word “Fala” (Say) through the beginning of the vowel
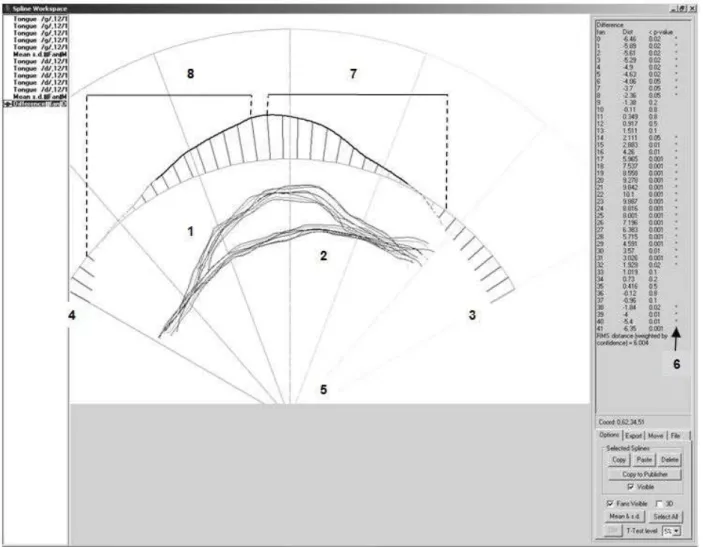
following the target stop. A spline was then drawn over the surface of the tongue (sagittal cut) at the instant corresponding to the highest tongue elevation(28), during stop production. It is important to note that during audio and video synchronization using SyncBrightUp and frame selection at the highest tongue elevation, a visual inspection of the selected video frame was performed for each consonant.
After drawing all the splines for each of the ive repetitions of
each stop consonant, using a software command, an independent mean was calculated for each of the 42 axes and, thus, a mean tongue contour was drawn based on these 42 points, as well as two standard deviations. Then, two mean splines were compared for each of the contrasts investigated ([t] x [k], [t] x [g], [d] x [k] and [d] x [g]), using the T test for each axis calculated by the software, at p<5%.
Using this statistical test, the total number of axes crossed by the two mean splines was divided by two, thus dividing the tongue into two regions, anterior and posterior. When the total number of axes corresponded to an odd number, the exceeding axis was counted as pertaining to the anterior region. Thus, using
the total number of axes for each region, the number of signiicant
axes was obtained for the anterior and posterior regions.
The signiicant axes given by the T test corresponded to the axes
in which the two mean tongue curves (alveolar x velar stops)
presented signiicant differences.
Finally, the proportion of signiicant axes was calculated by dividing the number of signiicant axes of the anterior region by
the total number of axes of the anterior region. The result was then multiplied by 100. This procedure was performed for the
posterior region as well. The proportion of signiicant axes of
each region was calculated for each individual. These values were then submitted to statistical evaluations as described below.
Figure 1 shows the software window with the statistical comparison between the two mean tongue splines and the division of anterior and posterior regions.
The statistical method for the acoustic data consisted of a series of ANOVA repeated measures for each of the acoustic parameters. The intragroup factor was the four consonants and three repetitions and the intergroup factor was the period of speech development (adults and children with TSD). The post hoc Bonferroni test was performed with the aid of Statistica 7.0 software was used, at p<0.05.
Statistical analysis of ultrasound image means consisted
irst of the Kolmogorov-Smirnov Normality Test with normal
distribution considered to be p<0.05. Paired T test was used to detect differences between means of tongue regions, for samples with normal distribution and the Wilcoxon Nonparametric Test was used for anormal distribution. The Mann-Whitney Test was used to compare the groups, since these variables did not present normality, using the Statistical Package for Social Science 15.0 – SPSS at p<0.05.
and degree of constriction of the tip of the tongue and location and degree of constriction of the dorsum.
RESULTS
Acoustic analysis of the contrast between alveolar and
velar stops.
Table 1 presents descriptive values of each acoustic parameter for adults and children with TSD.
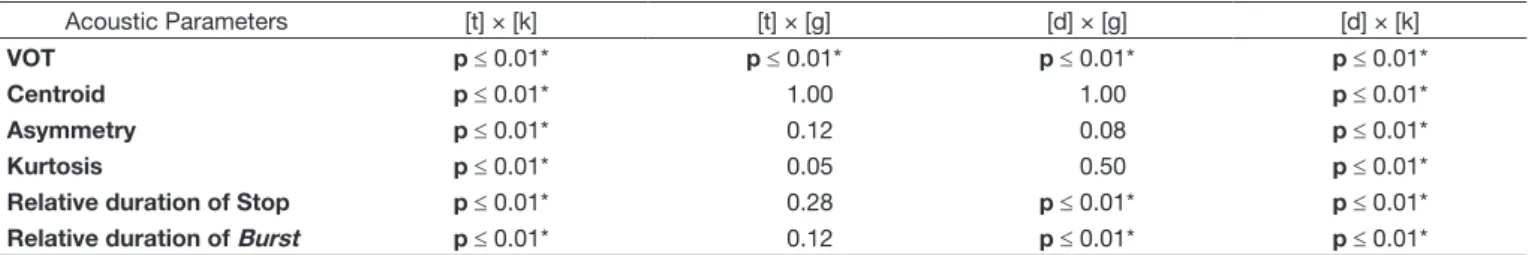
Table 2 presents results obtained for ANOVA repeated measures of the nine acoustic parameters.
The centroid was the only acoustic parameter to show a difference between adults and children with TSD with no
signiicance for the consonant/group interaction.
The following parameters were signiicantly different
between stop consonants [k], [t], [g] and [d]: VOT, centroid, asymmetry, kurtosis and relative duration of the stop and the burst. The differences between stops were similar between the groups.
A consonant/group interaction effect was observed for the following acoustic parameters: spectral peak, variance and CV transition. In other words, the differences between alveolar and velar contrast for these parameters were dependent on the type of group.
A series of post hoc analyses was performed to verify the difference between consonants and between consonants as a
function of the group (in the case of a signiicant consonant/group
interaction).
Table 3 presents the post hoc analysis performed to evaluate differences between alveolar and velar pairs of stop consonants, regardless of the group.
There was a contrast in voicing, for VOT, in addition to a distinction in the four pairs of alveolar and velar stops: [t] x [k], [t] x [g], [d] x [g] and [d] x [k]. This was also observed for the
ive other parameters highlighted in Table 3, i.e. all of them showed both distinctions in alveolar vs. velar and voicing,
however, the difference was not statistically signiicant for all
the contrasted pairs.
For parameters presenting a difference between pairs of alveolar and velar stops with differences between the groups, the
Caption: 1 – Five splines and mean spline of [g] stop; 2 – Five splines and mean spline of [d] stop; 3 – Axis “zero” of the fan spline; 4 – Axis “41” of the fan spline; 5 – Fan spline; 6 – Asterisks show significant axes; 7 – Anterior tongue region; 8 –Posterior tongue region
post hoc test showed spectral peak to be signiicantly different
only for the group of adults for the pairs [d] x [g] and [d] x [k], at
p =/< 0.02. For variance, a signiicant difference was observed in the adult group comparisons [t] x [k] and [d] x [k] (p ≤ 0.01) and,
for the group with TSD, a difference between [t] x [g] (p = 0.02)
and [(d)] x [k] (p ≤ 0.01) was observed. CV transition was also
found to be sensitive to the consonant/group effect, where the adult group was the only one to differentiate the contrast in
comparisons between stops [t] x [g] and [d] x [g] (p ≤ 0.01).
Variance also presented an effect for repetition, with
F(2.66)= 5.9994 and p ≤ 0.01. The repetition/group interaction was not signiicant (F(2.66)=1.1764 and p=0.31). These results
Table 2. Results of statistical analysis of nine acoustic parameters
Acoustic Parameters Factors
Groups Adults X TSD Stop Consonants Consonant/Group Interaction
VOT F(1.33) = 0.0774 p = 0.78 F(3.99) = 560.3611 p ≤ 0.01* F(3.99) = 0.4231 p = 0.73
Spectral Peak F(1.33) = 1.11694 p = 0.29 F(3.99) = 0.27574 p = 0.84 F(3.99) = 3.47451 p ≤ 0.01*
Centroid F(1.33) = 5.9496 p = 0.02* F(3.99) = 18.2265 p ≤ 0.01* F(3.99) = 1.5598 p = 0.20
Variance F(1.33) = 5.7526 p = 0.02* F(3.99) = 19.4033 p ≤ 0.01* F(3.99) = 3.0979 p = 0.03*
Asymmetry F(1.33) = 3.9457 p = 0.05 F(3.99) = 20.9163 p ≤ 0.01* F(3.99) = 2.3849 p = 0.07
Kurtosis F(1.33) = 2.77964 p=0.10 F(3.99) = 8.14936 p ≤ 0.01* F(3.99) = 1.19140 p = 0.31
CV Transition F(1.33) = 18.675 p ≤ 0.01* F(3.99) = 9.074 p ≤ 0.01* F(3.99) = 3.212 p = 0.02*
Relative duration of Stop F(1.33) = 2.21 p = 0.14 F(3.99) = 164.18 p ≤ 0.01* F(3.99) = 1.33 p = 0.26
Relative duration of Burst F(1.33) = 2.0113 p = 0.16 F(3.99) = 169.9732 p ≤ 0.01* F(3.99) = 1.1007 p = 0.35 *Significantly significant
Statistical test = Repeated measures ANOVA at p<0.05
Caption: VOT – Voice onset time; TSD – Group of children with typical speech development
Table 3. Significant post hoc values in the comparison between alveolar and velar stops in both groups in the absence of consonant/group interaction.
Acoustic Parameters [t] × [k] [t] × [g] [d] × [g] [d] × [k]
VOT p ≤ 0.01* p ≤ 0.01* p ≤ 0.01* p ≤ 0.01*
Centroid p ≤ 0.01* 1.00 1.00 p ≤ 0.01*
Asymmetry p ≤ 0.01* 0.12 0.08 p ≤ 0.01*
Kurtosis p ≤ 0.01* 0.05 0.50 p ≤ 0.01*
Relative duration of Stop p ≤ 0.01* 0.28 p ≤ 0.01* p ≤ 0.01*
Relative duration of Burst p ≤ 0.01* 0.12 p ≤ 0.01* p ≤ 0.01* *Statistically significant
Statistical test= Bonferroni Post hoc at p<0.05 Caption: VOT – Voice onset time
Table 1. Descriptive values of acoustic parameters for both groups studied
Parameters Adults Children with TSD
[k] [t] [g] [d] [k] [t] [g] [d]
VOT (ms) M 44.22 16.96 -94.56 -114.85 44.05 20.47 -98.47 -108.78
SD 12.47 5.77 31.67 32.17 19.36 12.07 36.42 49.98
Spectral Peak (Hz) M 352.14 322.25 352.83 720.51 621.98 691.50 530.53 378.05
SD 526.34 542.33 404.89 1196.24 908.90 1282.25 582.56 310.24
Centroid (Hz) M 1338.77 498.12 603.72 492.64 1422.13 1058.79 827.14 687.94
SD 883.13 513.71 486.71 389.61 675.25 1063.28 663.85 713.53
Variance (MHz) M 2.85 1.08 0.75 0.60 2.91 2.89 1.33 1.10
SD 2.25 1.46 0.89 0.96 1.68 2.86 1.82 1.85
Asymmetry M 2.95 10.04 7.22 8.60 2.48 5.88 5.34 8.09
SD 1.67 7.73 3.97 4.44 1.43 6.49 3.85 5.44
Kurtosis M 14.24 225.43 104.81 154.28 8.53 100.15 55.93 124.87
SD 19.04 440.78 111.38 164.44 9.08 216.20 78.60 157.08
CV Transition (Hz) M 1629.47 1566.42 1762.42 1594.23 1823.20 1861.53 1952.07 1939.91
SD 155.06 191.78 211.38 346.02 300.04 268.26 380.56 346.02
Relative duration of stop (%)
M 74.73 89.55 86.52 92.92 72.71 86.84 86.87 90.40
SD 6.62 4.13 5.76 3.42 8.18 6.99 6.82 5.61
Relative duration of
Burst (%)
M 25.27 10.40 13.48 7.08 27.29 12.80 13.29 9.58
SD 6.62 4.19 5.76 3.42 8.21 6.88 6.85 5.64
Table 4. Comparison of proportions of significant axes in the anterior and posterior tongue regions in adults
Contrasts Tongue region p-valor
Anterior M(SD) Posterior M(SD)
[t] × [k] 0.8796 (±0.07) 0.7067 (±0.17) 0.003*
[t] × [g] 0.8695 (±0.06) 0.6973 (±0.21) 0.003*
[d] × [k] 0.8458 (±0.08) 0.6875 (±0.20) 0.011*
[d] × [g] 0.8581 (±0.07) 0.7019 (±0.18) 0.001* *Statistically significant
Statistical test – Paired t test at p<0.05 Caption: M – Mean; SD – standard deviation
Caption: Dotted line– velar stops [k] and [g]; continuous line: – alveolar stops [t] and [d]; to the left of images –posterior tongue region; to the right - anterior tongue region
Figure 2. Tongue splines for each contrast investigated, produced by one adult individual
suggest the existence of variability between repetitions of stops for variance values, regardless of the group.
Articulatory analysis of contrast between alveolar versus
velar stops
In relation to the proposed articulatory parameters, the
proportion of signiicant axes of the anterior tongue region and the proportion of signiicant axes of the posterior tongue
region were compared in each group investigated (adults and children with TSD).
Table 4 shows the results of the adult group. There was a
signiicant difference between the anterior and posterior regions
of the tongue for all contrasts: [t] x [k], [t] x [g], [d] x [k] and [d] x [g]. In the four contrasts, the highest percentual mean of
signiicant axes was found in the anterior tongue.
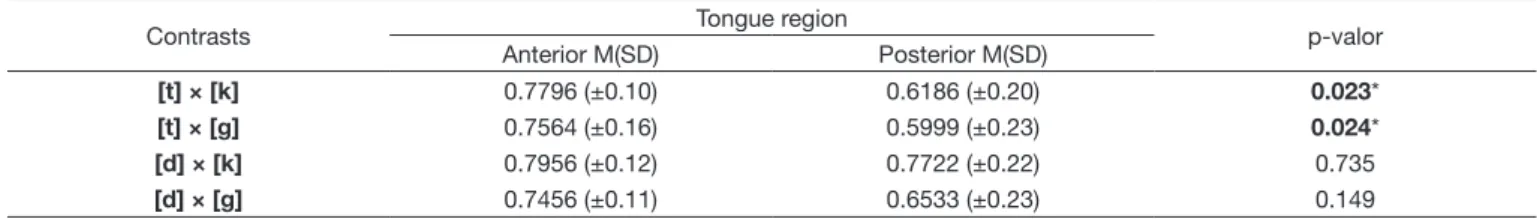
For children with TSD (Table 5), a signiicant difference was observed between the anterior and posterior regions of the tongue only for [t] x [k] and [t] x [g]. The highest percentual
mean of signiicant axes was also found in the anterior for the
same consonant pairs.
Figures 2 and 3 show the tongue splines in the comparison of each contrast – [t] x [k], [t] x [g], [d] x [k] and [d] x [g] – for an individual from each of the groups investigated.
The splines are in line with the results in Table 4. In general, when considering the Sign Phonology variables for alveolar stops, there was a trend toward elevation and anteriorization of the tip of the tongue in the direction of the alveolar region. In contrast, for the velar stops, there was an elevation and posteriorization of the tongue dorsum toward the soft palate.
Table 5. Comparison of proportions of significant axes in the anterior and posterior tongue regions in children with typical speech development
Contrasts Tongue region p-valor
Anterior M(SD) Posterior M(SD)
[t] × [k] 0.7796 (±0.10) 0.6186 (±0.20) 0.023*
[t] × [g] 0.7564 (±0.16) 0.5999 (±0.23) 0.024*
[d] × [k] 0.7956 (±0.12) 0.7722 (±0.22) 0.735
[d] × [g] 0.7456 (±0.11) 0.6533 (±0.23) 0.149
*Statistically significant
Statistical test –Wilcoxon test at p<0.05 Caption: M – Mean; SD – standard deviation
Caption: Dotted line– velar stops [k] and [g]; continuous line: – alveolar stops [t] and [d]; to the left of images –posterior tongue region; to the right - anterior tongue region
Figure 3. Tongue splines for each contrast investigated, produced by one child with TSD
The articulatory gestures (tract variables - the constriction site for the tip and dorsum of the tongue) of children with TSD were similar to those described for the adult group. However, the vast majority of the data present a smaller magnitude of articulatory gestures for these individuals, in addition to greater variability among some repetitions of segments.
When comparing the proportions of signiicant axes of
adults and children with TSD, in relation to the anterior tongue
region during the production of [t] x [k] there was a signiicant
difference between the groups. Thus, the same result was
conirmed for the other three pairs of stops - [t] x [g], [d] x [k]
and [d] x [g] – also in relation to the posterior tongue. In all
comparisons, the highest mean of signiicant axes was observed
in adults, the only exception being the comparison between the proportions of signiicant axes of the posterior tongue, during the production of the contrast between [d] x [k].
DISCUSSION
This study aimed to investigate acoustic and articulatory variables for the contrast between alveolar and velar stops in BP. Acoustic parameters and ultrasound images of tongue gestures were analyzed in data of adults and children with typical acquisition.
Acoustic analysis of the contrast between alveolar and
velar stops.
The spectral peak values differed between consonants, however, this distinction was related to the type of group. This is due to the fact that the adults and children with TSD evaluated use this parameter differently in terms of marking the contrast of the articulatory point. Variance and CV transition were the
two other parameters that presented a signiicant difference for
the consonant/group interaction.
Statistically signiicant differences between adults and
children with TSD were also observed for the centroid and by post hoc analysis of the acoustic parameters that presented a
signiicant consonant/group interaction, which were spectral
peak, variance and CV transition.
Acoustic analysis is a well-established method among speech researchers for characterization of contrasting sounds. VOT is considered one of the most important acoustic parameters to investigate stop segments and is extensively used for marking the voicing contrast, however, it has also been related to the contrast of the stop articulatory point(3,5-8,10,13), which was also
conirmed by the indings of this study. When comparing the
consonants based only on the alveolar versus velar contrast ([t] x [k] and [d] x [g]), higher values of VOT were observed for [k] and [d], respectively.
As for the other parameters, another study(9) observed the employment of all the acoustic parameters investigated here in the differentiation between the consonants [t] and [k], in the speech of an adult BP speaking individual (spectral peak, burst spectral moments, CV transition and relative durations).
This corroborates in part with some of the indings of this article,
since, in the present study, all parameters showed differences between the pairs of alveolar and velar stops. One study(9) showed that some of these acoustic measures were primary or secondary in the distinction of the alveolar versus velar contrast.
With regard to the distinction between the groups studied, the differences between the acoustic parameters during adult and child oral production, both in this study and in other studies from the literature(3,6,8), are in line with established knowledge from Speech Therapy and Linguistics. If children with TSD present a stable production compatible with the adult target according to perceptual analysis, why would they present acoustic distinctions in relation to the language standard? This will be discussed in greater depth following the presentation of the articulatory data.
Articulatory analysis of contrast between alveolar versus
velar stops
The second instrumental analysis employed in this study consisted of an analysis of tongue images acquired with the aid of ultrasound equipment. One of the challenges in the implementation of this study was obtaining a quantitative analysis of tongue images with the aid of the AAA software. Therefore, an alternative to this type of analysis was employed using the program’s resources to record and analyze speech production data. Because the target contrast is apparently related to articulatory gestures at the tip and dorsum of the tongue, the advantage of using the anterior or posterior region of tongue
to mark the alveolar versus velar contrast could be questioned.
Therefore, the proportion of signiicant axes of the anterior and
posterior region of tongue were analyzed.
The results pointed to some differences between the two tongue regions, both for adults and children with TSD. For all
the signiicant differences observed, the highest percentual mean of signiicant axes was found in the anterior tongue region, making it possible to infer that there is a greater inluence of
the middle anterior tongue region in stabilization of the contrast of the stop articulatory point.
The dorsum excursion index (DEI)(13,23) is one of the quantitative ultrasound measures described in the literature for the segments analyzed. This parameter has been used to characterize the contrast between alveolar and velar stops of English speakers(13) and higher DEI values were observed for velar consonants in a child with a noticeable distinction between velar and alveolar segments.
In the description of tongue curves at the maximum point of constriction, a tongue tip and dorsum gesture was observed during the production of alveolar and velar stops, respectively. This was also reported in a study using typical BP speech data(19).
This study also compared the two groups investigated by means of ultrasound tongue data, which likewise showed some particularities in adult and child productions. Even though both groups presented categorical productions of [t], [d], [k] and [g]
(identiied by auditory perceptual analysis), a distinction between
phases of development was observed with the comparison of
the proportion of signiicant axes of the anterior and posterior tongue regions, where there was a higher mean of signiicant
axes for the adult group.
The visual inspection of tongue curves also showed some
speciic characteristics of the child group, even though the
same tract variables were observed during the formation of alveolar and velar constrictions in both groups. For example, in children with TSD, there was less differentiation between the magnitudes of gestures of the tip and dorsum, in addition to greater variability of tongue curves during the repetition of a consonant.
This also highlights the uncertainties already pointed out in this discussion. Both the results generated by the acoustic analysis and by the articulatory analysis suggest a period of stabilization in the production of children with TSD. This interpretation can be explained by Sign Phonology(4,5), since it is possible to observe gradient states even in data with no speech alterations,
which corroborates the identiication of a period of “articulatory reinement” even after the acquisition of the segment(3).
Differences between the data of children with TSD and adults indicate a period of neuromotor maturation related to the use of articulators in the vocal tract. In these cases, even when some degree of distance is observed between the adult and child stages, where not all parameters are used in the marking of a particular contrast, the use of at least one parameter in a suitable magnitude provides the contrast through audition(8,9).
same maturational constraints(29). Consequently, the maturation
of ine motor control in speech occurs with increasing age(30). In corroboration with this, it is accepted that mature speech production is a skill that requires many years of development and improvement of human cognition and language and motor systems(14).
Finally, in addition to providing information about the contrast between alveolar and velar stops, this study aimed to use a new method of instrumental speech research, employing ultrasound tongue images. Although we cannot answer all of the questions arising in the investigation of contrasts using this tecnhnology, it is hoped that the study will lead to further investigation into acquisition and development of speech sounds, as well as into speech-therapy practice for speech alterations.
CONCLUSION
The acoustic analysis showed several distinctions between the production of alveolar and velar constrictions in the class of stops. Values of VOT, centroid, asymmetry, kurtosis and relative stop and burst duration presented differences between stop consonants regardless of the type of group. In contrast, the results for spectral peak, variance and CV transition suggest that adults and children with TSD use these three parameters differently to distinguish stop consonants.
The articulatory parameters also showed differences between all contrasted pairs of alveolar and velar stops in the speech of adult individuals. However, children with TSD only showed differences in the comparison between the proportions of
signiicant axes of the anterior and posterior tongue regions for
the pairs [t] x [k] and [t] x [g]. Likewise, tongue curves aided
in the identiication of articulatory gestures used during the
production of alveolar and velar constrictions in both groups. The differences shown between the two groups in both
speech analyses suggest a period of reinement of articulatory
gestures in children with TSD, even after stop acquisition, that
is, beyond the age of ive years and seven months, the mean
age of children included in this study.
ACKNOWLEDGEMENTS
Thanks to the Fundação de Amparo à Pesquisa do Estado do Rio Grande do Sul (FAPERGS) and the Coordenação de Aperfeiçoamento de Pessoal de Nível Superior (CAPES) for
granting the PhD Scholarship to the irst author of this article and for inancial aid for the purchase of equipment used for data
collection and to individuals who were willing to contribute to
the scientiic research.
REFERENCES
1. Gafos AI. A grammar of gestural coordination. Nat Lang Linguist Theory. 2002;20(2):269-337. http://dx.doi.org/10.1023/A:1014942312445. 2. Ferrante C, Van Borsel J, Pereira MMB. Aquisição fonológica de crianças
de classe sócio econômica alta. Rev CEFAC. 2008;10(4):452-60. http:// dx.doi.org/10.1590/S1516-18462008000400005.
3. Cristofolini C, Seara IS. Características acústicas de consoantes plosivas e fricativas produzidas por crianças de 6 e 12 anos: período de refinamento articulatório? Verba Volant. 2012;3(1):55-71.
4. Browman C, Goldstein L. Articulatory phonology: an overview. Phonetica. 1992;49(3-4):155-80. PMid:1488456. http://dx.doi.org/10.1159/000261913. 5. Albano EC. O gesto e suas bordas: esboço de fonologia acústico-articulatória do Português Brasileiro. Campinas: Mercado das Letras-Associação de Leitura do Brasil; 2001.
6. Kim M, Stoel-Gammon C. The acquisition of Korean word-initial stops. J Acoust Soc Am. 2009;125(6):3950-61. PMid:19507977. http://dx.doi. org/10.1121/1.3123402.
7. Theodore RM, Miller JL, DeSteno D. Individual talker differences in voice-onset-time: contextual influences. J Acoust Soc Am. 2009;125(6):3974-82. PMid:19507979. http://dx.doi.org/10.1121/1.3106131.
8. Rinaldi LC, Albano E. Contrastes em estabilização em crianças sem queixas fonoaudiológicas. Verba Volant. 2012;3(1):1-23.
9. Berti LC, Marino VCC. Contraste fônico encoberto entre /t/ e /k/: um estudo de caso de normalidade e de transtorno fonológico. Rev CEFAC. 2011;13(5):866-76. http://dx.doi.org/10.1590/S1516-18462011005000010. 10. Melo RM, Mota HB, Mezzomo CL, Brasil BC, Lovatto L, Arzeno L. Desvio fonológico e a dificuldade com a distinção do traço [voz] dos fonemas plosivos – dados de produção e percepção do contraste de sonoridade. Rev. CEFAC. 2012;14(1):18-29. http://dx.doi.org/10.1590/ S1516-18462011005000083.
11. Berti LC. Produção e Percepção da fala em crianças com distúrbios fonológicos: a ancoragem em pistas fonético-acústicas secundárias. In:
Ferreira-Gonçalves G, Brum-de-Paula M, Keske-Soares M. Estudos em
aquisição fonológica. Pelotas: Editora e Gráfica Universitária PREC - UFPel; 2011. p. 153-74.
12. Marino VCC, Berti LC, Lima-Gregio AM. Características acústicas da oclusiva glotal associada à sequência de Pierre Robin: estudo de caso. Rev CEFAC. 2013;15(2):466-77. http://dx.doi.org/10.1590/S1516-18462012005000021.
13. Byun TM, Buchwald A, Mizoguchi A. Covert contrast in velar fronting: an acoustic and ultrasound study. Clin Linguist Phon. 2015;1:1-27. 14. Cheng HY, Murdoch BE, Goozée JV, Scott D. Electropalatographic
assessment of tongue-to-palate contact patterns and variability in children, adolescents, and adults. J Speech Lang Hear Res. 2007;50(2):375-92. PMid:17463236. http://dx.doi.org/10.1044/1092-4388(2007/027). 15. Goldstein L, Pouplier M, Chen L, Saltzman E, Byrd D. Dynamic action
units slip in speech production errors. Cognition. 2007;103(3):386-412. PMid:16822494. http://dx.doi.org/10.1016/j.cognition.2006.05.010. 16. Bressmann T, Radovanovic B, Kulkarni GV, Klaiman P, Fisher D. An
ultrasonographic investigation of cleft-type compensatory articulations of voiceless velar stops. Clin Linguist Phon. 2011;25(11-12):1028-33. PMid:21787146. http://dx.doi.org/10.3109/02699206.2011.599472. 17. Gibbon FE, Lee A. Using EPG data to display articulatory separation
for phoneme contrasts. Clin Linguist Phon. 2011;25(11–12):1014-21. PMid:21967129. http://dx.doi.org/10.3109/02699206.2011.601393. 18. Falahati R, Mielke J. An ultrasound study of coronal stop deletion in
Persian. Can Acoust. 2011;39(3):172-3.
19. Berti LC. Investigação ultrassonográfica dos erros de fala infantil à luz da Fonologia Gestual. In: Ferreira-Gonçalves G, Brum-de-Paula M. Dinâmica dos movimentos articulatórios: sons, gestos e imagens. Pelotas: Editora UFPel; 2013. p. 127-44.
20. Mauszycki SC, Wambaugh JL, Dromey C. Electropalatographic measures of stop consonants in speakers with and without apraxia of speech on repeated sampling occasions. J Med Speech-Lang Pathol. 2013;20(4):77-81. 21. Cleland J, Scobbie JM, Wrench AA. Using ultrasound visual biofeedback
22. Melo RM, Dias RF, Mota HB, Mezzomo CL. Imagens de ultrassonografia de língua pré e pós terapia de fala. Rev CEFAC. 2016;18(1):286-97. http:// dx.doi.org/10.1590/1982-0216201618114515.
23. Zharkova N. Using ultrasound to quantify tongue shape and movement characteristics. Cleft Palate Craniofac J. 2013;50(1):76-81. PMid:22117937. http://dx.doi.org/10.1597/11-196.
24. Barberena LS, Keske-Soares M, Berti LC. Descrição dos gestos articulatórios envolvidos na produção dos sons /r/ e /l/. Audiol Commun Res. 2014;19(4):338-44. http://dx.doi.org/10.1590/S2317-6431201400040000135.
25. Berti LC, Boer G, Bressmann T. Tongue displacement and durational characteristics of normal and disordered Brazilian Portuguese liquids. Clin Linguist Phon. 2016;30(2):131-49. PMid:26853548. http://dx.doi.org/10 .3109/02699206.2015.1116607.
26. Wertzner HF, Francisco DT, Pagan-Neves LO. Contorno de língua dos sons
/s/ e /ʃ/ em crianças com transtorno fonológico. CoDAS.
2014;26(3):248-51. PMid:25118923. http://dx.doi.org/10.1590/2317-1782/201420130022. 27. Berti LC, Pagliuso A, Lacava F. Instrumento de avaliação de fala para análise acústica (IAFAC) baseado em critérios linguísticos. Rev Soc
Bras Fonoaudiol. 2009;14(4):305-14. http://dx.doi.org/10.1590/S1516-80342009000300005.
28. Kochetov A, Sreedevi N, Kasim M, Manjula R. Spatial and dynamic
aspects of retroflex production: na ultrasound and EMA study of Kannada
geminate stops. J Phonetics. 2014;46:168-84. http://dx.doi.org/10.1016/j. wocn.2014.07.003.
29. Le Normand MT, Vaivre-Douret L, Payan C, Cohen H. Neuromotor development and language processing in developmental dyspraxia: a follow-up case study. J Clin Exp Neuropsychol. 2000;22(3):408-17. PMid:10855048. http://dx.doi.org/10.1076/1380-3395(200006)22:3;1-V;FT408.
30. Singh L, Singh NC. The development of articulatory signatures in children. Dev Sci. 2008;11(4):467-73. PMid:18576954. http://dx.doi.org/10.1111/ j.1467-7687.2008.00692.x.
Author contributions