Effects of glutamine alone or in combination with
zinc and vitamin A on growth, intestinal barrier
function, stress and satiety-related hormones in
Brazilian shantytown children
Aldo A. M. Lima,IGregory M. Anstead,IIIQiong Zhang,II I´talo L. Figueiredo,IAlberto M. Soares,I Rosa M. S. Mota,INoe´lia L. Lima,IRichard L. Guerrant,I,IIReinaldo B. Oria´I*
IFederal University of Ceara´, School of Medicine, Clinical Research Unit & Institute of Biomedicine, Center for Global Health, Department of Physiology
and Pharmacology, Fortaleza/CE, Brazil. IIUniversity of Virginia, School of Medicine, Division of infectious Diseases, Center for Global Health, Charlottesville, VA, USA.IIISouth Texas Veterans Hospital, San Antonio, TX, USA.
OBJECTIVE:To determine the impact of supplemental zinc, vitamin A, and glutamine alone or in combination on growth, intestinal barrier function, stress and satiety-related hormones among Brazilian shantytown children with low median height-for-age z-scores.
METHODS:A randomized, double-blind, placebo-controlled trial was conducted in children aged two months to nine years from the urban shanty compound community of Fortaleza, Brazil. Demographic and anthropometric information was assessed. The random treatment groups available for testing (a total of 120 children) were as follows: (1) glutamine alone, n = 38; (2) glutamine plus vitamin A plus zinc, n = 37; and a placebo (zinc plus vitamin A vehicle) plus glycine (isonitrogenous to glutamine) control treatment, n = 38. Leptin, adiponectin, insulin-like growth factor (IGF-1), and plasma levels of cortisol were measured with immune-enzymatic assays; urinary lactulose/mannitol and serum amino acids were measured with high-performance liquid chromatography. ClinicalTrials.gov: NCT00133406.
RESULTS: Glutamine treatment significantly improved weight-for-height z-scores compared to the placebo-glycine control treatment. Either glutamine alone or all nutrients combined prevented disruption of the intestinal barrier function, as measured by the percentage of lactulose urinary excretion and the lactulose:mannitol absorption ratio. Plasma leptin was negatively correlated with plasma glutamine (p= 0.002) and arginine (p= 0.001) levels at baseline. After glutamine treatment, leptin was correlated with weight-for-age (WAZ) and weight-for-height z-scores (WHZ) (p#0.002) at a 4-month follow-up. In addition, glutamine and all combined nutrients (glutamine, vitamin A, and zinc) improved the intestinal barrier function in these children.
CONCLUSION:Taken together, these findings reveal the benefits of glutamine alone or in combination with other gut-trophic nutrients in growing children via interactions with leptin.
KEYWORDS: Micronutrients; Stress; Growth and Development; Intestinal Barrier Function; Hormonal Biomarkers.
Lima AA, Anstead GM, Zhang Q, Figueiredo IL, Soares AM, Mota RM, et al. Effects of glutamine alone or in combination with zinc and vitamin A on growth, intestinal barrier function, stress and satiety-related hormones in Brazilian shantytown children. Clinics. 2014;69(4):225-233.
Received for publication onAugust 14, 2013;First review completed onAugust 30, 2013;Accepted for publication onAugust 30, 2013 E-mail: [email protected]
*corresponding author
Tel.: 55 85 3366–8239
& INTRODUCTION
Malnutrition is highly prevalent among children under five years old in developing regions around the world (1). Underweight, defined by weightforage zscores less than -2 SD (reflecting acute malnutrition), affects 10% of these children, which amounts to approximately 55 million children worldwide (1). Stunting, defined by height-for-age z-scores of less than -2 SD (reflecting chronic malnutri-tion), affects 31% of these children, or approximately 170 Copyrightß2014CLINICS– This is an Open Access article distributed under
the terms of the Creative Commons Attribution Non-Commercial License (http:// creativecommons.org/licenses/by-nc/3.0/) which permits unrestricted non-commercial use, distribution, and reproduction in any medium, provided the original work is properly cited.
No potential conflict of interest was reported.
million (1). Wasting, defined by a weight-for-height-for-age z score of less than -2 SD, affects 27% of children and is a condition resulting from stunting, wasting, or both (2). Childhood and maternal malnutrition are responsible for 21% of the global disability-adjusted life years (DALYs) and 2.2 million deaths annually (2).
The global extent of glutamine and arginine deficiency is not well known, although one study has reported that even nourished children or only mild-to-moderate undernour-ished children often have low plasma concentrations of both of these amino acids (3). Furthermore, deficiencies of vitamin A and zinc are estimated to result in 0.6 and 0.4 million deaths, respectively, and account for a potential total of 9% of global childhood DALYs (2,4).
Children with heavy enteric diseases and diarrheal burdens early in life often suffer from life-threatening malnutrition and growth retardation. Those children who survive to later childhood or adulthood tend to have poor physical fitness and reduced academic and work accomplishments, which are associated with compromised cognitive development, and for women, offspring with lower birth weights (5).
Hormone levels in growing children, such as leptin, insulin-like growth factor-1 (IGF-1), adiponectin, and cortisol, are affected by nutritional factors, daily diet, or both during childhood. Leptin is produced primarily in the adipose tissue and is positively associated with body weight, body fat mass, and recent energy intake (6). In non-obese persons, increased serum concentrations of leptin are associated with decreased appetite (6). Adiponectin, like leptin, is also produced by adipose tissue. However, in contrast to leptin, serum concentrations of adiponectin are lower in obesity and higher in individuals with lower body fat mass (7). IGF-1 is an insulin-like hormone released by the liver that reflects the hepatic anabolic-catabolic balance and is increased by both caloric and protein intake (8). Thus, IGF-1 is a useful biomarker for assessing nutritional status (9). In contrast, cortisol levels are increased in malnutrition (10). These hormones have interrelated effects on human growth: leptin potentiates the action of IGF-1, whereas glucocorticoids (such as cortisol) decrease IGF-1 expression, interfere with IGF-1 signaling, and induce IGF-1 resistance (11). In addition to their effects on human somatic growth, these hormones may also affect immune responses. Adiponectin and cortisol are associated with decreased pro-inflammatory responses, whereas leptin and IGF-1 are associated with an increased inflammatory state, which may represent a compensatory adaptation to tissue recovery (12). Nutrient tissue tropism, gut function, and growth have critical relationships with variations in hormonal levels, although these relationships have only recently emerged as an important research area with potential relevance for effective nutritional interventions (13).
Nutrients such as zinc and vitamin A potentially benefit the catch-up growth following enteric infections and diarrhea (14). In an animal study performed by our group, zinc and glutamine improved behavior and growth in undernourished mice during suckling (15). This improved health status following intervention may be reflected by increases in anabolic hormonal levels, such as IGF-1, reflecting systemic improvements in physical growth and fat mass. Zinc is known to increase serum levels of IGF-1 and leptin (16). Retinoids may increase IGF-1 synthesis in the liver and aggravate the detrimental effects of corticos-teroids on IGF-1 activity (17).
Glutamine, vitamin A, and zinc are known to enhance gut barrier function by potentially improving nutrient absorption; therefore, they may benefit growth development (3,18). In fact, our group showed that oral administration of a glutamine derivative, alanyl-glutamine, improved both the intestinal barrier and weight gain in children living in an urban community in Fortaleza, CE, Brazil (3). Thus, we hypothesized that glutamine supplementation alone or in combination with vitamin A and zinc would have a positive impact on the intestinal barrier function and consequently trigger growth improvements in young children (3). These associations would be positively correlated with increased plasma leptin and IGF-1 levels and negatively correlated with cortisol and adiponectin. In addition, we investigated whether the combination of glutamine with zinc and vitamin A (two critical gut-trophic nutrients) would additively improve the aforementioned parameters compared with glutamine alone.
& MATERIALS AND METHODS
Ethics
The study was approved by the Institutional Review Boards (IRBs) of the Federal University of Ceara´ (UFC), Fortaleza, Ceara´, Brazil, and the University of Virginia. Informed consent was obtained from all participants.
Environment and population
The study population is located in the Parque Universita´rio community (3
˚
44’58.27’’ south and 38˚
34’30.80’’ west) in Fortaleza, Ceara´, northeast Brazil, which is 5 km distant from the Clinical Research Unit and Institute of Biomedicine/ Center for Global Health (www.upcibimed.ufc.br) labora-tories in Fortaleza. Fortaleza has an estimated population of 2.6 million inhabitants and an infant mortality rate of 35 deaths per 1,000 live births. A 1998 census of Parque Universita´rio revealed a total population of 3,541 inhabitants, of which 957 (27%) were children under the age of 9. The children in this study were a subset of a larger cohort residing in historically endemic settings of enteric and diarrheal illnesses and were thereafter enrolled in a randomized, double-blind, community-based trial to examine the effects of glutamine, vitamin A, and zinc on intestinal barrier function and physical growth. Children aged three months to nine years were initially identified by a community census and screened for height or length measurements. Children were selected if they met the following inclusion criteria: (a) height (or length)-for-age z-scores (HAZ) less than the median for this population (-0.06 z-score), (b) community residency, and (c) parental or guardian consent. The exclusion criteria were as follows: (a) no sibling enrolled in this or any other study in the last two years, (b) a fever.38˚
C at time of enrollment, and (c) a recognizable chronic condition affecting growth, such as celiac disease, tuberculosis, or any clinically identifiable chronic disease. Figure 1 shows a chart of the subjects enrolled in the study protocol. The treatment protocol is summarized in Table 1.Study design
team (1 nurse and 2 community health workers) inter-viewed parents and children to collect demographic information, including age, gender, birth weight, level of maternal education, family income, and baseline anthropo-metric information. A consultant statistician assessed the study design and power. The participants and the study team were blinded to the intervention assignment. Demographic and anthropometric data, information on adverse events and serious adverse events, and laboratory data were collected in case report forms at the field area and at laboratories located at the INCT-Biomedicine, UFC. The adverse event and serious adverse event recording and reporting system were developed and monitored by the
National Institutes of Health (NIH), the National Institute of Allergy and Infectious Diseases (NIAID), and the Division of Microbiology and Infectious Diseases (DMID).
Nutritional intervention and surveillance
A total of 314 children were randomized with respect to receiving vitamin A (100,000 IU retinyl palmitate if ,12 months old or 200,000 IU retinyl palmitate if $12 months old every four months), which was given in one dose at 0, 4, and 8 months into the study protocol; zinc, which was given twice weekly at a dose of 40 mg; or both vitamin A and zinc. The study was conducted for 1 year, and half of each group received glutamine (16-g daily dose given over ten days
Figure 1- Flow of micronutrient supplementation and biochemistry blood testing to study growth, intestinal barrier function, stress
starting at the first month of the study protocol) (22). A total of 167 children were available and eligible for cognitive testing. Trained health care agents working on the study surveillance team administered the micronutrients. The health care workers administered the micronutrients during home visits with direct observation of intake.
L-Glutamine was obtained from Rexim (Courbevoie, France); L-glycine and zinc acetate were obtained from Spectrum Chemicals (Gardena, CA, USA); vitamin A (retinyl palmitate in vegetable oil with 40 IU of alpha-tocopherol as an antioxidant) was obtained from Hoffman-La Roche, Basel, Switzerland. Isomolar glycine (8.3 g/daily) was used as a placebo for glutamine, Tanjal juice was used as a placebo for zinc, and the same amounts of alpha-tocopherol and vegetable oil were used as a placebo for vitamin A. Tocopherol was chosen as a placebo for vitamin A because it is also a fat-soluble vitamin and the tocopherol dosing preparation is similar to that of vitamin A (capsule dosing). The color, size, and taste were the same between vitamin A and placebo capsules.
A computer-generated random number list was used to assign children to one of eight treatment arms: 1) Placebo; 2) Glutamine; 3) Zinc; 4) Vitamin A; 5) Glutamine + Zinc; 6)
Glutamine+Vitamin A; 7) Zinc+Vitamin A; or 8) Glutamine + Zinc + Vitamin A. The treatment group and the oral
treatment regimen, including dose, frequency, and duration of supplementation, are outlined in Table 1. A member of the field study team who was blinded to the treatment group administered the supplements and visited each child twice weekly to assess tolerance and any adverse effects of supplementation. No significant differences in the rate of adverse events were identified between the treatment groups.
Biochemical analyses
Blood samples were collected from fasted subjects at 0 and 4 months, and the samples were stored at -80
˚
C untilanalysis. Glutamine and arginine were measured as reported elsewhere (19). Leptin, adiponectin, IGF-1, and cortisol levels were measured in plasma samples using an enzyme-linked immunosorbent assay according to the manufacturer’s instructions (R&D Systems, Minneapolis, MN).
Anthropometric measurements
Anthropometric measurements were obtained at 0, 4, and 8 months. A calibrated digital weight scale with 100 g precision (Tanita Solar Scale, Tanita Corporation of America Inc., Arlington, IL) was used to weigh each child. All measurements were performed using standard methods, as described elsewhere (3). Weights were measured with a calibrated digital weighing scale with 100 g precision (Tanita Solar Scale, Tanita Corporation of American Inc., Arlington, IL). Height was measured in the supine position for children under 24 months old and standing for children aged 24 months or older using an anthropometric rod with an accuracy of 0.1 cm. As markers of physical development and nutritional status, HAZ, weight-for-age z-scores (WAZ), and weight-for-height z-scores (WHZ) were calculated using the anthropometric software Epi-Info (Centers for Disease Control, Atlanta, GA, USA). These anthropometric z-scores represent the number of standard deviations above or below the median values for the National Center for Health Statistics (NCHS) and the International Reference Population (21).
Intestinal permeability assay
The intestinal permeability assay was performed at 0 and 4 months, as described in the protocol (Figure 1). The children were fasted for at least 3 hours prior to ingesting 20 mL of a solution containing lactulose (250 mg/mL; Lactulona, Luitpold Produtos Farmaceˆuticos Ltda., Barueri, Sa˜o Paulo, SP) and mannitol (50 mg/mL;
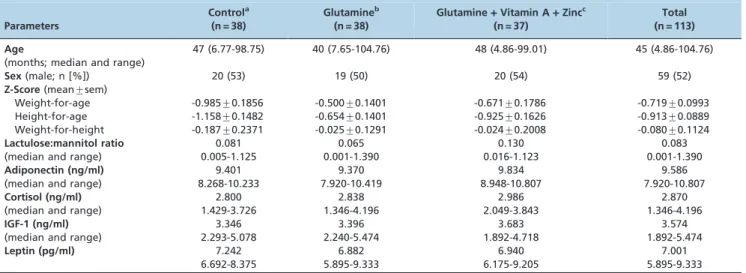
Table 1 -Characteristics of children at baseline, including age, sex, anthropometric indices, intestinal permeability, and treatment group.
Parameters
Controla
(n = 38)
Glutamineb
(n = 38)
Glutamine+Vitamin A+Zincc
(n = 37)
Total (n = 113) Age
(months; median and range)
47 (6.77-98.75) 40 (7.65-104.76) 48 (4.86-99.01) 45 (4.86-104.76)
Sex(male; n [%]) 20 (53) 19 (50) 20 (54) 59 (52)
Z-Score(mean¡sem)
Weight-for-age -0.985¡0.1856 -0.500¡0.1401 -0.671¡0.1786 -0.719¡0.0993 Height-for-age -1.158¡0.1482 -0.654¡0.1401 -0.925¡0.1626 -0.913¡0.0889 Weight-for-height -0.187¡0.2371 -0.025¡0.1291 -0.024¡0.2008 -0.080¡0.1124
Lactulose:mannitol ratio
(median and range)
0.081 0.005-1.125
0.065 0.001-1.390
0.130 0.016-1.123
0.083 0.001-1.390
Adiponectin (ng/ml)
(median and range)
9.401 8.268-10.233
9.370 7.920-10.419
9.834 8.948-10.807
9.586 7.920-10.807
Cortisol (ng/ml)
(median and range)
2.800 1.429-3.726
2.838 1.346-4.196
2.986 2.049-3.843
2.870 1.346-4.196
IGF-1 (ng/ml)
(median and range)
3.346 2.293-5.078
3.396 2.240-5.474
3.683 1.892-4.718
3.574 1.892-5.474
Leptin (pg/ml) 7.242 6.692-8.375
6.882 5.895-9.333
6.940 6.175-9.205
7.001 5.895-9.333
There were no significant differences between the control group and the treatment groups (p.0.05). The intervention protocol was performed as follows:
aControl group = tocopherol (40 IU) at 0 and 4 months; zinc vehicle (tangerine juice) twice a week for four months; and isomolar glycine (8.3 g/day for ten
days starting at month one of the study protocol).
bGlutamine group = 16.2 g/day for ten days starting at month one of the study protocol.
cGlutamine plus vitamin A plus zinc group = glutamine following the dose and schedule described above; vitamin A (retinyl palmitate, 100,000 IU for
HenriFarma Produtos Quı´micos e Farmaceˆuticos Ltda., Sa˜o Paulo, SP). Urine samples were collected after lactulose and mannitol ingestion and were stored at -80
˚
C until analysis.Sample size and statistical analyses
Based on previously published data (3), a sample size of 35 for each group was chosen with an effect of 0.36 SD with 80% power (2-tailed test with a type I error of 5%) in the mean WHZ, WAZ, and HAZ changes among children receiving glutamine, glutamine plus zinc and vitamin A, or the placebo-glycine control group, with an estimate of 15% loss to follow-up. For the secondary parameter, the lactulose:mannitol ratio (pilot data: mean 0.13¡0.04 SD), an estimated sample size of at least 35 subjects for each treatment group was calculated for the intervention study, assuming a 30% loss to follow-up (p,0.05, power: 80%). To assess treatment-related differences in the plasma concen-trations of leptin, adiponectin, IGF-1, and cortisol, we determined an effect size of 0.7 SD with these group-wise comparisons and two-sided statistical analyses, and a sample size of approximately 41 subjects per treatment group was estimated (p,0.05, power: 80%).
The data were entered twice and were validated by three independent personnel using Access software (Microsoft Corporation, New York, NY). Epi Info Nutstat software (version 6.0; Centers for Disease Control and Prevention, Atlanta, GA) was used to calculate the nutritional para-meters. Parametric (Student’s t tests) and non-parametric (Mann-Whitney test) tests, along with the chi-square test or Fisher’s exact test for categorical variables, were used as indicated to compare differences between the treatment groups. Either Pearson (product-moment correlation) or Spearman (two continuous variables) correlations were used to assess associations between plasma hormone levels and anthropometrics. An analysis of covariance was used to examine associations between hormone concentrations and anthropometric parameters. All statistical analyses were performed using the Statistical Package for Social Sciences, version 11.5 (SPSS Inc., Chicago, IL).P-values of 0.05 or less were accepted as statistically significant. GraphPad Prism version 3.0 (GraphPad Software, San Diego, CA) was used for figures and tables.
& RESULTS
The children had an overall median age of 37 months at the study onset (range: 4.9 to 109.6 months), and the control and treatment groups were not significantly different at baseline with respect to age, sex, anthropometry, or lactulose:mannitol ratio (Table 1).
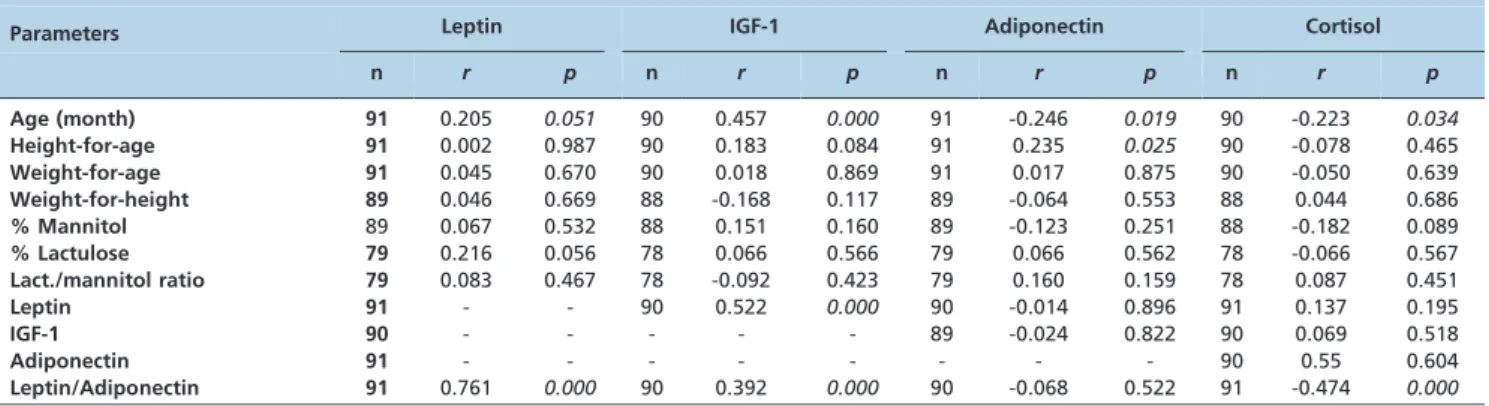
The plasma concentrations of hormones at baseline were as follows (median and range): leptin = 7.0 (5.89-9.33) pg/ mL; IGF = 3.57 (1.89-5.47) ng/mL; adiponectin = 9.58 (7.92-10.8) ng/mL; cortisol = 2.87 (1.34-4.19) ng/mL (Table 1). Leptin and IGF-1 were positively correlated with age, height, and weight in these children at baseline (Table 2). Adiponectin and cortisol decreased with increasing age, height, and weight (Table 2). Only adiponectin had a significant positive correlation with HAZ. None of the intestinal barrier function parameters, such as percentage of mannitol and lactulose urinary excretion and the lactulo-se:mannitol ratio were significantly correlated with leptin, IGF-1, adiponectin, or cortisol (Table 2). The leptin/ adiponectin ratio was positively correlated with age
(Spearman’s correlation; n = 91;r= 0.32;p= 0.0018). Z-scores for WAZ, HAZ, and WHZ or intestinal barrier function parameters were not significantly correlated with the leptin/adiponectin ratio (Spearman’s correlation; p.0.05). Only leptin had significant positive correlations with IGF-1 at baseline, and the leptin/adiponectin ratio was also positively correlated with IGF-1 and was significantly negatively correlated with cortisol (Table 2).
Figure 2 shows the cumulative changes (final minus initial measurement for the eight-month follow-up). The cumulative changes in WHZ (adjusted for age) over the eight-month follow-up period revealed a significant increase in the glutamine group compared with the placebo group (0.26¡0.02 vs. -0.08¡0.01; p= 0.03); however, the changes in WAZ and HAZ were not significant (data not shown). The combination of glutamine with zinc and vitamin A improved growth; however, the improvement was not significant when compared to the placebo-glycine group (0.096¡0.05;p= 0.277).
Glutamine treatment significantly reduced the percentage of lactulose (median: 0.16 and range: 0.02-3.08 vs.median: 0.52 and range: 0.01-25.17; p= 0.008) and the urinary mannitol excretion (2.99 and 0.05-24.07 vs. 6.89 and 0.17-35.5;p= 0.0038) compared with the placebo-glycine group. All of the nutrients combined also significantly decreased the lactulose:mannitol ratio compared with the glutamine-treated group (0.079 and 0.009-0.52vs. 4.73 and 0.27-45.83; p= 0.041). The lactulose:mannitol scores were not signifi-cantly correlated with the hormone levels assessed before or after treatment with glutamine or in combination with vitamin A and zinc.
A total of 27 children (27/104; 26%) experienced adverse events, and 13 children (13/104; 12.5%) had serious adverse events. The rates of adverse and serious adverse events were similar in all study groups (p.0.05). The most common serious adverse events were respiratory infections (n = 4), pneumonia (n = 2), asthma complications (n = 6), and diarrhea (n = 1). There were no deaths.
Treatment with glutamine alone or all nutrients combined did not significantly affect the selected plasma hormone levels at four months of evaluation (p,0.05). Differences identified between the treatment groups were also not altered by glutamine alone or glutamine combined with vitamin A and zinc. We examined the plasma glutamine and arginine concentrations at baseline with respect to the hormone concentrations and noted a significant positive correlation between glutamine and arginine concentrations (Pearson correlation; n = 62, r= 0.83, p,0.0001) and signifi-cant negative correlations between leptin and both gluta-mine and arginine (n = 56; leptin vs. glutamine, r= -0.27, p= 0.042; leptin vs. arginine, r= -0.35, p= 0.007) (Figure 3). The significant negative correlations between leptin and both glutamine and arginine were abolished by 4 months of treatment with glutamine (n = 19; leptin vs. glutamine, r= -0.15,p= 0.51; leptinvs. arginine,r= -0.423,p= 0.071).
between the leptin or the leptin/adiponectin ratio and WAZ/WHZ. The percentage of lactulose excretion and the lactulose:mannitol ratio were also significantly associated with leptin plasma levels in the control group at four months; however, treatment with glutamine alone or in combination with vitamin A and zinc did not show this association. Controls and subjects treated with glutamine alone or in combination with vitamin A and zinc continued to demonstrate positive correlations between IGF-1 plasma concentrations and age, height, and weight at four months. A negative correlation was observed at four months between IGF-1 and delta-HAZ, although there was a significant positive correlation between IGF-1 delta-WHZ. Treatment with glutamine alone abolished the negative correlation between adiponectin plasma concentrations and age. Because leptin levels were associated with growth parameters and leptin was associated with glutamine alone or in combination with vitamin A and zinc, we further analyzed leptin concentrations at four months (i.e., after treatment), controlling for paired initial leptin concentra-tions (at time 0), gender, and WAZ at time 0. Table 3 summarizes these analyses. Among the subjects treated
with glutamine alone or in combination with vitamin A and zinc, leptin plasma levels were significantly correlated with WAZ and WHZ, even after controlling for gender and the leptin plasma level at baseline.
& DISCUSSION
This double-blinded, controlled clinical trial enrolled children at risk for enteric infections and diarrhea and demonstrated that glutamine treatment significantly enhanced physical growth, as determined by improvements in cumulative WHZ, compared to the placebo-glycine group. The positive effect of glutamine on growth was consistent with our previous report showing that treatment with alanyl-glutamine (a glutamine-derivative dipeptide) improved child growth rates after a four-month follow-up compared to placebo controls in the same setting (3). Additionally, the benefit of this nutrient on the intestinal barrier function was shown by decreased lactulose epithelial permeation (i.e., reduced urinary excretion) in the lactulo-se:mannitol assay, which is an indicator of a more intact intestinal epithelial barrier.
Our data indicated that leptin and IGF-1 were positively correlated with age, height, and weight in these children at baseline, whereas adiponectin and cortisol plasma levels decreased with increasing age, height, and weight. Thus, these hormone levels may provide a marker not only for obesity and metabolic syndrome but also for nutritional status in children, especially during catch-up growth in children with lower HAZ (lower than the median z-score of the study population). In addition, the catch-up growth after diarrheal illnesses and the growth and satiety-related hormone levels may be strongly influenced by a genetic component (20,21).
In addition, our findings indicate that plasma leptin and the leptin/adiponectin ratio had a significant positive correlation with IGF-1; however, the leptin/adiponectin ratio had a significant negative correlation with cortisol. Leptin was originally suggested as an ‘‘anti-obesity’’ hormone because of its suppressive effects on appetite, which was further supported by animal studies. However, the relationships between ob/ob leptin tissue receptors and leptin signaling proved to be far more complex, as treatment of obese individuals with leptin mostly failed to promote weight loss due to increased tissue resistance to leptin (22,23).
Table 2 -Spearman correlation coefficients for leptin, IGF-1, adiponectin, and cortisol plasma levelsvs.age, anthropometric measures, and intestinal barrier function parameters in young children.
Parameters Leptin IGF-1 Adiponectin Cortisol n r p n r p n r p n r p
Age (month) 91 0.205 0.051 90 0.457 0.000 91 -0.246 0.019 90 -0.223 0.034
Height-for-age 91 0.002 0.987 90 0.183 0.084 91 0.235 0.025 90 -0.078 0.465
Weight-for-age 91 0.045 0.670 90 0.018 0.869 91 0.017 0.875 90 -0.050 0.639
Weight-for-height 89 0.046 0.669 88 -0.168 0.117 89 -0.064 0.553 88 0.044 0.686
% Mannitol 89 0.067 0.532 88 0.151 0.160 89 -0.123 0.251 88 -0.182 0.089
% Lactulose 79 0.216 0.056 78 0.066 0.566 79 0.066 0.562 78 -0.066 0.567
Lact./mannitol ratio 79 0.083 0.467 78 -0.092 0.423 79 0.160 0.159 78 0.087 0.451
Leptin 91 - - 90 0.522 0.000 90 -0.014 0.896 91 0.137 0.195
IGF-1 90 - - - 89 -0.024 0.822 90 0.069 0.518
Adiponectin 91 - - - 90 0.55 0.604
Leptin/Adiponectin 91 0.761 0.000 90 0.392 0.000 90 -0.068 0.522 91 -0.474 0.000
n= number of children;r= Spearman correlation coefficient;p= statistical significance value.
Figure 2 - Cumulative weight-for-height z-score (WHZ) with
Recently, serum leptin levels have been associated with increased body mass index in both children and adults (24). In undernourished children at baseline, plasma leptin levels
have been positively correlated with IGF-1 levels and negatively correlated with cortisol levels (10,25). IGF-1, the growth hormone mediator, may function in concert with leptin to enhance childhood somatic growth (10,25). Adiponectin serum levels have been found to be consis-tently negatively correlated with body fat mass (26). However, in this study, adiponectin, leptin, IGF-1, and cortisol plasma concentrations were not significantly asso-ciated with body weight.
Glutamine and arginine levels in undernourished chil-dren have not been well documented. In the current study, the concentrations of these two amino acids were lower than the normal range observed in healthy children (glutamine: 0.479-0.821mmol/mL; arginine: 0.120-0.144mmol/mL) (3). In
addition, glutamine and arginine plasma levels showed consistent and significant positive correlations with each other, suggesting that these important amino acids syner-gistically interact to exert beneficial effects on child growth and development. However, the mechanisms underlying these interactions remain unclear. Recently, glutamine has been associated with improved intestinal barrier function and improved child growth and development in various pre-clinical and clinical studies (3,4). Both glutamine and arginine stimulate immune responses and intestinal cell proliferation and migration through protein kinase-depen-dent pathways, and they appear to have an additive effect on these cells (27,28). Plasma leptin concentrations were significantly negatively correlated with plasma glutamine and arginine levels at baseline in this study. These results suggest that leptin co-regulates amino acid uptake in target cells, which might have implications for childhood growth. As shown in this work, treatment with glutamine comple-tely abolished the negative correlation of leptin with these two plasma amino acids, suggesting that these amino acids downregulate leptin secretion and may stimulate fat deposition.
Leptin and IGF-1 showed significant positive correlations with age, and adiponectin and cortisol showed significant negative correlations with age. Previous studies have also shown that leptin and IGF-1 levels increase with age, while adiponectin and cortisol levels decrease with age (11). During puberty, leptin levels increase dramatically, whereas adiponectin levels decrease (29,30). Our findings revealed a similar pattern with respect to these hormones and weight/ height. Thus, leptin and IGF-1 were significantly positively correlated with weight and height, whereas adiponectin and cortisol were significantly negatively correlated with weight and height. A recent work also reported a positive correlation of leptin and IGF-1 with body mass index and height-for-age in normally nourished children and a positive correlation of plasma IGF-1 with mid-arm circum-ference and height-for-age score in malnourished children (25). Researchers consistently agree that plasma leptin levels in children and adults are associated with body mass index, fat mass, insulin resistance, and dyslipidemia (24). However, adequate concentrations of leptin are necessary for immune competence because this hormone enhances thymic growth, lymphocyte proliferation, and macrophage pro-inflammatory response (31). Conversely, although adiponectin may have beneficial cardiovascular effects, excessive levels, as observed in malnutrition, may be immunosuppressive (32).
Neither glutamine alone nor glutamine given with zinc and vitamin A altered plasma concentrations of leptin,
Figure 3 - Correlation at baseline between leptin, plasma
adiponectin, IGF-1, and cortisol. However, this study suggested that glutamine or all nutrients combined function in the co-regulation of leptin to improve WAZ and WHZ even after controlling for initial plasma leptin concentration and gender. Neither glutamine alone nor glutamine combined with zinc and vitamin A significantly altered the correlations of IGF-1, adiponectin, and cortisol with anthropometric measurements. One study examined the effect of zinc on leptin and ghrelin plasma concentrations and showed that this nutrient did not alter the concentra-tions of these hormones either during or after treatment; however, zinc improved the positive correlation between leptin and weight-for-age z-scores over a three-month period (13). Buyukgebiz and colleagues also reported that leptin was increased only in children who exhibited catch-up growth, and the increases in leptin levels were much higher in children with protein-energy malnutrition com-pared with healthy control children (33). The lack of an effect of these nutrients on plasma leptin concentrations does not rule out a possible influence on the leptin axis because the effect could be mediated via an excess of soluble plasma leptin receptor. Stein and colleagues showed that in severely malnourished children receiving nutritional sup-port, leptin and the molar excess of soluble leptin receptor divided by the leptin concentration are better biomarkers of nutritional status than IGF-1 during nutritional recovery (34). Because we did not measure the soluble leptin receptor, our analysis was limited to the leptin plasma concentration. These results suggest that glutamine given alone improves child growth as measured by the change in WHZ and that this effect partially correlated with increasing plasma leptin levels. An intestinal repair effect was observed with glutamine and glutamine plus vitamin A and zinc, based on the percentage of lactulose excretion and the lactulose:mannitol ratio, respectively; however, the intestinal barrier function was not significantly correlated with these plasma hormones. Moore and colleagues also found that plasma leptin levels had no detectable relation-ship with the intestinal barrier function in moderately malnourished rural Gambian children (35).
The intriguing finding of a negative correlation of plasma glutamine and leptin levels at baseline may be explained by a preexisting chronic inflammatory state of the study children, that inflammatory state could have increased blood C-reactive protein levels that may have impaired the leptin binding to leptin receptors and therefore increas-ing its circulatincreas-ing levels (36). The same chronic inflamma-tory state may have caused a decline in plasma glutamine levels, altogether these effects would have been ameliorated with glutamine supplementation.
We acknowledge that the study population shows some age heterogeneity, which could create some bias in the study analyses, although age and seasonality were con-trolled for in the analysis. There were totals of thirteen, ten, and ten children below two years old in the placebo, glutamine-treated, and three-nutrient-treated (glutamine, zinc, and vitamin A) groups, respectively. The covariance analyses of growth between these groups were performed with adjustments for age and season (dry and rainy seasons in Fortaleza); thus, the possible influences of these factors were taken into consideration. We also performed indepen-dent t test analyses, and we did not iindepen-dentify significant differences between groups after splitting the groups into ,2 years old and$2 years old. Another limitation was that HAZ (i.e., LAZ = length-per-age z-score for infants) might not be the best criterion for studying growth parameters in infants; however, HAZ has been indicated as a good surrogate measure of long-term growth deficits following enteric infections and diarrhea (4). To avoid the influence of any significant differences in the baseline data between groups, we used delta values (final minus initial value) for all observed growth parameters.
In conclusion, these results suggest that glutamine treatment improved growth as measured by the cumulative WHZ, possibly via interactions with leptin, as suggested by positive correlations with this satiety-related hormone. However, IGF-1, adiponectin, and cortisol were not corre-lated with increased WAZ and WHZ in this population. In addition, glutamine alone or all nutrients in combination (glutamine, vitamin A and zinc) improved the intestinal
Table 3 -Pearson correlations illustrating the relationship between plasma leptin concentrations, weight-for-age (WAZ), weight-for-height (WHZ), and change (0-4 months) in WAZ and WHZ in the placebo-glycine control and the glutamine treatment group (alone or in combination).
Ln (Leptin) t = 4 Ln (Leptin) t = 4 Ln (Leptin) t = 4
Treatment Group Variable Controlling for ln_Leptin t = 0
Controlling for ln_Leptin t = 0 and
sex Controlling for WAZ t = 0 Time (4 months) n r p n r p n r p
Control WAZ 27 0.192 0.347 27 0.189 0.365 29 0.010 0.958
WHZ 27 0.384 0.053 27 0.366 0.072 - -
-Delta WAZ 27 -0.346 0.083 27 -0.332 0.105 29 -0.010 0.958
Delta WHZ 27 -0.400 0.043 27 -0.397 0.050 - -
-Glutamine WAZ 25 0.524 0.009 25 0.525 0.010 30 0.244 0.202
WHZ 23 0.702 0.000 23 0.774 0.000 - -
-Delta WAZ 25 0.185 0.387 25 0.165 0.453 30 0.244 0.202
Delta WHZ 23 0.407 0.060 23 0.393 0.078 - -
-Glutamine plus WAZ 28 0.451 0.018 28 0.446 0.022 28 0.095 0.639
Vitamin A and WHZ 27 0.500 0.009 27 0.510 0.009 - -
-Zinc Delta WAZ 28 0.304 0.123 28 0.332 0.097 28 0.095 0.639
Delta WHZ 27 0.107 0.602 27 0.112 0.594 - -
barrier function, which likely contributed to the growth benefits observed in these children.
& ACKNOWLEDGMENTS
The Brazilian funding agency Conselho Nacional de Desenvolvimento Cientı´fico e Tecnolo´gico (CNPq) and the International Collaborations in Infectious Disease Research (ICIDR) program of the US NIH (Grant#5 U01 AI026512) supported this study.
& AUTHOR CONTRIBUTIONS
Lima NL coordinated the surveillance team. Soares AM and Mota RM were responsible for data safety, monitoring, and statistical analyses. Anstead GM and Zhang Q conducted the data analyses. Figueiredo IL prepared the manuscript. Lima AA, Guerrant RL, and Oria RB were responsible for study design and coordination.
All authors contributed significantly to the research and have read the manuscript, which has not been published and is not under consideration for publication elsewhere.
& REFERENCES
1. Who working group. Use and interpretation of anthropometric indica-tors of nutritional status. Bull WHO. 1986;64(6):929-41.
2. Black RE, Allen LH, Bhutta ZA, Caulfield LE, de Onis M, Ezzati M, et al. Maternal and child undernutrition: global and regional exposures and health consequences. Lancet. 2008;371(9608):243-60, http://dx.doi.org/ 10.1016/S0140-6736(07)61690-0.
3. Lima NL, Soares AM, Mota RM, Monteiro HS, Guerrant RL, Lima AA. Wasting and intestinal barrier function in children taking alanyl-glutamine-supplemented enteral formula. J Pediatr Gastroenterol Nutr. 2007;44(3):365-74, http://dx.doi.org/10.1097/MPG.0b013e31802eecdd. 4. Guerrant RL, Oria RB, Moore SR, Oria MO, Lima AA. Malnutrition as an
enteric infectious disease with long-term effects on child development. Nutr Rev. 2008;66(9):487-505, http://dx.doi.org/10.1111/j.1753-4887. 2008.00082.x.
5. Niehaus MD, Moore SR, Patrick PD, Derr LL, Lorntz B, Lima AA, et al. Early childhood diarrhea is associated with diminished cognitive function 4 to 7 years later in children in a northeast Brazilian shantytown. Am J Trop Med Hyg. 2002;66(5):590-3.
6. Ng PC, Lee CH, Lam CW, Chan IH, Wong E, Fok TF. Ghrelin in preterm and term newborns: relation to anthropometry, leptin and insulin. Clin Endocrinol. (Oxf). 2005;63(2):217-22, http://dx.doi.org/10.1111/j.1365-2265.2005.02328.x.
7. Ling H, Waterworth DM, Stirnadel HA, Pollin TI, Barter PJ, Kesaniemi YA, et al. Genome-wide linkage and association analyses to identify genes influencing adiponectin levels: the GEMS Study. Obesity (Silver Spring). 2009;17(4):737-44, http://dx.doi.org/10.1038/oby.2008.625. 8. Donahue SP, Phillips LS. Response of IGF-1 to nutritional support in
malnourished hospital patients: a possible indicator of short-term changes in nutritional status. Am J Clin Nutr. 1989;50(5):962-9. 9. Nindl BC, Alemany JA, Kellogg MD, Rood J, Allison SA, Young AJ, et al.
Utility of circulating IGF-I as a biomarker for assessing body composition changes in men during periods of high physical activity superimposed upon energy and sleep restriction. J Appl Physiol. 2007;103(1):340-6, http://dx.doi.org/10.1152/japplphysiol.01321.2006.
10. Kilic M, Taskin E, Ustundag B, Aygun AD. The evaluation of serum leptin level and other hormonal parameters in children with severe malnutrition. Clin Biochem. 2004;37(5):382-7, http://dx.doi.org/10. 1016/j.clinbiochem.2003.12.010.
11. Singleton JR, Baker BL, Thorburn A. Dexamethasone inhibits insulin-like growth factor signaling and potentiates myoblast apoptosis. Endocrinology 2000;141(8):2945-50, http://dx.doi.org/10.1210/endo.141.8.7621. 12. Lago R, Gomez R, Lago F, Gomez-Reino J, Gualillo O. Leptin beyond
body weight regulation-current concepts concerning its role in immune function and inflammation. Cell Immunol. 2008;252(1-2):139-45, http:// dx.doi.org/10.1016/j.cellimm.2007.09.004.
13. Arsenault JE, Havel PJ, Lopez de RD, Penny ME, Van Loan MD, Brown KH. Longitudinal measures of circulating leptin and ghrelin concentra-tions are associated with the growth of young Peruvian children but are not affected by zinc supplementation. Am J Clin Nutr. 2007;86(4):1111-9. 14. Ziegler TR, Evans ME, Fernandez-Estivariz C, Jones DP. Trophic and cytoprotective nutrition for intestinal adaptation, mucosal repair, and barrier function. Annu Rev Nutr. 2003;23:229-61, http://dx.doi.org/10. 1146/annurev.nutr.23.011702.073036.
15. Ladd FV, Ladd AA, Ribeiro AA, Costa SB, Coutinho BP, Feitosa GA, et al. Zinc and glutamine improve brain development in suckling mice subjected to early postnatal malnutrition. Nutrition. 2010;26(6):662-70, http://dx.doi.org/10.1016/j.nut.2009.11.020.
16. Chen MD, Song YM, Lin PY. Zinc may be a mediator of leptin production in humans. Life Sci. 2000;66(22):2143-9, http://dx.doi.org/10. 1016/S0024-3205(00)00541-5.
17. Dijkhuizen MA, Wieringa FT, West CE, Muherdiyantiningsih Muhilal. Concurrent micronutrient deficiencies in lactating mothers and their infants in Indonesia. Am J Clin Nutr. 2001;73(4):786-91.
18. van der Hulst RR, van Kreel BK, von Meyenfeldt MF, Brummer RJ, Arends JW, Deutz NE, et al. Glutamine and the preservation of gut integrity. Lancet. 1993;341(8857):1363-5, http://dx.doi.org/10.1016/ 0140-6736(93)90939-E.
19. Bidlingmeyer BA, Cohen SA, Tarvin TL. Rapid analysis of amino acids using pre-column derivatization. J Chromatogr. 1984;336(1):93-104. 20. Oria RB, Patrick PD, Oria MO, Lorntz B, Thompson MR, Azevedo OG,
et al. ApoE polymorphisms and diarrheal outcomes in Brazilian shanty town children. Braz J Med Biol Res. 2010;43(3):249-56.
21. Guerrant RL, Oria R, Bushen OY, Patrick PD, Houpt E, Lima AA. Global impact of diarrheal diseases that are sampled by travelers: the rest of the hippopotamus. Clin Infect Dis. 2005;41 Suppl 8:S524-30, http://dx.doi. org/10.1086/432946.
22. Halaas JL, Gajiwala KS, Maffei M, Cohen SL, Chait BT, Rabinowitz D, et al. Weight-reducing effects of the plasma protein encoded by the obese gene. Science. 1995;269(5223):543-6, http://dx.doi.org/10.1126/science. 7624777.
23. Gura T. Obesity research. Leptin not impressive in clinical trial. Science. 1999;286(5449):881-2.
24. Korner A, Kratzsch J, Gausche R, Schaab M, Erbs S, Kiess W. New predictors of the metabolic syndrome in children—role of adipocyto-kines. Pediatr Res. 2007;61(6):640-5, http://dx.doi.org/10.1203/01.pdr. 0000262638.48304.ef.
25. Haspolat K, Ece A, Gurkan F, Atamer Y, Tutanc M, Yolbas I. Relationships between leptin, insulin, IGF-1 and IGFBP-3 in children with energy malnutrition. Clin Biochem. 2007;40(3-4):201-5, http://dx. doi.org/10.1016/j.clinbiochem.2006.11.008.
26. Gilardini L, McTernan PG, Girola A, da Silva NF, Alberti L, Kumar S, et al. Adiponectin is a candidate marker of metabolic syndrome in obese children and adolescents. Atherosclerosis. 2006;189(2):401-7, http://dx. doi.org/10.1016/j.atherosclerosis.2005.12.021.
27. Rhoads JM, Argenzio RA, Chen W, Rippe RA, Westwick JK, Cox AD, et al. L-glutamine stimulates intestinal cell proliferation and activates mitogen-activated protein kinases. Am J Physiol. 1997;272(5 pt 1):G943-53.
28. Rhoads JM, Chen W, Gookin J, Wu GY, Fu Q, Blikslager AT, et al. Arginine stimulates intestinal cell migration through a focal adhesion kinase dependent mechanism. Gut. 2004;53(4):514-22, http://dx.doi.org/ 10.1136/gut.2003.027540.
29. Kratzsch J, Lammert A, Bottner A, Seidel B, Mueller G, Thiery J, et al. Circulating soluble leptin receptor and free leptin index during child-hood, puberty, and adolescence. J Clin Endocrinol Metab. 2002;87 (10):4587-94, http://dx.doi.org/10.1210/jc.2002-020001.
30. Koerner A, Kratzsch J, Kiess W. Adipocytokines: leptin—the classical, resistin—the controversical, adiponectin—the promising, and more to come. Best Pract Res Clin Endocrinol Metab. 2005;19(4):525-46, http:// dx.doi.org/10.1016/j.beem.2005.07.008.
31. Lord GM, Matarese G, Howard JK, Baker RJ, Bloom SR, Lechler RI. Leptin modulates the T-cell immune response and reverses starvation-induced immunosuppression. Nature. 1998;394(6696):897-901. 32. Yokota T, Oritani K, Takahashi I, Ishikawa J, Matsuyama A, Ouchi N,
et al. Adiponectin, a new member of the family of soluble defense collagens, negatively regulates the growth of myelomonocytic progeni-tors and the functions of macrophages. Blood. 2000;96(5):1723-32. 33. Buyukgebiz B, Ozturk Y, Yilmaz S, Arslan N. Serum leptin
concentra-tions in children with mild protein-energy malnutrition and catch-up growth. Pediatr Int. 2004;46(5):534-8, http://dx.doi.org/10.1111/j.1442-200x.2004.01951.x.
34. Stein K, Vasquez-Garibay E, Kratzsch J, Romero-Velarde E, Jahreis G. Influence of nutritional recovery on the leptin axis in severely malnourished children. J Clin Endocrinol Metab. 2006;91(3):1021-6, http://dx.doi.org/10.1210/jc.2005-1394.
35. Moore SE, Morgan G, Collinson AC, Swain JA, O’Connell MA, Prentice AM. Leptin, malnutrition, and immune response in rural Gambian children. Arch Dis Child. 2002;87(3):192-7, http://dx.doi.org/10.1136/ adc.87.3.192.