Body satisfaction and associated factors among high school
students
Satisfação com o peso corporal e fatores associados em estudantes do ensino médio
Satisfacción con el peso corporal y factores asociados en estudiantes de secundaria
Eduila Maria C. Santos1, Rafael Miranda Tassitano2, Wallacy Milton F. do Nascimento3, Marina de Moraes V. Petribú1,
Poliana Coelho Cabral4
Instituição:Universidade Federal de Pernambuco (UFPE), Recife, PE, Brasil
1Mestre em Nutrição pela UFPE; Professora Assistente I do Núcleo de
Nu-trição do Centro Acadêmico de Vitória da UFPE, Recife, PE, Brasil
2Mestre em Hebiatria pela UFPE; Professor Assistente I da Universidade
Federal Rural de Pernambuco (UFRPE), Recife, PE, Brasil
3Mestre em Educação Física pela Universidade Federal de Santa Catarina
(UFSC); Professor Assistente I da Associação Caruaruense de Ensino Superior (ASCES), Caruaru, PE, Brasil
4Doutor em Nutrição pela UFPE; Professor Adjunto do Departamento de
Nutrição da UFPE, Recife, PE, Brasil
ABstrAct
Objective: To analyze body satisfaction among students and its possible associations with nutritional status, socio-demographic factors, life style and health perception.
Methods: This cross-sectional study enrolled students aged 15 to 20 years of public schools from the city of Caruaru, North-east Brazil. Anthropometric, socio-demographic, life style and health perception, sleep, stress and body image variables were evaluated. The body mass index for gender and age was used to diagnose underweight, and overweight according to Conde and Monteiro (2006). Binary logistic regression was applied with the occurrence of “dissatisfaction with thinness”and “dis-satisfaction with excess weight” as outcomes.
Results: 594 students (62% females) aged 17.5±1.6 years old were studied. A proportion of 38.7% (95%CI 34.8-42.7) were satisied with their body weight, while 31.3% (95%CI 27.6-35.2) would like to increase it and 30.0% (95%CI 26.3-33.8) would like to reduce it. The students who were satisied with their weight ate at least ive servings of vegetables/day, three or more meals/day, and they had a positive perception of sleep. Males and individuals with low weight expressed the de-sire to increase their body weight, while females, students who have less than three meals/day, students with higher income, and those with overweight would like to reduce their weight. Among the males who would like to increase their body weight 13.5% had overweight and 18.8% of the females who desired to reduce their weight were underweight.
Conclusions: Preventive measures that include the discus-sion about body culture and health damage risks are needed. These measures should target genders’ speciicities.
Key-Words: body image; adolescent; nutritional status.
resumo
Objetivo: Investigar a satisfação corporal em estudantes e possíveis associações ao estado nutricional, fatores sociodemo-gráicos, estilo de vida e percepção de saúde.
Métodos: Estudo transversal realizado com estudantes de 15 a 20 anos de idade de escolas públicas do município de Caruaru (PE). Foram avaliadas variáveis antropométricas, sociodemo-gráicas, de estilo de vida e percepção de saúde, sono, estresse e imagem corporal. Utilizou-se o índice de massa corporal por gênero e idade para diagnosticar baixo peso, eutroia e excesso de peso, segundo o critério o Conde e Monteiro (2006). Na análise multivariada, recorreu-se à regressão logística binária, adotando-se a ocorrência de “insatisfação pela magreza” e de “insatisfação pelo excesso” como desfechos.
Resultados: Amostra composta por 594 estudantes (62% moças), com idade média de 17,5±1,6 anos. Uma proporção de 38,7% (IC95% 34,8-42,7) airmou estar satisfeito com o peso corporal, enquanto 31,3% (IC95% 27,6-35,2) gostariam de aumentar e 30,0% (IC95% 26,3-33,8) de reduzir o peso. Estudantes satisfeitos com o peso corporal consumiam pelo menos cinco porções de vegetais/dia, possuíam percepção
posi-Endereço para correspondência: Eduila Maria C. Santos
Rua José Braz Moscow, 2.075, apto. 401 – Candeias CEP 54410-390 – Jaboatão dos Guararapes/PE E-mail: [email protected]
Conflito de interesse: nada a declarar
tiva de sono e realizavam três ou mais refeições/dia. Rapazes e indivíduos com baixo peso apresentaram o desejo de aumentar o peso, enquanto moças, estudantes que realizavam menos de três refeições/dia, com maior renda e excesso de peso gostariam de reduzi-lo. Entre os rapazes que gostariam de aumentar o peso, 13,5% apresentavam excesso de peso e 18,8% das moças que queriam reduzir o peso estavam com baixo peso.
Conclusões: Há necessidade de realizar medidas preventivas que visem esclarecer sobre a cultura do corpo e o risco de danos à saúde, conduzidas de forma independente para cada sexo.
Palavras-chave: imagem corporal; adolescente; estado nutricional.
resumeN
Objetivo: Investigar la satisfacción corporal en estudiantes y posibles asociaciones con el estado nutricional, factores socio demográicos, estilo de vida y percepción de salud.
Métodos: Estudio transversal de estudiantes de 15-20 años de escuelas públicas del municipio de Caruaru - Pernambuco, Brasil. Se evaluaron variables antropométricas, socio demo-gráicas, de estilo de vida y percepción de salud, sueño, estrés e imagen corporal. Se utilizó el índice de masa corporal (IMC) por género y edad para diagnosticar bajo peso, eutroia y exceso de peso, según el criterio de Conde y Monteiro (2006). En el análisis multivariado, se recurrió a la regresión logística binaria, adoptando la ocurrencia de “insatisfacción por la delgadez” e “insatisfacción por el exceso” como desenlaces.
Resultados: Muestra compuesta por 594 estudiantes (62,0% muchachas), con promedio de edad de 17,5±1,6 años. Una pro-porción de 38,7% (IC 95% 34,8-42,7) airmó estar satisfecho con el peso corporal, mientras que a 31,3% (IC 95% 27,6-35,2) le gustaría aumentar y a 30,0% (IC 95% 26,3-33,8) le gustaría redu-cir el peso. Estudiantes satisfechos con el peso corporal consumen como mínimo cinco porciones de vegetales/día, poseen percepción positiva de sueño y realizan tres o más comidas/día. Muchachos e individuos con bajo peso presentaron el deseo de aumentar el peso, mientras que a muchachas, estudiantes que realizan menos de tres comidas/día, mayores ingresos y exceso de peso les gustaría reducir el peso. Entre los muchachos a quienes les gustaría aumentar el peso, 13,5% presentaban exceso de peso y 18,8% a quienes les gustaría reducir el peso estaban con bajo peso.
Conclusiones: Hay la necesidad de medidas preventivas con el objetivo de aclarar sobre la cultura del cuerpo y el riesgo de daños a la salud, conducidas de modo independiente para cada sexo.
Palabras clave: imagen corporal; adolescentes; estado nutricional.
Introduction
Determination of body image is inluenced by highly com-plex biophysical, psychological, environmental, and behavioral components(1). According to Saikali et al, the concept of body image involves three components: (a) perceptive, which concerns perceptions of one’s physical appearance, involving estimation of body weight and size; (b) subjective, which concerns appear-ance; (c) and behavioral, which comprises situations avoided by the individual as a means of avoiding discomfort associated with his or her appearance(2). Social factors, cultural inluences, pressure from the media, and the search for an ideal body ap-pear to be determinants of body-image distortion, particularly among adolescents(3).
Adolescence may be deined as the transitional period be-tween childhood and adulthood, which takes place bebe-tween the ages of 10 and 19(4). It is characterized by profound biological and psychosocial changes that involve intense growth and development(5). In the midst of hormonal, functional, affective, and social transformations, changes in physical build and bodily appearance take on an essential role(6), particularly during the period of physical change and budding development of second-ary sexual characteristics that is adolescence(7).
The culture of thinness imposes values and standards which, in turn, are conditioning factors of attitudes and behaviors related to appearance, body size, and overvaluation thereof(7), leading to feelings of discontent regarding one’s body. Body im-age dissatisfaction is associated with overweight and obesity(8,9); with changes in body weight(10); with gender (particularly female)(11,3); and with maternal perceptions of their children’s nutritional status in childhood and early adolescence(12).
Body image dissatisfaction may act as a driver of beneicial behavior, triggering adoption of healthy lifestyle habits such as a healthy diet and physical activity, and may thus lead to biophysical changes and improved perceptions of one’s body(1). In adolescence, however, body image dissatisfaction often leads to adoption of aberrant dietary habits and inadequate weight management practices, such as self-medication with diuretics and laxatives, purging, and exercising to exhaustion(13).
disorders compared to that of adolescents who are pleased with their body image(16).
The fact that distorted perceptions of body weight have adverse consequences on health and nutritional status and the paucity of available knowledge on this issue in municipalities in inland Brazil justify the present study, which seeks to inves-tigate body satisfaction among secondary students attending public schools in Caruaru, state of Pernambuco, Brazil, and assess potential associations between body image dissatisfac-tion, nutritional status, socio-demographic factors, lifestyle, and perceived health status.
method
This cross-sectional study was performed on a sample of 15-to-20-year-old students enrolled in the state-operated public school system of Caruaru, state of Pernambuco, Brazil.
The municipality of Caruaru is located in the arid area of the state of Pernambuco, in Northeast Brazil, 120 km from the state capital, Recife. Caruaru is considered the “capital” of the arid area of Pernambuco, and, according to State Department of Education and Culture (Secretaria da Educação e Cultura, SEDUC) data, was home to 8,833 secondary students distrib-uted among 15 public schools as of 2007.
Sample size was calculated in SampleXS, a sample calculator for cross-sectional studies made available by the World Health Organization (WHO). The following parameters were used: population, 8,833; conidence interval, 95%; maximum error, ±5%; design effect, 1.5; and, as the precise extent of high-risk health-related behaviors in secondary students in the municipal-ity of Caruaru is unknown, an estimated prevalence of 50%.
Using these parameters, the sample size was calculated as 541 subjects. In anticipation of refusal to participate, the estimated size was multiplied by 1.2, yielding a inal sample of 649 subjects. During the sample selection process, the proportion of students according to geographic region (within the municipality of Caruaru), school size, and period (day vs. night school) were taken into account. Students taking morn-ing and afternoon classes were grouped into a smorn-ingle category (daytime students).
A random, two-stage cluster sampling strategy was chosen. The irst stage was conducted at the school level; all state-operated secondary schools in Caruaru were deemed eligible for participation. School and student density in each microregion of the municipality and school size (small, medium, large) were used as stratiication criteria. School size was determined on the basis of student population: those serving more than
500 enrolled students were considered large; from 200 to 499 students, medium; and fewer than 200 students, small.
For the second stage of sampling, all classes (lowest sam-pling unit) of the selected schools were considered eligible for inclusion. The density of classes in each school and number of students enrolled in daytime and night classes were used as stratiication criteria. The Research Randomizer online application (available at http://www.randomizer.org) was used to generate random numbers for sampling. According to 2007 school census data, each secondary education class had 41 enrolled students on average. Therefore, 16 classes from eight secondary schools (58.6% of all schools in the municipality) were randomly selected. As the Department of Education could not provide a named list of students for random selection, the class was deined as the smallest sample unit; all students attending class on the day of data collection for their respective age range were thus invited to take part in the study. Students with physical or mental disabilities were excluded from the sample.
The Comportamentos de Risco em Adolescentes Catarinenses (COMCAP) questionnaire, which has already been validated in a sample of Brazilian public school students(17), was chosen as the data collection instrument. A pilot study conducted on a sample of Caruaru students in the same age range showed moderate-to-high reproducibility.
The dependent variable was body image satisfaction, an indirect measure of perceived body weight, with the following closed-ended response alternatives: “yes, I am [satisied]”; “no, I would like to gain [weight]” (dissatisfaction due to perceived underweight), and “no, I would like to lose [weight]” (dis-satisfaction due to perceived overweight). The independent variables comprised measures of nutritional status (Body Mass Index), socio-demographic and economic characteristics (gender, age, marital status, monthly household income, year of secondary education, and attendance of daytime or night classes), lifestyle habits (physical activity, sedentary behavior, fruit and vegetable intake, number of daily meals, smoking, and alcohol consumption), and health perception (overall health, sleep patterns, and stress).
digital platform scale (Plenna® Sport, São Paulo, Brazil; mea-surement range: 30–150kg).
The frequency, intensity, and duration of physical activity in four settings (at leisure, at home, for transportation, and at work) were investigated. Subjects were considered insufi-ciently active when they reported engagement in less than 60 minutes of moderate-to-vigorous physical activity per day, 5 or more days a week, and physically active when they engaged in moderate-to-vigorous physical activity for 60 or more minutes per day, 5 or more days per week. Daily television watching time was used as a surrogate marker of sedentary behavior. Students were divided into two groups: those who watched 3 hours of TV a day or less and those who watched more than 3 hours of TV a day.
Fruit and vegetable intake was considered adequate when subjects reported eating ive or more daily servings. The num-ber of daily meals was classiied as fewer than three or three or more meals per day.
Students were asked to describe their perception of the stress level of their lives. Subjects who reported feeling “nearly always or excessively stressed” were classiied as having a negative percep-tion of their stress level, and those who claimed to feel stressed “rarely or occasionally” as having a positive perception.
Concerning sleep quality, students were asked how often they experience a good night’s sleep. The closed-ended response alternatives were “always,” “nearly always,” “occasionally,” or “never”. Responses were then classiied into positive or nega-tive perception categories (subjects who chose “always”/“nearly always” or “occasionally”/“never”, respectively). Students who reported perceiving their overall health status as “excellent” and “good” were classiied as having a positive perception, and those who perceived it as “fair” or “poor,” as negative.
Data were tabulated in the EpiData 3.1 software environ-ment. A double data entry method was used to detect any errors in entry. The “Validate” function of EpiData was used to gener-ate a ile containing information on data entry errors, enabling correction and guiding the database review and cleanup process. Veriied data were then exported into the SPSS 15.0 software package for statistical analysis.
For descriptive analysis, categorical variables were expressed as frequency distributions and continuous variables, as means and standard deviations. The chi-square test was used to test for association between variables, with the chi-square test for trend used for variables on an ordinal scale. The association of each of the response categories of the dependent variable was assessed during this stage of analysis, with p-values calculated in Epi-Info 6.04d.
Binary logistic regression was the approach chosen for multivariate analysis, with “dissatisfaction due to perceived underweight” and “dissatisfaction due to perceived overweight” as the outcomes of interest. After crude analysis, a hierarchical model that had been previously constructed as recommended in the literature(20,21) was employed to establish the order of entry of independent variables into the regression equation.
The hierarchical approach adopted took three levels into account: distal, which included demographic and economic variables (gender, age range, marital status, monthly household income, day vs. night school); intermediate, which included perceived health status, sleep quality, physical activity, and fruit and vegetable intake; and proximal, which consisted of nutritional status and number of daily meals. The model was composed of analyses adjusted for each level and for the level preceding it. Adjusted regressions were also conducted on the two negative outcomes of interest, stratiied by gender and nutritional status [underweight and excess weight (overweight + obesity)]. The signiicance level was set at p<0.05 for all inferential statistics.
The study was approved by the Associação Caruaruense de Ensino Superior (ASCES) Human Research Ethics Committee, in accordance with Brazilian National Health Council Resolu-tion 196, which deines ethical standards for human subject research. Students who agreed to take part in the project were provided with information about the study and provided writ-ten informed consent. Furthermore, the present study was con-ducted with the approval of the Pernambuco State Department of Education, which provided school census data to support study design and analysis.
results
A total of 16 classes in eight schools were visited, as noted in the Methods section. Of the 624 students in attendance during the collection period, 24 (3.8%) refused to take part in the study, leaving a population of 600 potential subjects. Six questionnaires were later excluded due to missing infor-mation on body image satisfaction. The inal sample thus comprised 594 students (62.0% females) with a mean age of 17.5±1.6 years.
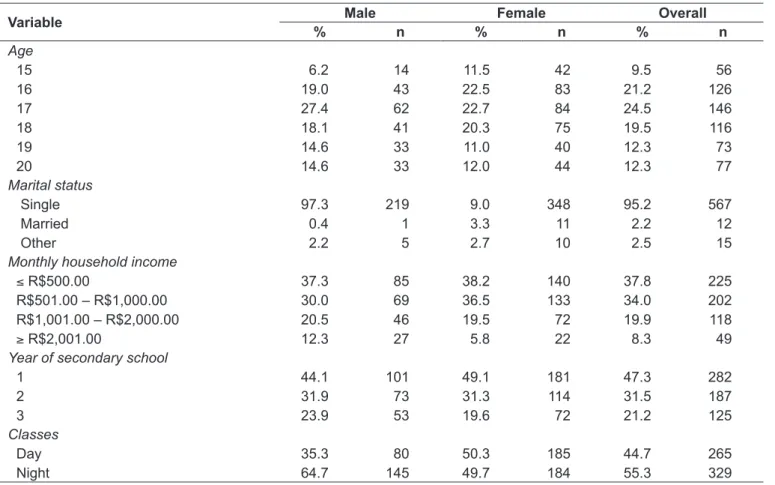
Most students were single, attended night school, and had a monthly household income of two minimum wages or less. Socio-demographic and educational data are shown in Table 1.
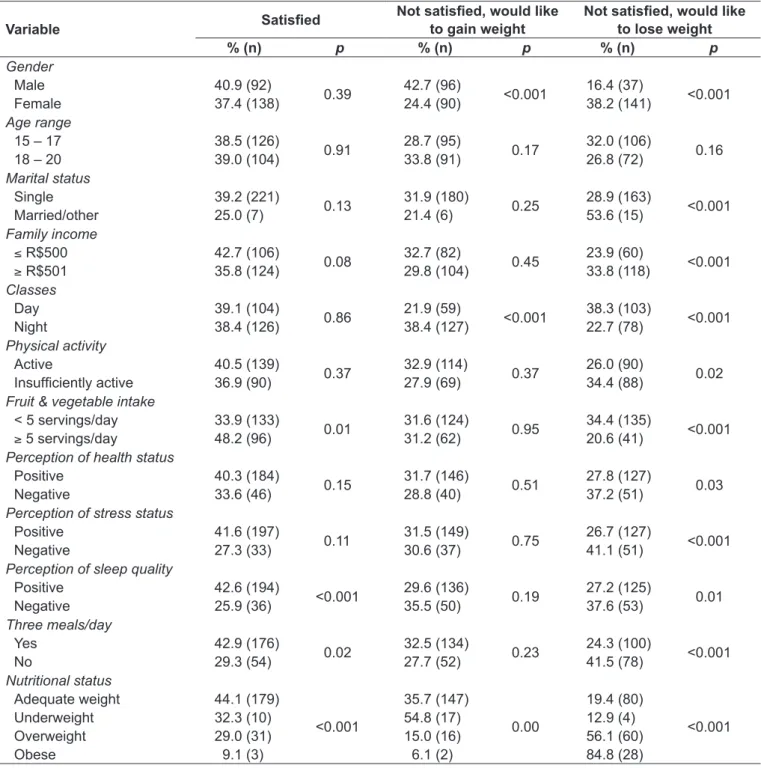
wanted to lose weight. No association was detected between body weight satisfaction and age. All other variables were sig-niicantly associated with the desire to lose weight, as shown in Table 2. In general, students who were pleased with their weight ate at least ive daily servings of fruit and vegetables, had a positive perception of sleep quality, and had three or more proper meals per day (p<0.05) (Table 2). Male subjects, those attending night classes, and those underweight were more likely to report a desire for weight gain (Table 2).
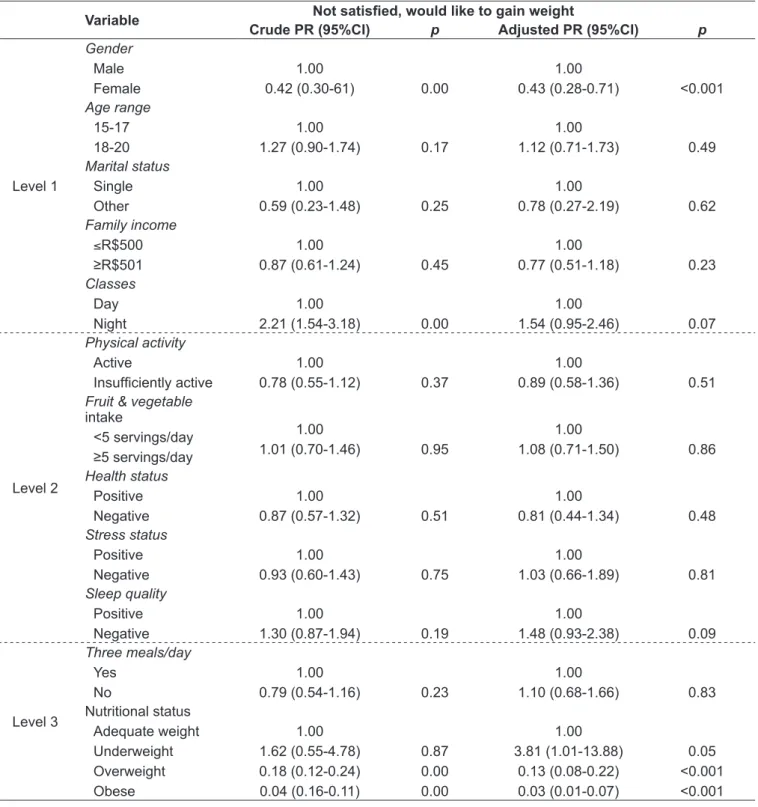
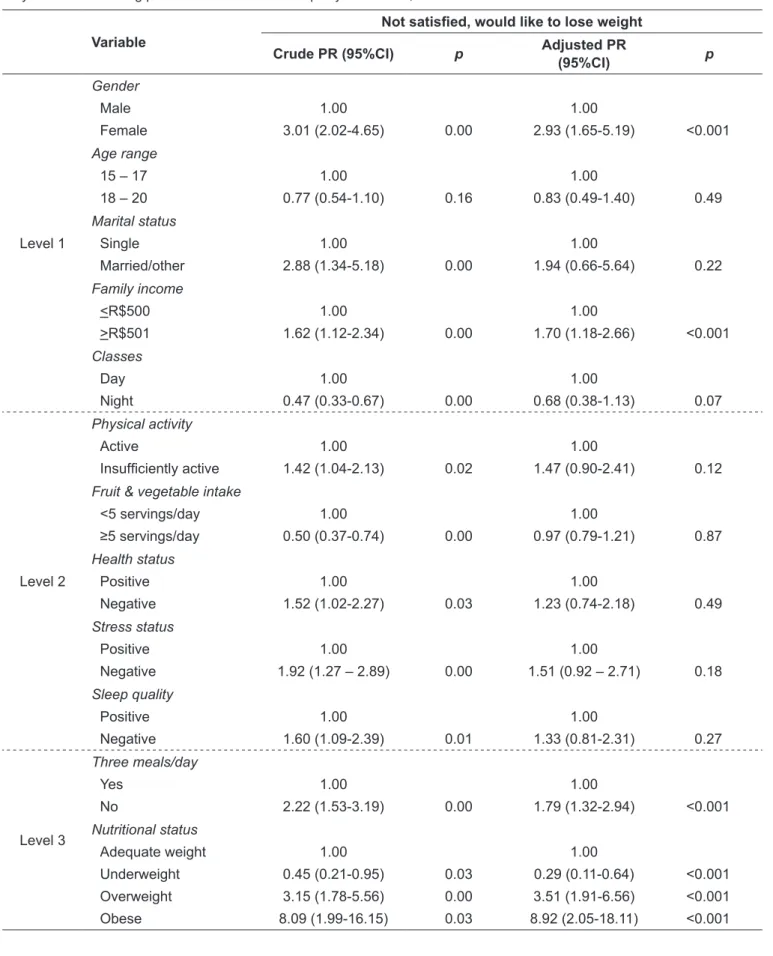
After adjusting for the possible confounders gender and nutritional status, female subjects were 54% less likely to re-port a desire to gain weight, whereas subjects with overweight and obesity were 87% and 97% less likely to report a desire to gain weight, as shown in Table 3. Female subjects, those with a higher household income, those who had fewer than three meals a day, and those actually overweight were all more likely to desire weight loss (Table 4).
Most underweight male subjects wished to gain weight—a signiicantly higher rate than that found among female subjects (p<0.05). Indeed, 13.5% of all male subjects reported a desire to gain body mass, even those who were
overweight. Among students who wanted to lose weight, the proportion of overweight females was signiicantly higher than that of males. Overall, 18.8% of female subjects wished to lose weight, including some who were already underweight (Figure 1).
Discussion
The chosen sampling procedure suggests that the sample size was representative of the number of schools in the mu-nicipality of Caruaru and of the students enrolled therein, which enables extrapolation of study results to the entire secondary student population of the municipality’s network of state-operated schools.
One limitation of the study is that its design did not allow population-wide identiication of age ranges, as the data provided by the State Department of Education were not stratiied by age. Therefore, our results should be viewed cautiously when in comparison to adolescent populations, as 12.3% of students in the sample were 20 years old, and the WHO deinition of adolescence is restricted to the ages of
table 1 - Socio-demographic, economic, and educational distribution of secondary students attending public schools in the
mu-nicipality of Caruaru, Pernambuco.
Variable male Female overall
% n % n % n
Age 15 16 17 18 19 20 6.2 19.0 27.4 18.1 14.6 14.6 14 43 62 41 33 33 11.5 22.5 22.7 20.3 11.0 12.0 42 83 84 75 40 44 9.5 21.2 24.5 19.5 12.3 12.3 56 126 146 116 73 77 Marital status Single Married Other 97.3 0.4 2.2 219 1 5 9.0 3.3 2.7 348 11 10 95.2 2.2 2.5 567 12 15
Monthly household income
≤ R$500.00
R$501.00 – R$1,000.00 R$1,001.00 – R$2,000.00
≥ R$2,001.00
37.3 30.0 20.5 12.3 85 69 46 27 38.2 36.5 19.5 5.8 140 133 72 22 37.8 34.0 19.9 8.3 225 202 118 49
Year of secondary school
10 to 19. However, as the sample was representative of the reality of secondary students in the municipality, we decided against exclusion of 20-year-old subjects from analysis. Fur-thermore, the comparison of indings of the present study is closer to adolescence than to adulthood.
The overall prevalence of body image dissatisfaction was high—61.3%, a rate similar to that found by Vilela et al (59%)(16) and Graup et al (67%)(22) in studies conducted
in Southern Brazil. High body image dissatisfaction rates (63.9%) have also been reported in a sample of preadolescents (aged 8–10 years) from upstate Rio Grande do Sul(12).
Although body dissatisfaction was detected in both genders, perceptions of body image had different effects on male and female subjects. Most girls wanted to lose weight, whereas boys were more likely to desire weight gain. These results are consistent with those reported in other studies,
table 2 - Association between body weight satisfaction and associated factors among secondary students attending public schools
in the municipality of Caruaru, Pernambuco.
Variable Satisied
Not satisied, would like
to gain weight Not satisied, would like to lose weight
% (n) p % (n) p % (n) p
Gender
Male Female
40.9 (92)
37.4 (138) 0.39
42.7 (96)
24.4 (90) <0.001
16.4 (37)
38.2 (141) <0.001
Age range
15 – 17 18 – 20
38.5 (126)
39.0 (104) 0.91
28.7 (95)
33.8 (91) 0.17
32.0 (106)
26.8 (72) 0.16
Marital status
Single Married/other
39.2 (221)
25.0 (7) 0.13
31.9 (180)
21.4 (6) 0.25
28.9 (163)
53.6 (15) <0.001
Family income
≤ R$500
≥ R$501
42.7 (106)
35.8 (124) 0.08
32.7 (82)
29.8 (104) 0.45
23.9 (60)
33.8 (118) <0.001
Classes
Day Night
39.1 (104)
38.4 (126) 0.86
21.9 (59)
38.4 (127) <0.001
38.3 (103)
22.7 (78) <0.001
Physical activity
Active
Insuficiently active
40.5 (139)
36.9 (90) 0.37
32.9 (114)
27.9 (69) 0.37
26.0 (90)
34.4 (88) 0.02
Fruit & vegetable intake
< 5 servings/day
≥ 5 servings/day
33.9 (133)
48.2 (96) 0.01
31.6 (124)
31.2 (62) 0.95
34.4 (135)
20.6 (41) <0.001
Perception of health status
Positive Negative
40.3 (184)
33.6 (46) 0.15
31.7 (146)
28.8 (40) 0.51
27.8 (127)
37.2 (51) 0.03
Perception of stress status
Positive Negative
41.6 (197)
27.3 (33) 0.11
31.5 (149)
30.6 (37) 0.75
26.7 (127)
41.1 (51) <0.001
Perception of sleep quality
Positive Negative
42.6 (194)
25.9 (36) <0.001
29.6 (136)
35.5 (50) 0.19
27.2 (125)
37.6 (53) 0.01
Three meals/day
Yes No
42.9 (176)
29.3 (54) 0.02
32.5 (134)
27.7 (52) 0.23
24.3 (100)
41.5 (78) <0.001
Nutritional status
Adequate weight Underweight Overweight Obese
44.1 (179) 32.3 (10) 29.0 (31) 9.1 (3)
<0.001
35.7 (147) 54.8 (17) 15.0 (16) 6.1 (2)
0.00
19.4 (80) 12.9 (4) 56.1 (60) 84.8 (28)
which show that, regardless of nutritional status, women generally seek a slimmer igure(23) whereas men want stronger bodies(16,22). According to Kostanski et al, the issue of body image dissatisfaction affects both genders, but not in the same manner; therefore, prevention and mitigation strate-gies should target each gender independently(24).
It bears noting that, in the present sample, girls were 2.93 times more likely than boys to want to lose weight. Other stud-ies have shown that body image dissatisfaction due to perceived overweight primarily affects women(3,16,22). Our culture, which disseminates the notion that leanness in women is synonymous with competence, success, and sexual attractiveness, is tied to
table 3 - Crude and adjusted regression (hierarchical model) between desire to gain weight and associated factors among
secon-dary students attending public schools in the municipality of Caruaru, Pernambuco.
Variable Not satisied, would like to gain weight
crude Pr (95%cI) p Adjusted Pr (95%cI) p
Level 1
Gender
Male Female
1.00
0.42 (0.30-61) 0.00
1.00
0.43 (0.28-0.71) <0.001
Age range
15-17 18-20
1.00
1.27 (0.90-1.74) 0.17
1.00
1.12 (0.71-1.73) 0.49
Marital status
Single Other
1.00
0.59 (0.23-1.48) 0.25
1.00
0.78 (0.27-2.19) 0.62
Family income
≤R$500
≥R$501
1.00
0.87 (0.61-1.24) 0.45
1.00
0.77 (0.51-1.18) 0.23
Classes
Day Night
1.00
2.21 (1.54-3.18) 0.00
1.00
1.54 (0.95-2.46) 0.07
Level 2
Physical activity
Active
Insuficiently active
1.00
0.78 (0.55-1.12) 0.37
1.00
0.89 (0.58-1.36) 0.51
Fruit & vegetable
intake
<5 servings/day
≥5 servings/day
1.00
1.01 (0.70-1.46) 0.95
1.00
1.08 (0.71-1.50) 0.86
Health status
Positive Negative
1.00
0.87 (0.57-1.32) 0.51
1.00
0.81 (0.44-1.34) 0.48
Stress status
Positive Negative
1.00
0.93 (0.60-1.43) 0.75
1.00
1.03 (0.66-1.89) 0.81
Sleep quality
Positive Negative
1.00
1.30 (0.87-1.94) 0.19
1.00
1.48 (0.93-2.38) 0.09
Level 3
Three meals/day
Yes No
1.00
0.79 (0.54-1.16) 0.23
1.00
1.10 (0.68-1.66) 0.83
Nutritional status Adequate weight Underweight Overweight Obese
1.00 1.62 (0.55-4.78) 0.18 (0.12-0.24) 0.04 (0.16-0.11)
0.87 0.00 0.00
1.00 3.81 (1.01-13.88)
0.13 (0.08-0.22) 0.03 (0.01-0.07)
table 4 - Crude and adjusted regression (hierarchical model) between desire to lose weight and associated factors among secon-dary students attending public schools in the municipality of Caruaru, Pernambuco.
Variable
Not satisied, would like to lose weight
crude Pr (95%cI) p Adjusted Pr
(95%cI) p
Level 1
Gender
Male Female
1.00
3.01 (2.02-4.65) 0.00
1.00
2.93 (1.65-5.19) <0.001
Age range
15 – 17 18 – 20
1.00
0.77 (0.54-1.10) 0.16
1.00
0.83 (0.49-1.40) 0.49
Marital status
Single Married/other
1.00
2.88 (1.34-5.18) 0.00
1.00
1.94 (0.66-5.64) 0.22
Family income
<R$500 >R$501
1.00
1.62 (1.12-2.34) 0.00
1.00
1.70 (1.18-2.66) <0.001
Classes
Day Night
1.00
0.47 (0.33-0.67) 0.00
1.00
0.68 (0.38-1.13) 0.07
Level 2
Physical activity
Active
Insuficiently active
1.00
1.42 (1.04-2.13) 0.02
1.00
1.47 (0.90-2.41) 0.12
Fruit & vegetable intake
<5 servings/day
≥5 servings/day
1.00
0.50 (0.37-0.74) 0.00
1.00
0.97 (0.79-1.21) 0.87
Health status
Positive Negative
1.00
1.52 (1.02-2.27) 0.03
1.00
1.23 (0.74-2.18) 0.49
Stress status
Positive Negative
1.00
1.92 (1.27 – 2.89) 0.00
1.00
1.51 (0.92 – 2.71) 0.18
Sleep quality
Positive Negative
1.00
1.60 (1.09-2.39) 0.01
1.00
1.33 (0.81-2.31) 0.27
Level 3
Three meals/day
Yes No
1.00
2.22 (1.53-3.19) 0.00
1.00
1.79 (1.32-2.94) <0.001
Nutritional status
Adequate weight Underweight Overweight Obese
1.00 0.45 (0.21-0.95) 3.15 (1.78-5.56) 8.09 (1.99-16.15)
0.03 0.00 0.03
1.00 0.29 (0.11-0.64) 3.51 (1.91-6.56) 8.92 (2.05-18.11)
increased rates of this particular proile of body dissatisfaction. On the other hand, young men are guided toward several social functions that require strength and athleticism, which makes them more susceptible to a desire for weight gain(25).
Brook and Tepper, in a study of the perceptive component of body image among 14-to-18-year-old adolescents, found that girls were at a fourfold risk of body dissatisfaction due to perceived overweight(26). According to Ferrando et al, body image distortion in women occurs both at the perceptive level (overestimation of body weight) and at the emotional level(27).
Association of body dissatisfaction with nutritional status showed that underweight subjects would like to gain weight, whereas overweight students would like to lose weight. It should be noted that 64.1% of subjects who reported body image dissatisfaction were actually within adequate weight ranges, while 29.9% were overweight. These indings cor-roborate the results of prior studies that have detected body image dissatisfaction in adolescents and young adults with normal weight: Bosi et al, in 2006(28), found that 82.9% of female college students with altered self-perception of body image had a normal BMI, and only 11.4% had a BMI consistent with overweight or obesity; Benedikt et al, in 1998, found that 60.7% of female adolescents in their study sample were unhappy with their body weight, although only 13.6% were actually overweight(29); and Nunes et al (2001), studying a sample of female subjects between the ages of 12 and 29, found that only one-third of those who believed themselves “fat” actually had BMIs consistent with overweight or obesity(7).
In the present sample, 13.5% of boys wanted to gain body mass despite being overweight (which probably relects a desire for greater muscle mass), whereas 18.8% of girls wanted to lose weight despite already being underweight (which shows a greater likelihood of abnormal dietary behavior and eating disorders). The current evidence base suggests that ascribing excessive importance to body weight, regardless of nutritional status (BMI), is one of the most signiicant predictors of ab-normal dietary behavior and inadequate weight management practices(30,31). Grigg et al, in a 1996 study of 14-to-16-year-old girls with body image dissatisfaction, found that 57% of subjects (n=853) engaged in unhealthy dietary behavior and 36% self-medicated with anorectics, diuretics, laxatives, and/ or extremely restrictive diets.(32) Alves et al (2008) found a close relationship between body dissatisfaction and abnormal dietary behaviors indicative of eating disorders(13).
The present study found an association between meal skipping and body image dissatisfaction; this association
persisted after adjusting for possible confounders. Students who had fewer than three meals a day were 1.79 times more likely to be dissatisied due to perceived overweight. This inding corroborates the results of Branco et al (2007), who found a signiicant relationship between body image distor-tion and skipping breakfast in a sample of adolescent females (p<0.05)(33). Branco et al suggested that adolescents who are unhappy with their body image tend to skip certain meals, such as breakfast, in an attempt to reduce daily calorie intake and lose weight(33).
On crude analysis, signiicant associations were found be-tween body image dissatisfaction due to perceived overweight and the following variables: physical inactivity; daily fruit and vegetable intake of fewer than ive servings; and negative per-ception of overall health status, stress status, and sleep quality. After adjusting for confounders, however, none of these associa-tions persisted. It was to be expected that subjects who wished to lose weight might adopt healthy lifestyle choices, such as physical exercise, balanced diets, adequate sleep patterns, and stress reduction. However, as noted above, adolescents and young adults often engage in inadequate weight management practices, such as skipping meals.
references
1. Tribess S. Percepção da imagem corporal e fatores relacionados à saúde em idosas [tese de mestrado]. Florianópolis (SC): UFSC; 2006.
2. Saikali CJ, Soubhia CS, Scalfaro BM, Cordás TA. Body image in eating disorders. Rev Psiq Clin 2004;31:164-6.
3. Conti MA, Frutuoso MF, Gambardella AM. Obesity and body dissatisfaction amongst adolescents. Rev Nutr 2005;18:491-7.
4. World Health Organization (WHO). El embarazo y el aborto en la adolescencia. Genebra: OMS; 1975.
5. Mukai T, Crago M, Shisslak CM. Eating attitudes and weight preoccupation among female high school students in Japan. J Child Psychol Psychiatry 1994;35:677-88.
6. Fleitlich BW. O papel da imagem corporal e os riscos de transtornos alimentares. Ped Moder 1997;32:56-62.
7. Nunes MA, Olinto MT, Barros FC, Camey S. Inluence of body mass index and body weight perception on eating disorders symptoms. Rev Bras Psiquiatr 2001;23:21-7.
8. Anderson LA, Eyler AA, Galuska DA, Brown DR, Brownson RC. Relationship of satisfaction with body size and trying to lose weight in a national survey of overweight and obese women aged 40 and older, United States. Prev Med 2002;35:390-6.
9. Provencher V, Bégin C, Gagnon-Girouard MP, Gagnon HC, Tremblay A, Boivin S et al. Defined weight expectations in overweight women:
anthropometrical, psychological and eating behavioral correlates. Int J Obes (Lond) 2007;31:1731-8.
10. Anglé S, Keskinen S, Lapinleimu H, Helenius H, Raittinen P, Rönnemaa T et al. Weight gain since infancy and prepubertal body dissatisfaction. Arch Pediatr Adolesc Med 2005;159:567-71.
11. Branco LM, Hilário MO, Cintra IP. Percepção e satisfação corporal em adolescentes e a relação com seu estado nutricional. Rev Psiq Clin 2006;33:292-6.
12. Triches RM, Giugliani ER. Body dissatisfaction in school children from two cities in the South of Brazil. Rev Nutr 2007;20:119-28.
13. Alves E, Vasconcelos FA, Calvo MC, Neves J. Prevalence of symptoms of anorexia nervosa and dissatisfaction with body image among female adolescents in Florianópolis, Santa Catarina State, Brazil. Cad Saude Publica 2008;24:503-12.
14. Robinson TN, Chang JY, Haydel KF, Killen JD. Overweight concerns and body dissatisfaction among third-grade children: the impacts of ethnicity and socioeconomic status. J Pediatr 2001;138:181-7.
15. Stice E, Hayward C, Cameron RP, Killen JD, Taylor CB. Body-image and eating disturbances predict onset of depression among female adolescents: a longitudinal study. J Abnorm Psychol 2000;109:438-44.
16. Vilela JE, Laumounier JA, Dellaretti-Filho MA, Barros-Neto JR, Horta GM. Eating disorders in school children. J Pediatr (Rio J) 2004;80:49-54. 17. Barros MV. Atividades físicas e padrão de consumo alimentar em estudantes
do ensino médio em Santa Catarina [tese de doutorado]. Porto Alegre (RS): UFRS; 2004.
18. Conde WL, Monteiro CA. Body mass index cutoff points for evaluation of nutritional status in Brazilian children and adolescents. J Pediatr (Rio J) 2006;82:266-72.
19. Lohman TG, Roche AF, Martorell R. Anthropometric standardization reference manual. Champaign: Human Kinetics Books; 1991.
20. Victora CG, Huttly SR, Fuchs SC, Olinto MT. The role of conceptual frameworks in epidemiological analysis hierarchical approach. Int J Epidemiol 1997;26:224-7.
21. Tassitano RM, Barros MV, Tenório MC, Bezerra J, Hallal PC. Prevalence of overweight and obesity and associated factors among public high school students in Pernambuco State, Brazil. Cad Saude Publica 2009;25: 2639-52.
22. Graup S, Pereira EF, Lopes AS, Araújo VC, Legnani RF, Borgatto AF. Associação entre a percepção da imagem corporal e indicadores antropométricos de escolares. Rev Bras Educ Fis Esp 2008;22:129-38.
23. Pinheiro AP, Giugliani ER. Quem são as crianças que se sentem gordas apesar de terem peso adequado? J Pediatr (Rio J) 2006;82:232-5.
24. Kostanski M, Fischer A, Gullone E. Current conceptualisation of body image dissatisfaction: have we got it wrong? J Child Psychol Psychiatry 2004;45: 1317-25.
25. Ricciardelli LA, McCabe MP, Banield S. Sociocultural inluences on body image and body change methods. J Adolesc Health 2000;26:3-4.
26. Brook U, Tepper I. High school students’ attitudes and knowledge of food consumption and body image: implications for school based education. Patient Educ Couns 1997;30:283-8.
27. Ferrando DB, Blanco MG, Masó JP, Gurnés CS, Avellí MF. Eating attitudes and body satisfaction in adolescents: a prevalence study. Actas Esp Psiquiatr 2002;30:207-12.
28. Bosi ML, Luiz RR, Morgado CM, Costa ML, Carvalho RJ. Self-perception of body image among nutrition students: a study in the city of Rio de Janeiro. J Bras Psiquiatr 2006;55:108-13.
29. Benedikt R, Werthein EH, Love A. Eating attitudes and weight-loss attempts in female adolescents and their mothers. J Adolesc Health 1998;27: 43-57.
30. Brownell KD. Dieting and the search for the perfect body: where physiology and culture collide. Beh Ther 1991;22:1-12.
31. Hsu LK. Epidemiology of the eating disorders. Psychiatr Clin North Am 1996;19:681-700.
32. Grigg M, Bowman J, Redman S. Disordered eating and unhealthy weight reduction practices among adolescent females. Prev Med 1996;25:748-56. 33. Branco LM, Almeida EC, Passos MA, Piano A, Cintra IP, Fisberg M. A
percepção corporal inluencia no consumo do café da manhã de adolescentes? Saude Rev 2007;9:15-21.
34. Pereira EF, Graup S, Lopes AS, Borgatto AF, Daronco LS. Percepção da imagem corporal de crianças e adolescentes com diferentes níveis socio-econômicos na cidade de Florianópolis, Santa Catarina, Brasil. Rev Bras Saude Matern Infant 2009;9:253-62.
35. Ogden J, Thomas D. The role of familial values in understanding the impact of social class on weight concern. Int J Eat Disord 1999;25:273-9.
36. Wang Z, Byrne NM, Kenardy JA, Hills AP. Influences of ethnicity and socioeconomic status on the body dissatisfaction and eating behaviour of Australian children and adolescents. Eat Behav 2005;6:23-33.
In short, the present study found high rates of body image dissatisfaction in both genders. Male subjects and those with underweight were most likely to wish to gain weight, whereas females, subjects who had fewer than three meals a day, those from higher-income backgrounds, and overweight or obese ones were more likely to want to lose weight. Perception of body weight was distorted in both genders; 13.5% of overweight
boys were nevertheless interested in gaining weight, whereas 18.8% of underweight girls still wanted to be thinner.