PHONOAUDIOLOGICAL CARE IN THE SUS:
EXPANDING ACCESS AND THE CHALLENGE
OF OVERCOMING INEQUALITIES
Assistência fonoaudiológica no SUS: a ampliação do acesso
e o desaio de superação das desigualdades
Gabriella Morais Duarte Miranda(1), Antonio da Cruz Gouveia Mendes(1),Ana Lúcia Andrade da Silva(1), Mirella Rodrigues(2)
(1) Centro de Pesquisas Aggeu Magalhães – CpqAM/Fiocruz--PE, Recife, Pernambuco, Brasil.
(2) Departamento de Fonoaudiologia, Universidade Federal de Pernambuco – UFPE, Recife, Pernambuco, Brasil.
Conlict of interest: non-existent
In this context, the speech-language therapy
assistance in general health conditions must
be guaranteed in all of its ields: hearing, voice, language, orofacial movements and dysphagia2.
The human communication, object of study of the speech-language therapy, seen as a way of social
integration of the individual, deserves important
attention from public health action, since it allows
the individual to put itself as a transforming agent of
its social context2-4.
Consequently, speech-language therapists have increased their presence in SUS, occupying spaces from the primary level of health care to expertise
ambulatories, hospitals, educational unities,
residences and other resources of the community,
INTRODUCTION
The implementation of the Uniied Health System (SUS), in 1988, includes all citizens in its ield of
attendance to health services and attributes to the
State the duty of accomplishing what has become the right of every Brazilian citizen. The SUS places
into the main topics of health services the principles
of universality, integrity and equity1.
ABSTRACT
Purpose: to evaluate the evolution of the Speech, Language and Hearing Sciences inUniied
Health System (SUS),in the years2000, 2005and 2010. Methods: this was a descriptive study, the
units of analysis were the geographical regions of Brazil and universe of municipalities aggregated in population size. We analyzed theyears 2000, 2005 and 2010, and usedsecondary datato collectinformation onthe amountand the amount paidbyspeech therapists procedures performed,
and the number ofprofessionals in theSUS. Results: there was a large increase in procedures of
speech-language therapy in the country, with the largest growthin the North.Among municipalities,
the largest increaseoccurred among thosesmallerpopulation. In 2010, 89.8% of municipalities didn’t
perform any type of procedure care speech-language therapy. Between 2000 and 2010 the coeficient procedures/1000 habrose from19.8 to 60.7. The evolution of speech-language therapy spending in SUS showed that the proportional growth of these procedures was greater than the increase in total outpatient spending. And among the groups, calls for the orthotics and prosthetics showed the highest growth. In the years analyzed, the country showed an increasein the number ofspeech therapists, despite beingshown adeicit ofprofessionalsin 2010. Conclusion: the evolution of speech-language
therapy assistance in SUS showed signiicant growth between 2000and 2010. However, have abad distributionof health careandspeech therapists in the country, highlighting the continued need fordiscussions ofuniversal accessand the quest forequity incarespeech.
KEYWORDS: Speech, Language and Hearing Sciences; Health Services Accessibility; Uniied Health
In the SUS, the national information systems are divided according to its uses. The systems
responsible for the production of services are
called Assistance Systems and are represented by the Systems of Hospital Informations (SIH) and the Systems of Ambulatory Information (SIA). The other group is formed by systems that congregate
epidemiological data, thus called Epidemiological
Systems. These are: Systems of Information on Mortality (SIM), Systems of Information on Live Births (Sinasc) and the System of Notiication
Aggravations (Sinan)14-18.
The demographical data were taken from the IBGE for the three years analyzed: 2000, 2005 and
2010.
For the analysis of the evolution on the offer of ambulatory service, all procedures registered by
speech-language therapists and all values paid
in the SIA of the Ministry of Health were taken in consideration. After that, the procedures were grouped according to the typology provided by the Federal Council of Speech-Language Therapy19,
consisting of three groups:
1. Therapeutical practice: Appointment/
Evaluation, House/Institutional Assistance,
Promotion/Protection, Rehabilitation, Others;
2. Audiology;
3. Ortheses and Prostheses: Hearing Health Services of Medium and High Complexity.
The evaluation of the professionals related to
the SUS on year 2000 was made from the number registered in the Sanitary Assistance Research of the year 1999; on years 2005 and 2010, it was obtained through the arithmetic mean of monthly registrations, made available by the CNES.
To analyze the suficiency of speech-language
therapists in the SUS, the parameters of need
established by Lessa and Miranda20 were applied, which deine: 1 speech therapist for every 10.000 citizens on primary attention; 1 for every 50.000 on secondary level; and 1 for every 100.000 on the
third level.
All iles were processed by software TABWIN, created by the Department of Informatics of the Ministry of Health. Files of deinition and conversion were created to elaborate the tables.
For the analysis of data beyond the absolute
and relative frequencies, the proportional variation
of each variable was observed, calculated by the relation of values obtained on the last and irst years
of the studied period.
The research responds to the ethical precepts;
the databanks are of public domain; there was no identiication of any subject, neither the exposure to damage or risks.
reorganizing the concepts and practices with the intent of offering a quality service, in accordance to
the precepts of public health5.
However, studies show that the offer of speech-language therapy care is still low on SUS when
compared to its demand2,6-8, particularly because
of communication conditions due to the current
epidemiological proile of the population, such as diseases in the circulatory system, external causes
and neoplasia.
Therefore, this article described the evolution
of SUS speech-language therapy assistance, according to the execution of procedures, the groups (therapy, audiology and prostheses), the cities divided by population and the relation need of
speech therapists per inhabitant, in Brazil and in the
Macrorregions, on years 2000, 2005 and 2010.
METHODS
This arcticle is a descriptive study; its analysis units were the Macrorregions of Brazil and the universe of municipalities divided by population, a research strategy used by researchers in different ields of study9-11. In this way, the cities were divided in:
1. Size I: less than 50.000 inhabitants;
2. Size II: between 50.000 and 90.000 inhabitants; 3. Size III: between 100.000 and 199.000
inhabitants;
4. Size IV: between 200.000 and 499.000
inhabitants;
5. Size V: between 500.000 and 999.000
inhabitants;
6. Size VI: between 1 million and 4,99 million
inhabitants;
7. Size VII: with 5 million or more.
Secondary data was also used, of public domain, provided by the National Register of Health Establishments (CNES), the Ambulatory Information System (SIA), the Ministry of Health and the Brazilian Institute of Geography and Statistics (IBGE). The period of reference were the years of 2000, 2005 and 2010. The years were chosen for being the last of each ive-year period, and also for contemplating a period in which the information systems were consolidated.
The Information Systems of Health (SIS)
became one of the main computing resources
capable of sending, in a fast, easy and safe way, information related to the SUS. They are important
tools for evaluating the health services, because of
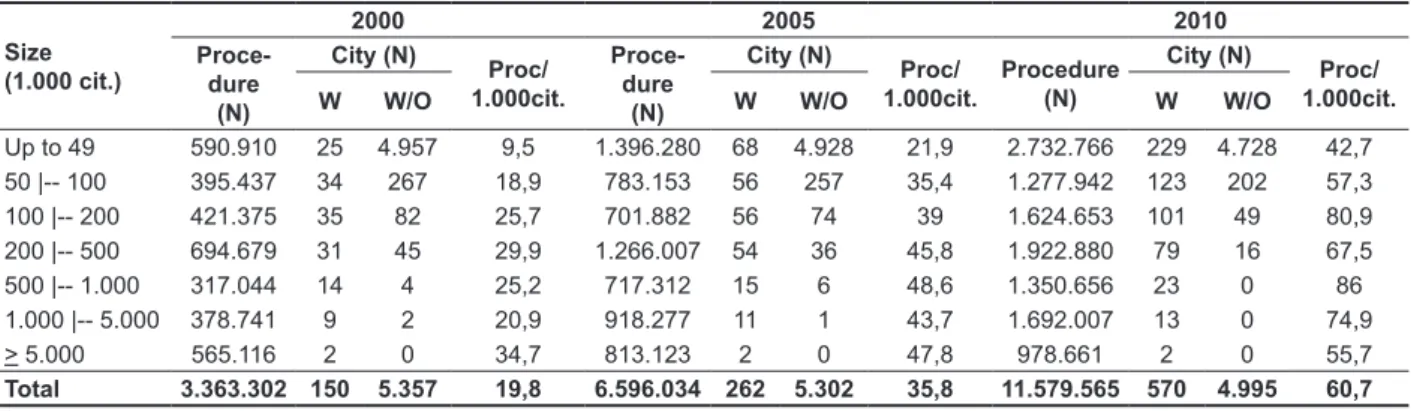
The analysis of the evolution on number of speech-language therapy procedures in Brazilian cities showed that there was a growth of 280% between 2000 and 2010, increasing from 150 to 570 cities that registered any kind of speech-language therapy procedure. A large part of this growth occurred in smaller cities. There was an increase
of 816% in cities of Size I (up to 50.000 citizens); 261,8% in Size II (from 50 to 100 thousand); and 188,6% in Size III (from 100 to 200 thousand).
In 2010, 89,8% of the Brazilian cities didn’t
register any kind of speech therapy procedure by
the SUS.
When it comes to the amount of procedures
made, there was an increase in every Size, with the highest one in Size I (362,5%), followed by Size VI (1 to 5 million citizens), of 346,7%. The lowest growth happened in cities of Size VII (73,6%).
RESULTS
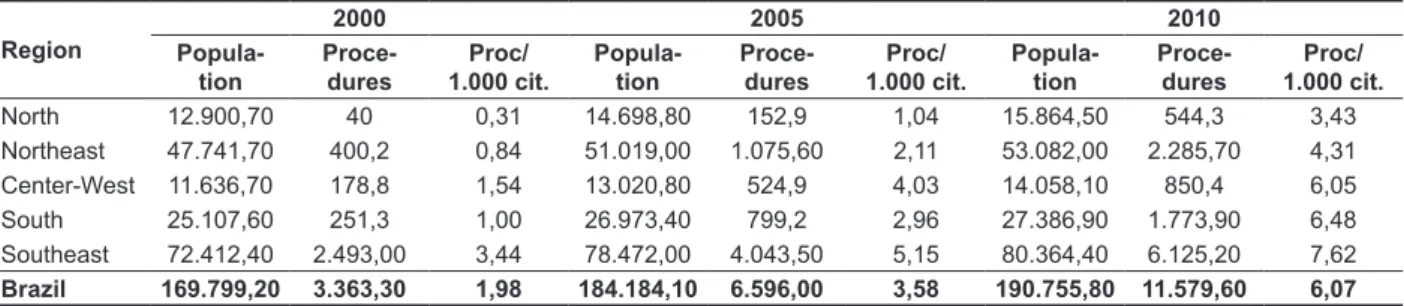
In Table 1, it is possible to see a growth of 206,5% in speech-language therapy procedures in Brazil, a large growth when compared to the 12,3% increase of population between 1995 and 2010. This evolution occurred in every region of the country but was more visible on the North Region, which had a number a
lot inferior than the other regions but still remained
with the lowest percentage as of 2010 (3,43%). In
all the studied period the Southeast presented the highest numbers of procedures, summing 74,1%, 61,3% and 52,9% of the total amount of 2000, 2005
and 2010, respectively. It is important to stress that
as of 2010, the population of the Region represents 42% of the national population.
Table 1 – Population, procedures in Speech Therapy and its relation per citizens, divide by the country’s regions. Brazil, 2000, 2005 and 2010.
Region
2000 2005 2010
Popula tion
Proce dures
Proc/ 1.000 cit.
Popula tion
Proce dures
Proc/ 1.000 cit.
Popula tion
Proce dures
Proc/ 1.000 cit.
North 12.900,70 40 0,31 14.698,80 152,9 1,04 15.864,50 544,3 3,43
Northeast 47.741,70 400,2 0,84 51.019,00 1.075,60 2,11 53.082,00 2.285,70 4,31 Center-West 11.636,70 178,8 1,54 13.020,80 524,9 4,03 14.058,10 850,4 6,05 South 25.107,60 251,3 1,00 26.973,40 799,2 2,96 27.386,90 1.773,90 6,48 Southeast 72.412,40 2.493,00 3,44 78.472,00 4.043,50 5,15 80.364,40 6.125,20 7,62 Brazil 169.799,20 3.363,30 1,98 184.184,10 6.596,00 3,58 190.755,80 11.579,60 6,07
Source: Brazilian Institute of Geography and Statistics (IBGE) and System of Ambulatory Information of the Ministry of Health. Data
accessed in July 2013.
Note: The population and procedures are divided by 1.000.
There was an increase of 206,4% on the amount of procedures per citizen, which means there was 19,8 procedures per citizen in 2000, and 60,7 in 2010. In this last year the Size V (500.000
to 1 million citizens) cities presented the highest
relation (86/1.000 citizens), whereas cities of Size I presented the lowest (42,7/1.000) (Table 2).
On Table 3, the analysis of the evolution of expenses with speech-language therapy on SUS demonstrated that the proportional growth of these procedures (929,4%) was higher than the increase of total ambulatory expenses (159,7%). The growth
was observed in all the ive Regions of Brazil,
being higher in the Southeast (7,24 million) and
Northeast (1,17 million) in 2000, in the Southeast
(52,7 million) and South (34,5 million) in 2005 and
again in the Southeast (128,9 million) and Northeast (51,2 million) in 2010. The North Region presented the lowest percentages throughout the whole studied period. The percentage of expenses in the
Southeast Region represented about 50% of the
whole expenses with speech-language therapy on
Table 2 – Procedures in speechlanguage therapy by cities, with and without registers, and the relation according to size. Brazil, 2000, 2005 and 2010
Size (1.000 cit.)
2000 2005 2010
Proce dure
(N)
City (N)
Proc/ 1.000cit.
Proce dure
(N)
City (N)
Proc/ 1.000cit.
Procedure (N)
City (N)
Proc/ 1.000cit.
W W/O W W/O W W/O
Up to 49 590.910 25 4.957 9,5 1.396.280 68 4.928 21,9 2.732.766 229 4.728 42,7 50 |-- 100 395.437 34 267 18,9 783.153 56 257 35,4 1.277.942 123 202 57,3 100 |-- 200 421.375 35 82 25,7 701.882 56 74 39 1.624.653 101 49 80,9 200 |-- 500 694.679 31 45 29,9 1.266.007 54 36 45,8 1.922.880 79 16 67,5 500 |-- 1.000 317.044 14 4 25,2 717.312 15 6 48,6 1.350.656 23 0 86 1.000 |-- 5.000 378.741 9 2 20,9 918.277 11 1 43,7 1.692.007 13 0 74,9
> 5.000 565.116 2 0 34,7 813.123 2 0 47,8 978.661 2 0 55,7
Total 3.363.302 150 5.357 19,8 6.596.034 262 5.302 35,8 11.579.565 570 4.995 60,7
Source: IBGE and Ministry of Health’s SIA. Data accessed on July 2013.
Note: Cities with and without register of ambulatory production in speech-language therapy.
Table 3 – Values paid for the total speech therapy and ambulatory procedures divided by regions. Brazil, 2000, 2005 and 2010
Region
2000 2005 2010
Paid values %
Speech
Paid values %
Speech
Paid values %
Speech
Total Speech Total Speech Total Speech
North 261,52 0,11 0,04 457,94 2,02 0,44 846,84 9,85 1,16 Northeast 1.338,63 1,17 0,09 1.913,54 18,08 0,94 3.396,29 51,24 1,51
Center-West 370,47 0,46 0,12 588,52 7,27 1,23 1.039,86 21,2 2,04
South 828,8 0,67 0,08 1.293,85 34,57 2,67 2.201,78 47,5 2,16
Southeast 2.898,82 7,24 0,25 4.660,84 52,75 1,13 7.312,44 128,99 1,76
Brazil 5.698,25 9,65 0,17 8.914,70 114,68 1,29 14.797,21 258,78 1,75
Source: MH’s SIA. Data accessed in July 2013. Note: The paid values are divided by 1.000.000.
The evolution on groups of speech-language
therapy procedures shows a large growth between 2000 and 2010. The North Region presented the largest growth in therapeutical practice, audiology and ortheses and prostheses; however, the
Southeast concentrated about 50% of each group’s procedures throughout the period. Among the groups, ortheses and prostheses presented the highest increase (3.378%).
Procedures related to therapeutical practice presented the highest percentage throughout the
whole period, representing 86,5% in 2000, 78,2%
in 2005 and 70% in 2010 of the total procedures
performed. A likewise movement was observed
with audiology procedures, which increased proportionally in every Region of the country
(Table 4).
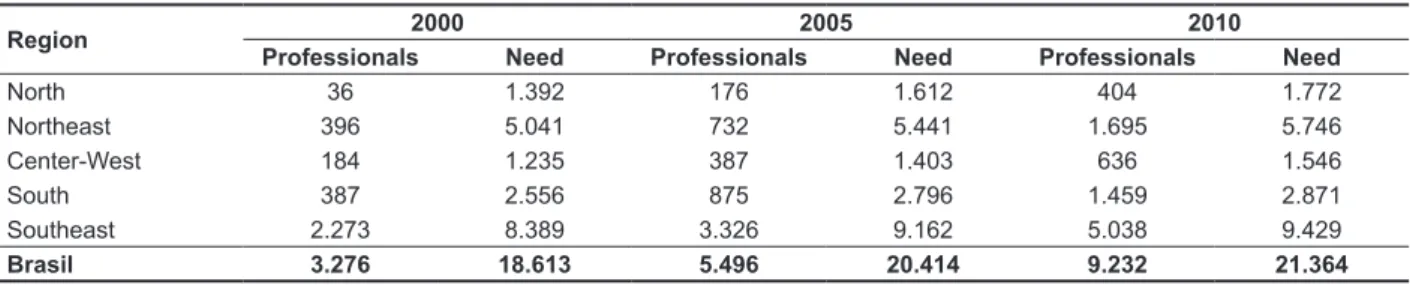
In the studied years, Brazil presented an increase
of 181,8% in the number of speech-language
thera-pists (Table 5), with the Southeast Region being the one with the highest percentage. The North Region had it number multiplied by 100 when comparing
the amount of professionals in 2000 and in 2010. Considering the number of speech-language thera-pists registered on SUS, the Southeast concen-trates more than 50% of the professionals. The
other regions also presented growth in the number
Table 4 – Speechlanguage procedures by groups, divided according the country’s regions. Brazil, 2000, 2005 and 2010
Region Therapeutical Practice Audiology Ortheses and Prostheses
2000 2005 2010 2000 2005 2010 2000 2005 2010
North 38.288 129.901 416.864 1.705 18.785 102.481 52 4.228 24.947
Northeast 352.187 795.379 1.786.159 47.413 241.089 425.136 632 39.088 74.431 Center-West 152.642 414.231 647.996 24.907 99.968 159.741 1.219 10.673 42.704 South 213.836 572.324 1.338.111 36.744 158.453 342.345 697 68.423 93.403 Southeast 2.155.035 3.246.714 4.846.374 327.238 682.126 1.051.546 10.707 114.652 227.327 Brazil 2.911.988 5.158.549 9.035.504 438.007 1.200.421 2.081.249 13.307 237.064 462.812
Source: MH’s SIA. Data accessed in July 2013.
Tabela 5 – Number of speechlanguage therapists and the need for professional divided by the country’s regions. Brazil, 2000, 2005 and 2010
Region 2000 2005 2010
Professionals Need Professionals Need Professionals Need
North 36 1.392 176 1.612 404 1.772
Northeast 396 5.041 732 5.441 1.695 5.746
Center-West 184 1.235 387 1.403 636 1.546
South 387 2.556 875 2.796 1.459 2.871
Southeast 2.273 8.389 3.326 9.162 5.038 9.429
Brasil 3.276 18.613 5.496 20.414 9.232 21.364
Source: Ministry of Health’s CNES. Data accessed in July 2013.
When the need for professionals is evaluated,
following the parameters deined by Lessa and
Miranda17, there is a discrepancy in the number of speech-language therapists working by the SUS when compared with the need for these specialists, highlighting a deiciency of 82,4% in 2000 and
56,8% in 2010.
Among the regions, the North and Northeast regions presented a lower level than the national average in every year. In the last year, the South and Southeast regions presented lower deicits, attending to 51% and 53% of its needs, respectively.
DISCUSSION
The insertion of speech-language therapy in
public policies of the federal government started
between 1970 and 1980, initially in the educational ield, and lately expanding to health care and social
assistance21. In health care, during this period, the few professionals in the ield focused their actions in ambulatories of mental health and hospitals, keeping
an individualistic and rehabilitating performance22.
With the implementation of SUS (based on the
principles of universality, equity and with the intent of decentralization), the expansion of the services and the users’ rights, there was a need of reorienting the
speech-language therapy practice, amplifying its action to beyond the rehabilitation.
In the presented results, it is observed a signif-icant increase on the number of speech-language
therapy procedures performed through SUS during
the studied period. Such evolution happened not
only due to the expansion of the ield of action of the speech-language therapist, with actions turned to promotion, protection and recovery of the human
communication health, but also because of public
policies or health programs, such as the National Policy for Attention to the Hearing, the program
Health in School, the multiplications of the Centers
for Support of Family Health (Nasf) and the program
Live Without Limits, which favored a major insertion
of the speech-language therapy assistance in the
SUS.
The North, South and Northeast regions presented largest growths during the period. However, the North Region stands out, for virtually having no offer of speech therapy services in 2000, when there was only a register of 0,3 proce -dures/1.000 citizens, and for, in 2010, reaching
only 5% of the number of speech-language therapy procedures registered in the country, even though
the region had 8,3% of the national population.
periods there was a decentralization. The regions that came closer to the coeficient of procedures per citizens were the South, Center-West and
Southeast, in all three groups.
Between 2000 and 2010 the increase of audiology corresponded to the growth of therapeutical practices, demonstrating some balance between the offer of consultations and exams in SUS. On the other hand, the exponential growth of procedures related to ortheses and prostheses allow us to afirm that there was an increase on the access to hearing rehabilitation, especially due to the National Policy of Hearing Health, created in 2004.
Government programs that aim to make available
full and universal access to health help the
rehabili-tation professional, allowing him to reorientate his
practices according to the precepts of the SUS7. The number of professionals raised in every regions, with the biggest increase being on the North Region, which presented an utterly small amount in 2000 and which is still the region with the smallest number as of 2010. Like it was observed in
the amount of procedures, the Southeast concen-trated more than the half of professionals registered
in SUS in all of the studied years.
Similar results were identiied in the state of Minas Gerais, where there is a grade disparity in the distribution of speech-language therapists, with
greater concentration in more developed cities8.
It is also important to stress that, during the studied period, Brazil had an increase in the number of
positions in Speech-Language Therapy courses, as well in Continued Professional Development (CDP) courses, such as the Multiprofessionals Health Residencies and the Masters degrees, allowing a better professional qualiication and insertion in the public system through public examinations. Besides since 2008, a new and ampliied locus of action to
the speech-langauge therapists was made legal by
the Governmental Regulation GM/MS 154/200829, marking the effective insertion of this professional in the primary level of health attention in Brazil.
However, apart from this growth, it is notable
that the number of professionals is still inferior to the needs of the population, in all the regions. According to the parameter of need, the Southeast
and the South regions present the lower deicits of
speech-language therapists in the period. With that,
it is possible to say that the distribution and insertion
of these professionals in SUS is not enough to
guarantee specialized care to everyone.
A strangling in the speech-language therapy care through SUS was also stated in Minas Gerais, where the relation speech-language therapist per citizen was of 1 to every 17.700 citizens in 20098. an ongoing signiicant difference between the richest
and poorest regions of the country. The Southeast,
the richest region, still concentrated, in 2010, more than 50% of the registered procedures, although its population represents little more than 40% of the
country’s.
The reformation undertaken in the Brazilian health system during the late 1980s brought as main questions not only the guarantee of right to health, but, in essence, the notion of equity concerning a
broader distribution of health resources23. Such a demand has not yet been reached in the distribution of speech-language therapy services through SUS.
In 2000, only 150 Brazilian cities registered speech-language therapy procedures, increasing to
almost 600 in 2010. Regardless the increase, the number is little more than 10% of the total number of
cities. The growth was registered mostly in smaller cities; the increase in bigger cities was represented by the ones in Rio de Janeiro and São Paulo, both states of the Southeast region, which had already registered high amounts of procedures in the irst year.
It is also important to highlight that the relation
of procedures per habitant grows according to the population of the city, in practically all the studied period, even though during the last year the relation was bigger in medium-sized cities.
Other studies have already demonstrated that, in Brazil, the better qualiied and most of the offer of health services are centered in locations with better
socioeconomical conditions, such as capital cities and metropolitan regions24-26.
Analyzing the offer of health services and how they are distributed is a way of measuring the effort a society develops to overcome its inequities27. The
different demographical, epidemiological,
socioeco-nomical, medical care, administrative and inancial conditions generate different kinds of problems, dificulties and priorites, in its local and regional
space of action and produce strong inequities in the
capacity of the SUS of responding to local needs28. The evolution of expenses with speech-language therapy procedures between 2000 and 2010 demonstrate a higher increase when compared to the ambulatory procedures in SUS during the same period. This growth was not only in quantity; there was a real raise in the value paid for speech-language therapy procedures. This shows the insertion and importance of this ield in the public health system.
The analysis of the different groups of speech-language therapy procedures demonstrated that during the irst evaluated year the Southeast Region
centered more than 74% of the procedures
FINAL CONSIDERATIONS
The evolution of speech-language therapy care through SUS presented a signiicant growth during 2000 and 2010. Such increase was not only seen
on the number of registered procedures or
profes-sionals related to the system, but also in the raise
on the value of such services and on the offer of
speech-language therapy care in all levels of
attention.
However, despite these advances, it is still
persistent a bad distribution of professionals and their services throughout the regions and cities of the countries. This situation can be even graver if
we consider the aging of the population and the increase of external causes, factors that determine the demand for speech-language therapy care.
All in all, it is essential, through scientiic production, the discussion of the equity univer -salization of access to the Brazilian public health
system, in a way that the access to speech-language therapy care is recognized as a right of
the population.
The need for professional aid for people with communication disorders takes under consideration
factors such as epidemiological and health care indicators20. The insertion of speech-language thera-pists in many ields of the SUS shows that the health
care are important for the overall health8, since
disorders in human communication can compromise
the child development, restrict professional growth and jeopardize the population welfare30.
This study used information from secondary databanks, both oficial and relevant in the country, which don’t replace other contributions based on
population inquiries or other methods based on
primary data.
Nevertheless, the use of secondary data for the
development of researches have been recognized
as an effective strategy of research, consisting of a
potential source of information because it optimizes the time and favors better information, produced
by the System of Information. Studies show that, in Brazil, the systems with more qualiied data are the ones used for scientiic production31.
RESUMO
Objetivo: avaliar a evolução da assistência fonoaudiológica no SUS, nos anos 2000, 2005 e 2010.
Métodos: trata-se de um estudo descritivo, cujas unidades de análise foram as regiões do Brasil e o universo dos municípios agregados em porte populacional. Foram analisados os anos de 2000, 2005 e 2010, e utilizados dados secundários para coletar informações sobre a quantidade e o valor
pago por procedimentos realizados por fonoaudiólogos, além do número de proissionais no SUS.
Resultados: houve grande crescimento dos procedimentos de fonoaudiologia no país, com maior
crescimento na região Norte. Entre os municípios, o maior crescimento ocorreu entre aqueles de
menor porte populacional. Em 2010, 89,8% dos municípios brasileiros não realizaram nenhum tipo
de procedimento em assistência fonoaudiológica no SUS. Entre 2000 e 2010, o coeiciente proce -dimentos/mil habitantes passou de 19,8 para 60,7. A evolução dos gastos com fonoaudiologia no SUS demonstrou que o crescimento proporcional destes procedimentos foi maior que o aumento dos gastos totais ambulatoriais. E entre os grupos, os atendimentos para órteses e próteses
apre-sentaram o maior crescimento. Nos anos analisados, o país apresentou um aumento no número de fonoaudiólogos, apesar de ser evidenciado um déicit de proissionais em 2010. Conclusão:a
evolução da assistência fonoaudiológica no SUS apresentou um crescimento signiicante, entre 2000
e 2010. Entretanto, ainda persiste uma má distribuição da assistência e de fonoaudiólogos no país, evidenciando a necessidade contínua de discussõessobre a universalização do acesso e a busca pela equidade na assistência fonoaudiológica.
de Janeiro, Brasil, 1999 a 2001. Cad saúde pública. 2008;24(6):1344-54.
14. Branco MAF. Sistemas de Informação em Saúde no nível local. Cad saúde pública. 1996;12(2):267-70.
15. Carvalho DM. Grandes Sistemas Nacionais
de Informação em Saúde: Revisão e Discussão da Situação Atual. Inf Epidemiol SUS. 1997;5(4):7-46. 16. Lessa FJD. Avaliação do Sistema de
Informações Hospitalares na notiicação do óbito,
Recife – 1997 [dissertação]. Recife(PE): Centro de Pesquisas Aggeu Magalhães; 2000.
17. Mendes ACG, Silva Junior JB, Medeiros KJ, Lyra
TM, Melo Filho DA, Sá DA. Avaliação do Sistema
de Informações Hospitalares- SIH/SUS como fonte
complementar na vigilância e monitoramento de
Doenças de Notiicação Compulsória. Inf Epidemiol
SUS. 2000;9(2):67-86.
18. Scatena JHG, Tanaka OY. Utilização do sistema de informações hospitalares (SIH/SUS) na análise
da descentralização da saúde em Mato Grosso. Inf. epidemiol. SUS. 2001;10(1):19-30.
19. Conselho Federal de Fonoaudiologia. Fonoaudiólogos podem registrar novos procedimentos. Jornal do CFFa. 2009; Ano X(40):9-11.
20. Lessa FJD, Miranda GMD. Fonoaudiologia e Saúde Pública. In: Britto ATB de (Org.). Livro de Fonoaudiologia. São Jose dos Campos: Pulso Editorial, 2005.
21. Garbin W. O sistema de saúde no Brasil. In: Vieira RM, organizador. Fonoaudiologia e saúde pública. Carapicuíba: Pró-Fono; 1995.p.24-34.
22. Bei LDM. A inserção da fonoaudiologia na atenção primária à saúde. In: Bei LDM. (Org).
Fonoaudiologia na atenção primária à saúde. São Paulo: Lovise, 1997. p.15-35. (Série Atualidades em Fonoaudiologia).
23. Viana ALD’A, Fausto MCR, Lima LD. Política de saúde e equidade. São Paulo perspect. 2003;17:58-68.
24. Campos TP, Carvalho MS. Assistência ao
parto no Município do Rio de Janeiro: peril das
maternidades e o acesso da clientela. Cad saúde pública. 2000;16(2):411-20.
25. Goldman RE, Barros SM. O. O acesso às maternidades públicas no estado de São Paulo: procedimentos no pronto-atendimento obstétrico e opinião das mulheres sobre esta assistência. Acta paul enferm. 2003;16(4):9-17.
26. Oliveira EXG, Carvalho MS, Travassos C. Territórios do Sistema Único de Saúde: mapeamento das redes de atenção hospitalar. Cad saúde pública. 2004;20(2):386-402.
27. Coelho IB. Democracia sem equidade: um balanço da reforma sanitária e dos dezenove anos
REFERENCES
1. Brasil. Ministério da Saúde. Secretaria de Assistência à Saúde. O Sistema Público de Saúde Brasileiro. Brasília, 2002.
2. Souza RPF, Andrade da Cunha D, Silva HJ.
Fonoaudiologia: a inserção da área de linguagem no sistema único de saúde (SUS). Rev CEFAC. 2005;7(4):426-32.
3. Gonçalves CGO, Lacerda CBF, Perotino S, Mugnaine AMM. Demanda pelos serviços de fonoaudiologia no município de Piracicaba: estudo comparativo entre a clínica-escola e o atendimento na Prefeitura Municipal. J. Soc. Bras. Fonoaudiol.2000;12(2):61-6.
4. Diniz RD,Bordin R. Demanda em Fonoaudiologia em um serviço público municipal da região Sul do Brasil. Revsocbrasfonoaudiol. 2011;16(2):126-31.
5. Moreira MD, Mota HB. Os caminhos da
Fonoaudiologia no Sistema Único de Saúde – SUS. Rev CEFAC. 2009;11(3):516-21.
6. Bazzo LMF. Privação da oferta de serviços fonoaudiológicos no Sistema Único de Saúde (SUS) e a reforma do Estado: a mediação do debate. R Ciméd biol. 2007;6(2):190-6.
7. Ferreia CL, Silva FR, Martins-Reis VO, Friche
AAL, Santos JN. Distribuição dos fonoaudiólogos na
atenção à saúde no Estado de Minas Gerais entre 2005 e 2010. Rev CEFAC. 2013;15(3):672-80.
8. Santos JN, Maciel FJ, Martins VO, Rodrigues ALV,
Gonzaga AF, Silva LF. Inserção dos fonoaudiólogos no SUS/MG e sua distribuição no território do Estado de Minas Gerais. Rev CEFAC. 2012;14(2):196-205.
9. Frias PG, Pereira PMH, Andrade CLT, Lira PIC, Szwarcwald CL. Avaliação da adequação das
informações de mortalidade e nascidos vivos no Estado de Pernambuco, Brasil. Cad Saúde Pública 2010;26: 671-81
10. Rodrigues M, Bonim C,Frias PG, Gurgel
IGD, Medeiros Z. Diferenciais na adequação das informações de eventos vitais nos municípios de Pernambuco,2006-2008.RevBrasEpidemiol2012; 15(2): 275-84
11. Silva ALA, Mendes ACG, Lyra TM, Lima
CMGB, Miranda GMD. A evolução da assistência
cardiológica cirúrgica de alta complexidade no SUS,
no período de 1995 a 2010. Anais do 2º Congresso Brasileiro de Política, Planejamento e Gestão em
Saúde. Belo Horizonte: Abrasco, 2013.
12. Benito GAV, Licheski AP. Sistemas de Informação
apoiando a gestão do trabalho em saúde. Rev bras enferm. 2009;62(3):447-50.
13. Bittencourt AS, Camacho LAB, Leal MC. A qualidade da informação sobre o parto no Sistema
de implantação do Sistema Único de Saúde no Brasil. Ciênc. saúde coletiva. 2010;15(1):171-83. 28. Lucchese PTR. Equidade na gestão
descentralizada do SUS: desaios para a redução
de desigualdades em saúde. Ciênc saúde coletiva. 2003;8(2):439-48.
29. Brasil. Ministério da Saúde. Portaria nº 154 de
24 de janeiro de 2008. Cria os Núcleos de Apoio à Saúde da Família (NASF). Brasília: Ministério da
Saúde, 2008.
Received on: August 20, 2013 Accepted on: April 08, 2014
Mailing address:
Gabriella Morais Duarte Miranda
Rua Dom Pedro Henrique, 40 Apt. 502 – Boa Vista
Recife – PE – Brasil CEP: 50050-150
E-mail: [email protected]
30. Olusanya BO, Newton VE. Global burden
of childhood hearing impairment and disease control priorities for developing countries. Lancet. 2007;369:1314-7.
31. Mello Jorge MHP, Laurenti R, Gotlieb SLD.
Análise da qualidade das estatísticas vitais
brasileiras: a experiência de implantação do SIM e do SINASC. Ciência & Saúde Coletiva.