Methodological Analysis of SEFI EER papers
L. Malmi1 Aalto U., Finland [email protected]
T. Adawi
Chalmers U. of Technology, Sweden [email protected]
R. Curmi
Malta College of Arts, Science and Technology, Malta [email protected]
E. De Graaff
Aalborg U., Denmark [email protected]
G. Duffy
Dublin Institute of Tech., Ireland [email protected]
C. Kautz,
Hamburg U. of Tech. (TUHH), Germany
P. Kinnunen
Aalto U., Finland [email protected]
B. Williams
ESTBarreiro, Instituto Politécnico de Setúbal and CEG-IST/UTL, Portugal [email protected]
Conference Topic: Engineering Education Research, Integration of research in engineering education,New learning concepts for engineering education
Keywords: Engineering Education Research; Taxonomy; Research methods; Theory
INTRODUCTION
Engineering education research (EER) is a relatively new field of study, which is building its own profile, compared with related fields like natural sciences, engineering sciences and social sciences. EER seeks to identify theoretical underpinnings for innovations in engineering education and to build empirical
evidence and better understanding of their impact on students’ studying process and
learning results. EER also studies the complex interactions between the central actors in the instructional process, including students, teachers, teaching organizations and subject content. To address these challenges a considerable variety of research methodologies is being applied.
In this paper, we present and discuss the results of a pilot study where we analysed the research process reported in the EER track papers from the SEFI conferences in 2010 and 2011 (in total 62 papers). Our analysis is based on the methodological taxonomy of EER papers published in the proceedings of the SEFI conference in 2012 [1], which was developed as one activity of the EUGENE project (http://www.eugene.unifi.it/). The taxonomy includes several dimensions, which cover the theoretical or conceptual frameworks of the research, general research design, data sources and analysis methods, how these aspects of research have been reported in the paper, and finally the general nature of the paper.
We contrast our results with some published analyses of EER papers and with similar analyses in computing education research. Finally, we conclude with a number of recommendations for the field.
1. Related work
In the past ten years there has been considerable interest in analyzing EER literature in order to build a better picture of research in the field. Osorio and Osorio [2],
1
compared three years of papers (1998-2000) in the Journal of Engineering Education
(JEE) and the European Journal of Engineering Education (EJEE) in terms of author data, the generic nature of the paper (i.e. project report, research report, case study, or survey), and the research topic. Later on, Osorio [3] augmented the work by discussing publication venues for EER. Wankat [4] categorized ten years (1993-2002) of papers published in the JEE based on, for example, their research topic,
theoretical framework, collected data, authors’ biographical data and whether the
paper was cited in later JEE papers. Similar work was carried out by Whitin and Sheppard [5] who also focused on JEE papers (1996-2001), analysing research topics, though using a different categorization. Borrego [6] investigated the target groups of analyses, focus areas of the generated change, and the nature of the contribution. Her data included 700 abstracts from four NSF-funded Engineering Education coalitions. Another perspective was taken by de Graaff and Kolmos [7] who considered two years of EJEE papers (2008-2009), classifying them on the basis of the research methods that were used. Finally, Jesiek et. al [8] recently carried out a very large survey by analysing in total 2173 papers published in several major engineering education journals and conferences between 2005 and 2008. They took a closer look at 885 papers, which included analysis of empirical data. In
this more detailed analysis they focused on the authors’ origin, collaboration between
the authors, research topics and their co-occurrence in the papers.
The previous categorization work in EER has strongly focused on work carried out in US, looking at many aspects such as research topics, authors and citations. The research process, i.e., how the research has been designed and carried out, has received less attention. In this paper, we will address this aspect of research. Our research questions are:
1. What are the theoretical frameworks applied in recent EER papers?
2. What is the general research setting, what data has been collected and how has it been analysed?
3. How have the previous aspects been reported in the paper? 4. What is the generic nature of the paper?
This paper builds on our previous work [1] where we presented a methodological taxonomy of EER papers. We summarize the taxonomy in the next section.
2. Methodological taxonomy
The methodological taxonomy aims to capture the essential features of the research setting, the research process and how it has been reported, by combining work from several previous classification schemes. Malmi et al. [9] analysed the computing education research literature, focusing on the theoretical foundations that were used, the overall purpose of the research, the general research design, the nature of used data and the data analysis method. From these we adopted and slightly modified the theoretical foundation, the generic research design and data source dimensions. For the data analysis dimension we used a coarser classification inspired by the work of de Graaff and Kolmos [7]. In addition, we adopted the nature dimension from Simon [10], in a slightly simpler form, which describes the generic type of the paper. Finally, we added a dimension that describes how the various aspects have been reported. None of the previous categorization systems have addressed this dimension.
The nature dimension aims at capturing the general character of the paper as a whole. It recognizes 1) empirical papers, which have the basic elements of empirical research, including clear data collection, analysis and reporting of results; 2) case reports which describe a novel educational setting, such as a new teaching method, assessment method, learning resource, learning specific software, etc., or a development project, possibly accompanied with some simple evaluation study, 3)
theory papers that discuss theoretical aspects of teaching and learning, and 4)
position papers/proposals for the EER community. All papers have some nature.
The explanatory framework dimension identifies how the paper is linked to previous theoretical or conceptual work [9], which could include theories, models, frameworks, taxonomies and other formal constructs. We count, however, only such work which we consider to be widely known in the EER community, i.e., we do not count work which seem to have been presented and used earlier in a single reference only and have no name. We do not list links to technical tools or frameworks, as well as methodological references, such as phenomenography, content analysis or various statistical tests.
The research strategy dimension presents the general design of the research, for example, experimental research, survey research, case study or phenomenography. A paper can have more than one research strategy, but not all papers have one.
The data source dimension captures all data sources used in the paper, e.g., submitted work, questionnaires, interviews, exam data or software log data. A paper may have any number of data sources, and in few cases no data source is identified. We also registered the scope of data collection as a whole, i.e., whether it has been carried out at an individual, group, institution or multi-institutional level.
The data analysis dimension describes how the empirical research data has been analysed. We identify quantitative simple methods (descriptive statistics, crosstabulations and graphs, such as histograms); quantitative complex methods denoting any form of statistical methods exceeding the previous ones; qualitative simple/ unspecified methods where qualitative data has been analysed but no clear method is reported; and qualitative enhanced denoting any qualitative methods with a clearly specified analysis process. Many papers have more than one analysis method, but some have none. We do not consider authors’ reflections, like “lessons
learned”, a method.
The reporting dimension includes our observations on how the explanatory framework(s), research strategy, research questions/goals, methodology and discussion on validity/reliability/generalizability of the research have been presented in the paper. We categorize them as explicitly presented, implicitly included within the paper among other text, or missing (when we can not identify them in the paper).
3. Data collection, analysis and validity of results
in some dimensions we did not reach a good or fair level of agreement. We therefore decided that each dimension for the whole dataset was to be analysed by a single pair who presented their consensus as their results, instead of splitting the data set into several parts and each pair categorizing them independently in all dimensions.
We acknowledge that the method is not ideal. However, we emphasize that we are looking for the big picture of the analysed data set. This implies that the magnitude of results is significant, not the information that 53% or 56% of papers belong into some category. We are confident that our results reflect the big picture well enough.
The dataset for this paper included all papers presented in the SEFI conference in the EER track in 2010 and 2011, including 29 and 33 papers correspondingly; in total 62 papers. Our selection of the data set does not reflect a view that papers published on other tracks of the conference would not include research. However, we assume that authors submitting papers to the EER track specifically wish to emphasize that they are working within EER, and therefore we deem this data presents a fair snapshot of the state of art in EER among SEFI participants. We do not make claims that the results of this work would be generalizable to the wider EER community; especially in view that journal papers have considerably more space for presenting the research process and theoretical background compared with eight-page SEFI conference papers. We thus consider our current work as a pilot study applying the new categorization scheme.
4. Results
We present and discuss the results in each dimension separately.
Nature. The overall distribution of papers in the nature dimension was, as follows: 41
(66%) of papers included empirical research, 15 (24%) were case reports and 6 (10%) were position papers/proposals. We did not find any theory papers. There was little difference between the years 2010 and 2011.
Empirical work is strongly dominant in the data set, especially if we count that most case reports also include some empirical data. We consider this a good sign of the field, as research-based development of education has to rely on an empirical base. A closer look at the empirical papers, however, revealed that only three papers (5%) presented experimental work where some form of treatment/control group arrangement was used. This method would allow making stronger conclusions about the effects of treatment than, for example, single group settings with pre/post tests, or many qualitative settings. However, the low share is understandable, because in many institutions such settings are difficult or impossible to arrange.
A closer look at the case reports revealed that they include many different types of papers: literature reviews, presentations of new teaching/learning techniques with initial results, new teaching/learning tools with example results, and descriptions of development or research projects with some example results. Compared with empirical papers, the presented results were typically more like examples or samples than presentations of full results. Proposals/position papers, on the other hand, did not include any proper presentation of data.
Explanatory framework (EF). A clear majority of papers, 45 (73%) were based on
conceptual understanding (3). In total 60 EFs were identified only once in the data pool. About three out of four empirical papers or case reports were building on some EF, whereas only one third of the proposals/position papers did so.
The diversity of EFs applied in this small set of papers is overwhelming, which demonstrates the richness of the field. On the other hand, it also indicates that researchers are clearly not working on a common ground, which may complicate interpreting each other’s terminologies and results. However, we must recognize that this is more or less evident in a multidisciplinary research field, and the results obviously also reflect the diversity of addressed problem areas in the field.
We had a closer look at the list of EFs. If we take a stricter position counting only theories and models that aim at explaining various aspects of the learning process, and leave out, for example, established educational models like problem-based and project-based learning, we concluded that about half of the papers base their work on some EF. This is considerably more than Wankat [4] reported when he analysed past JEE papers, when he found that in only 20% of papers some theory from education or psychology was used. However, the results may not be directly comparable, as Wankat did not identify clearly his criteria of including theories. Moreover, his results are dated, and JEE is currently a different type of journal. Another comparison can be made with the work of Malmi et. al [9] who identified that in almost 60% of papers published in the ICER conference, the leading computing education research conference, based their works on some theory, model, framework or instrument. However, they also counted theoretical work that was not identifiable by some name.
Research strategy (RS). 44 (71%) of the papers presented research where we
identified some RS, while in 18 papers (29%) we did not identify any clear RS. Also here there was quite a variation. The most common strategies were case studies (16 papers, 26%) and survey research (13, 21%). Other strategies were rare: design-based research (3, 5%), experimental study (3), grounded theory (2, 3%), literature review (2). Action research, Delphi study, meta-analysis, phenomenology, SWOT-analysis and technical research were used only once. Only one paper used two strategies. There was little variation between 2010 and 2011, except that in 2010, 28% of papers presented survey research, while in 2011 only 15% did so.
There were significant differences between papers with different nature. Where eight (53%) of the 15 case reports and five (83%) of the 6 proposals/positions papers had no RS, only five (12%) of the 41 empirical papers had none. This clearly demonstrates the importance of research strategy in empirical research.
Data source. Only six papers had no data at all. For the others there was a wide
selection of sources, of which the most common ones were questionnaire data (28 mentions), interviews (17), literature (8), observations (6) and various forms of study results (6). Pre/post test data was used in three papers. Other data sources included, for instance, essays, field notes, focus groups, lecture attendance, literature, reflective diaries, review data, study time and videos. There is clearly a richness of data that is used in the field.
scope in EER. However, in computing education research, the analysis by Simon et al. [10] showed that group level data is dominant and institution level data is rare.
Data analysis. Table 1 presents the crosstabulation between qualitative and
quantitative analysis methods. We can see that both methods are almost equally widely used: 24 papers (39%) applied some quantitative method and 28 (45%) papers some qualitative method. Mixed methods were used in 10 papers (16%), while no distinguishable analysis methods were used in 10 other papers.
When a paper was applying some advanced method (quantitative complex or qualitative enhanced), we did not count the simple methods separately for them. Rather we considered that the simple method is always included when some more advanced method is applied. For example, statistical analysis results are typically accompanied with some descriptive statistics.
Table 1. Data analysis methods.
No qualitative method
Qualitative simple
Qualitative
enhanced Total
No quantitative method 10 11 7 28
Quantitative simple 14 5 4 23
Quantitative complex 10 0 1 11
Total 34 16 12 62
A fairly obvious observation was that quantitative complex and qualitative enhanced methods were used only in empirical papers. Half of the ten papers including no data analysis were proposals/position papers, and the rest were case reports including project descriptions, teaching/learning technique descriptions and a tool description.
We can compare the results with the analysis by de Graaf and Kolmos [7], who classified research methods in two years of papers (N=101) in the European Journal of Engineering Education (2008-2009), and notice some differences. In their analysis they categorize 39% of papers as opinion papers/case studies, 17% as development cases, 7% as literature studies, and the remaining 37% include qualitative and/or quantitative data analysis. Compared with our data, we can conclude that the last group of papers overlaps with our empirical papers, and possibly also some papers that they considered development cases. Thus, in our data a considerably larger share of papers present empirical research findings compared with their results. Where 11 (18%) of SEFI papers applied quantitative complex methods and 12 (19%) qualitative enhanced methods, their corresponding numbers were 3% and 11%. They also identified 2% of papers using mixed methods, but did not report whether simple or complex methods were being used. As a whole, however, we conclude that somewhat more advanced methods have been applied in our data set.
papers using content analysis (with three overlapping the previous), we conclude that their data shows at least 40% of papers using qualitative enhanced methods.
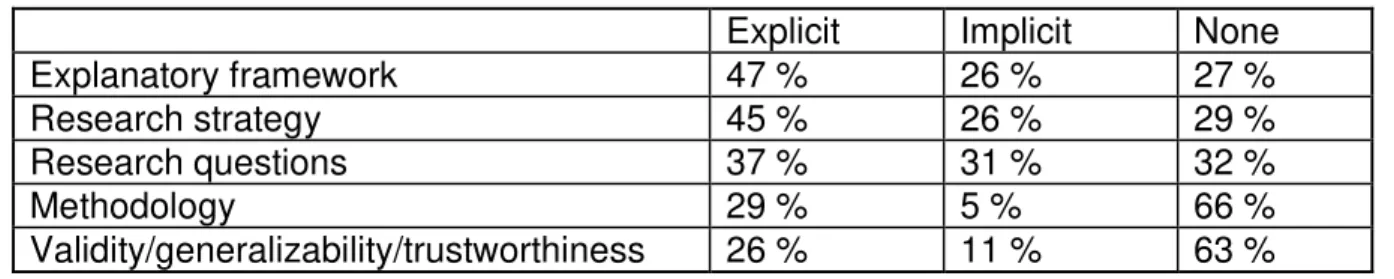
Reporting. We were interested in finding out, how the various aspects of the
research design and process were reported in the papers. We thus looked at whether some aspect was explicitly mentioned, could be implicitly derived from the description or whether we failed to find evidence of that the aspect was covered in the paper. We considered the reporting of explanatory framework(s), research strategy, research questions, methodology, and whether the paper discussed validity/generalizability/ trustworthiness of the research. The results are presented in Table 2. Note. In the methodology section we looked for an explanation of the research paradigm and motive for choosing the particular research method and procedures adopted. Although the majority of papers did describe the method adopted (sometimes in a
“methodology” section, assuming the two terms to be interchangeable) relatively few
addressed the reasoning of methodology, which led to a particular method being adopted rather than any other.
Table 2. Reporting of different aspects of research process
Explicit Implicit None
Explanatory framework 47 % 26 % 27 %
Research strategy 45 % 26 % 29 %
Research questions 37 % 31 % 32 %
Methodology 29 % 5 % 66 %
Validity/generalizability/trustworthiness 26 % 11 % 63 %
We see that in a large share of papers the research process is not fully documented, which may make it more difficult to judge the value of the paper. Especially surprising is the large share of papers without any research questions, and even larger shares of papers without methodological discussion and critical review of results.
When comparing the years 2010 and 2011, we observed that in 2011 there was considerably more explicit reporting in all analysed aspects. However, due to the small time period and total sample size, it is impossible to make any claims of actual trends, as this may simply follow from yearly fluctuation.
5. Conclusion
We therefore suggest that the SEFI conference (as well as other EER publication forums) should seriously consider revising the instructions for authors, to clarify what is to be expected from a research paper. Instructions for reviewers should also be updated so that they fall in line with the revised instructions. In our experience as reviewers of SEFI conferences, such aspects are not specifically asked to be considered. Moreover, mechanisms should be set up to check whether the guidelines are actually being implemented. Recent research from Australia [12,13] suggests that having good guidelines may in itself not be sufficient.
As most European EER authors come from engineering rather than social science or education background, it may be helpful to recommend some papers written specifically to provide background and help engineering educators get to grips with these issues. For example, papers [13-16] could be helpful in this aspect.
References
[1] Malmi, L., De Graaff, E., Adawi, T., Curmi, R., Duffy, G., Kautz, C., Kinnunen, P., Williams, B., Developing a Methodological Taxonomy of EER papers. Proceedings of SEFI Annual Conference 2012, Tessaloniki, Greece, 23-26 September, 2012.
[2] Osorio, N., Osorio. M. (2002), Engineering education in Europe and the USA: A analysis of two journals, Science and Technology Libraries, Vol. 23, No. 1, pp. 49–70.
[3] Osorio, N. (2005), What every engineer should know about engineering education, Proceedings of the American Society for Engineering Education (ASEE) 2005 Illinois-Indiana Sectional Conference, DeKalb, Illinois, USA.
[4] Wankat, P. (2004), Analysis of the first ten years of the Journal of Engineering Education,
Journal of Engineering Education, Vol. 93, No. 1, pp. 13–21.
[5] Whitin, K., Sheppard, S. (2004), Taking stock: An analysis of the publishing record as represented by the Journal of Engineering Education, Journal of Engineering Education, Vol. 93, No. 1, pp. 5–12.
[6] Borrego, M. (2007), Engineering education as a rigorous discipline: A study of the publication patterns of four coalitions. Journal of Engineering Education, Vol. 97, No. 1, pp. 5-18.
[7] De Graaff, E., Kolmos, A. (2010), Research methods in engineering education research. Proceedings of Joint International IGIP-SEFI Annual Conference 2010. Trnava, Slovakia. [8] Jesiek, B.K., Borrego, M., Beddoes, K., Hurtado, M., Rajendran, P., Sangam D. (2011),
Mapping global trends in engineering education research, 2005–2008. International Journal of
Engineering Education, Vol. 27, No. 1, pp. 77–90.
[9] Malmi, L., Sheard, J., Simon, Bednarik, R., Helminen, J., Korhonen, A., Myller, N., Sorva, J., Taherkhani, A. (2010) Characterizing research in computing education: a preliminary analysis of the literature. Proceedings of 6th International Computing Education Research Workshop, Aarhus, Denmark, pp. 3-12.
[10] Simon, Carbone, A., de Raadt, M., Lister, R., Hamilton, M., and Sheard, J.: Classifying computing education papers: Process and results, Proceedings of 4th International Computing Education Research Workshop, Sydney, Australia, pp. 161-172.
[11] Davies, M., Fleiss, J., Measuring Agreement for Multinomial Data, Biometrics, Vol. 38, No. 4. (Dec., 1982), pp. 1047-1051.
[12] Jolley, L., Willey, K., Tibbits, G., Gardiner, A. (2011), Conferences, reviews and conversations about improving engineering education, Proceedings of the Research in Engineering Education Symposium. (REES 2011), Madrid, Spain.
[13] Willey, K., Jolley, L., Tibbits, G., Gardiner, A., Investigating research quality and the review process: some suggestions for improvement, Proceedings of the SEFI Annual Conference, Lisbon, Portugal, 2011.
[14] Borrego, M., Douglas, E. P., Amelink, C. T., (2009) Quantitative, Qualitative, and Mixed Research Methods in Engineering Education, Journal of Engineering Education, Vol. 98(1). [15] Case, J, Light, G., (2011) Emerging Methodologies in Engineering Education Research, Journal
of Engineering Education, Vol. 100, No. 1, pp. 186–210.