Apparently-Different Clearance Rates from
Cohort Studies of
Mycoplasma genitalium
Are Consistent after Accounting for Incidence
of Infection, Recurrent Infection, and Study
Design
Timo Smieszek1,2*, Peter J. White1,2
1NIHR Health Protection Research Unit in Modelling Methodology and MRC Centre for Outbreak Analysis and Modelling, Department of Infectious Disease Epidemiology, School of Public Health, Imperial College London, London W2 1PG, United Kingdom,2Modelling and Economics Unit, Centre for Infectious Disease Surveillance and Control, Public Health England, London NW9 5EQ, United Kingdom
Abstract
Mycoplasma genitaliumis a potentially major cause of urethritis, cervicitis, pelvic inflamma-tory disease, infertility, and increased HIV risk. A better understanding of its natural hisinflamma-tory is crucial to informing control policy. Two extensive cohort studies (students in London, UK; Ugandan sex workers) suggest very different clearance rates; we aimed to understand the reasons and obtain improved estimates by making maximal use of the data from the
stud-ies. AsM.genitaliumis a sexually-transmitted infectious disease, we developed a model for
time-to-event analysis that incorporates the processes of (re)infection and clearance, and fitted to data from the two cohort studies to estimate incidence and clearance rates under different scenarios of sexual partnership dynamics and study design (including sample han-dling and associated test sensitivity). In the London students, the estimated clearance rate is 0.80p.a. (mean duration 15 months), with incidence 1.31%-3.93%p.a. Without adjusting for study design, corresponding estimates from the Ugandan data are 3.44p.a. (mean dura-tion 3.5 months) and 58%p.a. Apparent differences in clearance rates are probably mostly due to lower testing sensitivity in the Uganda study due to differences in sample handling, with 'true' clearance rates being similar, and adjusted incidence in Uganda being 28%p.a. Some differences are perhaps due to the sex workers having more-frequent antibiotic treat-ment, whilst reinfection within ongoing sexual partnerships might have caused some of the apparently-persistent infection in the London students. More information on partnership dynamics would inform more accurate estimates of natural-history parameters. Detailed studies in men are also required.
OPEN ACCESS
Citation:Smieszek T, White PJ (2016) Apparently-Different Clearance Rates from Cohort Studies of
Mycoplasma genitaliumAre Consistent after Accounting for Incidence of Infection, Recurrent Infection, and Study Design. PLoS ONE 11(2): e0149087. doi:10.1371/journal.pone.0149087
Editor:Brenda A Wilson, University of Illinois at Urbana-Champaign, UNITED STATES
Received:January 28, 2015
Accepted:January 27, 2016
Published:February 24, 2016
Copyright:© 2016 Crown copyright. Reproduced with the permission of the Controller of Her Majesty’s Stationery Office/Queen’s Printer for Scotland and Public Health England. The Open Government License used by Crown Copyright permits anyone to copy, publish, distribute, transmit and adapt this work for commercial and/or non-commercial purposes, with proper attribution. To view this licence, visithttp:// www.nationalarchives.gov.uk/doc/open-government-licence/version/3..
Data Availability Statement:All relevant data are within the paper.
Introduction
Sexually-transmittedMycoplasma genitaliumhas recently gained increasing attention as a major cause of urethritis [1–3], cervicitis [1,2,4], pelvic inflammatory disease (PID) [1,2], infer-tility [2,5], and increased HIV risk [2,6]. Currently testing is not routinely done in, e.g., UK or USA, and there is only limited testing in Australia [7–10], so disease would be usually diag-nosed syndromically, e.g., non-chlamydial non-gonococcal urethritis. Furthermore, frequent treatment failures [10–12] and high prevalence of macrolide-resistant strains [9,13–15] indi-cate suboptimal infection management and treatment [16,17].
M.genitalium’s impact on sexual and reproductive health necessitates a greater understand-ing of its natural history, includunderstand-ing duration of untreated infection, proportion of infections that are symptomatic, and infectivity, to inform decisions regarding if and how public health interventions should be implemented. There have been calls for such interventions forM. geni-talium[15–17], but we note that continued uncertainty regarding the natural history of Chla-mydia trachomatis[18,19] means that the (cost-)effectiveness of screening remains unknown, and the interventions now in place complicate further study.
Two extensive cohort studies [20–23] have examined aspects ofM.genitalium’s natural his-tory in women, including rates of clearance of infection; intriguingly, the clearance rates were apparently very different. As cohort studies are difficult, expensive and time-consuming to conduct, it is important to obtain the maximum information from them.
In this paper we obtain refined parameter estimates through using an analytic approach that synthesizes additional evidence reported by the studies. In particular, we take into account thatM.genitaliumis a sexually-transmitted infection, and that members of the study cohort might acquire infection during the study, and that that those infected at enrolment might recover and become infected again by the time of follow-up, which would not be distinguish-able from a persistent infection.
Furthermore, we aim to gain insight into the reasons for the differences reported by the studies, including potential reinfection within stable sexual partnerships (in a prolonged part-nership if one partner is infected then there is an elevated risk that both partners will be infected, so that if one partner recovers during the partnership, there is an elevated risk of the person becoming infected again rapidly), to determine if the differences are likely to be due to differences in study design or due to‘real’biological or behavioral differences. Finally, we make recommendations for improving future studies to inform decisions regarding if and how pub-lic-health decision-making regarding if and how interventions should be implemented.
Materials and Methods
We estimated the clearance rates from data that were collected in two cohort studies, one of students in London, UK, [20] and the other of Ugandan sex workers [21–23], using models that include acquisition of infection, including recurrent infection, as well as recovery. We fur-ther analyzed how two factors, (i) duration of sexual partnerships and (ii) test sensitivity, influ-ence parameter estimates.
In this paper, we use“recurrent infection”to refer to an infection acquired after clearance of a previous infection, and“reinfection”as a recurrent infection that is acquired within a stable sexual partnership.
Data
Female students, London, UK. Oakeshott et al. [20] conducted a combinedC.
trachoma-tisandM.genitaliumcohort study of female students in London (mean age: 21 years). Partici-pants completed a sexual-behavior questionnaire at baseline and provided self-taken vaginal and by the UK Medical Research Council for Centre
funding [grant number MR/K010174/1;http://www. mrc.ac.uk]. The funders had no role in study design, data analysis, decision to publish, or preparation of the manuscript. The views expressed are those of the authors and not necessarily those of the MRC, NHS, the NIHR, the Department of Health, or Public Health England.
swabs at baseline and follow-up, 11–32 months later. Specimens were stored at -80°C until tested forM.genitaliumby PCR.Fig 1Asummarizes results.
Female sex workers, Kampala, Uganda. Vandepitte et al. [21–23] conducted a cohort
study of women working in the sex industry in Kampala, Uganda (median age: 26 years [23]). Participants were asked to visit a project clinic at 3-month intervals, where they were repeat-edly interviewed and where specimens were collected to be tested for HIV, HSV2, syphilis, gon-orrhea, chlamydia,T.vaginalis,Candida, andM.genitalium.M.genitaliumspecimens were taken by project clinic staff using endocervical swabs. Those reporting STI symptoms or testing positive for any STI other thanM.genitalium(which was tested for ex-post) were treated promptly. Specimens were brought to a laboratory within 12 hours and stored at -20°C until tested forM.genitaliumby PCR.Fig 1Bsummarizes results.
More-detailed information about the study protocols is available in the related, freely acces-sible publications [20–23].
Simulation model calibrated to the London-student data
We represent individuals’M.genitaliuminfection status with aSusceptible-Infected-S uscepti-ble-type model, in which individuals are in one of two discrete states:Susceptible(S, uninfected) and Infected (I), as shown inFig 2A. These are the same states as used in a typical statistical survival (time-to-event) analysis; however, our model has the important difference that we also allow for individuals to become (re-)infected over time. We assume the prevalence ofM. geni-talium-positive individuals is stable over time and, hence, also the force of infection or inci-dence rate (λ) is stable.
The transitionS!Ioccurs with rateλlowfor the London students with<2 partners in the
previous year (low-risk group) and with rateλhighfor those with2 partners (high-risk group), which are the groups reported by Oakeshott et al [20]. The transitionI!Soccurs with rateγ for all individuals. Hence, the infected periodTIhas a mean ofγ-1and it is exponentially
dis-tributed withexp(γ). The susceptible periodsTSalso follow exponential distributions with
parametersλlowandλhigh, respectively. Individuals cycle between statesSandI.
Our model aims at producing the overall best fit (maximum-likelihood) to six data items as inFig 1A: the baseline prevalence in (1) the high-risk and (4) the low-risk group; the propor-tion of the initially infected individuals who were also infected at follow-up for (2) the high-risk and (5) the low-high-risk group; the proportion of those individuals whose initialM.genitalium test was negative that had a positive follow-up test for (3) the high-risk and (6) the low-risk group.
Prevalence. The probabilityPI,ithat any given individualiisInfectedat any timetxis
about the prevalence in the low- and high-risk group (seeFig 1A), the log-likelihood functions are defined as
lnLprev;lowð½llow gjdataÞ ¼ X
i2Lþ
lnPI;iðllow;gÞ þ X
j2L
ln½1 P
I;jðllow;gÞ ð1Þ
lnLprev;highð½lhigh gjdataÞ ¼ X
k2Hþ
lnPI;kðlhigh;gÞ þ X
l2H
ln½1 P
I;lðlhigh;gÞ ð2Þ
whereL+is the set of all study participantsiwho belonged to the low-risk group and tested
pos-itive forM.genitaliumat baseline;L−is the set of all study participantsjwho belonged to the
low-risk group, but had a negative initial test result;H+andH−are the respective sets for the
high-risk group.
Baseline versus follow-up measurements. The data inFig 1Aprovide information about
the infection status of all study participants at the baseline measurement, but also of many study participants at follow-up. The probabilityPIðt2Þ;ithat individualiisInfectedat time of
fol-low-up,t2, depends on the infection status at baseline (i.e., att1), the duration of the time
period between baseline and follow-up measurement,TF, as well as onλlow,λhighandγ.
Time to follow-up,TF, varied between study participants, and only the minimum, the
maxi-mum, and the median,μ1/2, are known for both the low- and the high-risk group (seeFig 1A).
For any given individuali,TFis within interval [min,μ1/2] with a probability of 50% and within
interval [μ1/2, max] also with a probability of 50%. In absence of further information about the
distribution, we assume thatTFfollows a uniform distribution within each interval.
We determined the mean probabilityPIthat an individual isInfectedat follow-up–given the
infection status at baseline and whether the individual belongs to the high- or low-risk group– stochastically, by cycling throughInfectedandSusceptiblestates untilt2is passed (Fig 2B). The
infection status at timet2determines the infection status at follow-up. For each set of
parame-ters, the estimate ofPIis based on at least 106realizations, and in areas of the parameter space
with a high likelihood, we used up to 107realizations.
The likelihood functionsLbaseline+,low,Lbaseline+,high,Lbaseline–,low, andLbaseline–,highare defined
analogous to Eqs1and2, using the mean probability of being infected att2as described above.
Combined log-likelihood function and parameter space. The combined log-likelihood is
defined as
lnLð½llow lhigh gjdataÞ ¼lnL
prev;lowð½llow gjdataÞþ
lnLprev;highð½lhigh gjdataÞþ
lnLbaselineþ;lowð½llow gjdataÞþ
lnLbaselineþ;highð½lhigh gjdataÞþ
lnLbaseline ;lowð½llow gjdataÞþ
lnLbaseline ;highð½lhigh gjdataÞ
ð3Þ
We established the likelihood landscape for a parameter space defined by vector
½llow lhigh gfor the intervalsλlowin [0.0050, 0.0500] with a step width of 10−4,γin [0.01,
4.00] with a step width of 0.01, andλhigh/λlowin [2.5, 3.5] with a step width of 0.1.
Sensitivity analyses. Having incomplete information means that we have to make some assumptions, e.g., the exact distribution of the time to follow-up. We examined scenarios to analyse how two key assumptions affect our results.
Time to follow-up:We assume that the time lag between the baseline and the follow-up measurements is uniformly distributed between the minimum and median as well as between the median and the maximum. For the sensitivity analysis, we define two other, extreme sce-narios: one scenario, whereTF= min with a probability of 50% andTF=μ1/2with probability
50%; and an alternative scenario, whereTF=μ1/2orTF= max, both with a probability of 50%. Partnership duration:We do not have any information about partnership durations, and, hence, our model does not incorporate the effects of stable sexual partnerships on infection transmission dynamics. In monogamous, stable partnerships, the risk of acquiring infections is either considerably elevated above the population average (if the partner is infected) [24] or non-existent (if the partner is not infected), compared to a situation with frequent casual part-nerships (and no stable partnership). To assess the potential bias introduced by our assump-tion, we analyze how our results would differ, if we were to assume that all individuals of the low-risk group with two consecutive positive tests were in a stable partnership and became reinfected within this partnership; in our modeling framework, these cases could not contrib-ute to the estimation of the recovery rate and so are excluded in the sensitivity analysis.
Model calibrated to Ugandan sex workers, including test sensitivity
In the study of sex workers in Uganda [21–23], sample-storage conditions and the type of spec-imens collected might have reduced sensitivity of testing relative to the London study [20], and we tested if this might be an explanation for the results having been different. We model both (i) the clearance of and recurrent infection withM.genitaliumamong the Ugandan sex-worker population–analogous to the model of the London students–and (ii) the detection of infection, allowing for false-negative test results. No information about differing levels of sexual activity are available and, hence, no further subdivision into risk groups is performed.
Prevalence. The observed prevalence from the participants’first clinic visit is modeled– analogous to the London student study–as
PI¼Psens
l lþg
lnPprevð½l g PsensjdataÞ ¼ X
I
lnPIðl;g;PsensÞ þ X
S
ln½1 P
Iðl;g;PsensÞ
ð4Þ
wherePsensdenotes the test sensitivity and can take any value between 0 (i.e., the test does not
detect any of the truly infected cases) and 1 (i.e., the test detects all infected cases and so pro-duces no false-negative results). SetIincludes all study participants who were infected as the first clinic visit, setSincludes the complement.
Clearance. We model the expected distribution of the clinic visit at which the first negative test result occurred. A negative test result can be due to clearance (analogous to the London student model, seeFig 2B), or due to a false-negative test results. We model clearance and recurrent infection as for the London students, but record false-negative results with probabil-ity 1–Psensfor every clinic visit where the simulated individual is infected.
We repeated this procedure 5106times and obtained stochastic estimates for the probabili-tiesP2,P3,P4andP5that any given individual had her first negative test result at the respective
clinic visit, as well as for the probabilityPnothat an individual didn’t have a negative result
define a log-likelihood function for the clearance ofM.genitalium:
lnLclearanceð½l g PsensjdataÞ ¼ X
65
lnP2ðl;g;PsensÞ þ. . .þ X
8
lnPnoðl;g;PsensÞ ð5Þ
Consistency with London-student data. We tested if we could construct a model (overall log-likelihood functions was the sum of Eqs4and5) using recovery rate estimates from the London-student data and which is consistent with the Ugandan sex-worker data (αlevel of 0.05) if we vary the relative testing sensitivity in the Ugandan study to obtain the best fit to the empirical data.
We tested consistency using the following recovery rates from the London-student data:
• γ, the maximum-likelihood estimate (MLE);
• γUCL, the upper bound of the 95% confidence interval (CI) of the MLE;
• γmax, the highest possible recovery rate, for which the outcomes of the London-student
model are not significantly different from the London-student data (αlevel of 0.05);
• γstable,max, the highest possible recovery rate, when we assumed that all low-risk students,
who were positive at baseline and follow-up, were in stable partnerships.
Recurrent infection in Ugandan sex workers. We further analyzed which of the
parame-ter sets (consisting of incidence and recovery rate as well as sensitivity) are consistent with apparently-recurrent infections that were observed in the Ugandan sex workers: 39% of the women who seemed to have cleared infection (i.e. tested negative after previously testing posi-tive) tested positive again within 3 to 6 months [21].
We used our model of the Ugandan sex workers to determine how likely a sequence of posi-tive-negative-positive results in successive tests is for the 109 women who had a negative test result at the 2nd, 3rd, or 4th clinic visit. We then used a binomial test (two-sided) to determine if the parameter-model combination is consistent with the observed 39% recurrent infections.
Confidence intervals and consistency
Confidence intervals for MLEs. We determined 95% confidence intervals for all MLEs
with likelihood-ratio tests. The confidence interval is, hence, defined by
2½lnLð^yjdataÞ lnLðyjdataÞ crit: ð6Þ
wherey^is the MLE,θis any other parameter vector, andcrit. is a critical value. Since the likeli-hood-ratio statistic follows approximately theχ2distribution, we obtain the critical value for
anα-level of 0.05 from this distribution.
Consistency between data and model. For all data items where the outcome was
dichoto-mous (i.e.,InfectedversusSusceptible), we used a binomial test (two-sided) to determine if a specific parameter-model combination could possibly produce the observed data. If a parame-ter set produces results that are significantly different (α-level of 0.05) from any observed data item, we deem the respective parameter set as inconsistent with the data.
Results
Overview of results
We present expected infection durations corresponding to the various estimates of clearance rate (from the two studies under different assumptions) inFig 3, and describe the details of the analyses below.
Parameter estimates for the London-student data
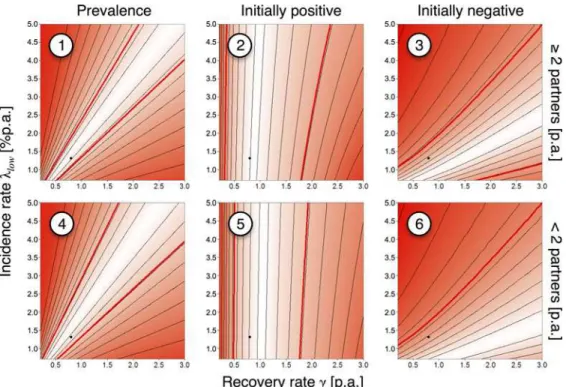
The best-fitting parameter combination, using all the available data items, is a recovery rate (γ) of 0.80p.a. (95% CI: 0.45–1.34; mean duration of infection of 15 months), with corresponding incidence rates,λlow= 1.31%p.a. (95% CI: 0.75%-2.25%) andλhigh= 3.93%p.a. (95% CI:
2.25%-6.75%), since the most likelyλhigh/λlowis 3.0 (Figs4and5). For comparison, Oakeshott et al.’s [20] estimated incidence was 0.9% (95% CI: 0.5%-1.6%). However, a very wide range of param-eter values are compatible with (i.e., not significantly different from) the empirical data (area within red contour lines,Fig 5). The maximal recovery rate (γmax) for which the model
out-comes are not significantly different from the empirical data is 1.84p.a. (mean duration ~6.5 months).
Fig 4shows the likelihood landscape for all six data items fromFig 1Aseparately. The param-etersλandγare tightly linked in the cases of prevalence (1 and 4) and infection of initially unin-fected participants (3 and 6): highλrequires highγto reproduce the data; lowλrequires lowγ. The slope of the most likely parameter range is steeper for items 1 and 4 than for items 3 and 6. The MLE forγis predominantly driven by the data on the number of initiallyM. genitalium-pos-itive participants who were still posgenitalium-pos-itive at the time of the follow-up (items 2 and 5).
The estimates are rather insensitive to changes in the assumed distribution of times to fol-low-up. In the scenario using the longest times that were consistent with the reported mini-mum, maximini-mum, and median yieldsγh= 0.75p.a. (95% CI: 0.44–1.23) andλh,low= 1.24%p.a. Fig 3. Duration of infection.Proportions of individuals remaining infected over time are shown for the various estimates of clearance rates,γstudents= 0.80p.a.,γUCL= 1.34p.a.,γmax= 1.84p.a.,γstable,max= 2.06p. a. (all based on the London-student data), andγsexwork= 3.44p.a. (based on the Ugandan sex-worker data); vertical lines mark time points when, on average, half of the initially infected individuals will have cleared the infection, depending on the respective recovery rate.
(95% CI: 0.74%-2.10%). In the scenario using the shortest times,γl= 0.86p.a. (95% CI: 0.51– 1.5) andλl,low= 1.46%p.a. (95% CI: 0.86%-2.52%).
If we assume that all low-risk individuals who were positive both at baseline and follow-up were potentially reinfected within a stable partnership, and therefore removed from the analy-sis, then the best estimate for the recovery rate shifts toγstable= 1.34p.a. (95% CI: 0.66–2.18) withλstable,low= 2.17%p.a. (95% CI: 1.08%-3.00%), but the highest possible recovery rate that
was consistent with all six data items was onlyγstable,max= 2.06p.a., which corresponds to a mean duration of infection of ~5.8 months.
Clearance of
M.
genitalium
infection in Ugandan sex workers
Clearance ofM.genitaliumin the Ugandan sex-worker cohort appeared to be relatively fast, compared with to the London-student cohort: a simple analysis, fitting an exponential curve to the five data points suggests a recovery rateγ= 3.14p.a., corresponding to a mean duration of infection of ~3.8 months.
Fig 6shows the results of a model fit, where we aimed at producing the best fit to the initial prevalence and the apparent clearance as inFig 1B. The best-fitting parameter combination is γ= 3.44p.a. (95% CI: 2.78–4.29);λ= 58%p.a. (95% CI: 44%-78%). Neither the confidence inter-vals, nor the plausible parameter ranges for the London-student (γmax= 1.84p.a.) and the Ugandan sex-worker (γmin= 2.67p.a.) models overlap, suggesting that additional factors need
to be incorporated in the model to explain both datasets with one common recovery rate. Fig 4. Likelihood landscapes by data item, London students.Upper and lower rows of the panels correspond, respectively, to the high-risk group (2 partners in the preceding year at baseline) and low-risk group (<2 partners); columns of the panels correspond to the prevalence at baseline, the proportion of positive tests at follow-up among the initiallyM.genitalium-positive participants, and the proportion of positive test at follow-up among the initially negative participants. Numbering corresponds toFig 1A; black dots: overall maximum-likelihood estimate (MLE) for the recovery (γ= 0.80p.a.) and the incidence rates (λlow= 1.31%p.a.); the ratioλhigh/λlowwas fixed at the MLE of 3.0; thin, black contours: equal likelihood; colored areas: white indicates maximum likelihood, red indicates low likelihood; thick, red contours: parameter area where the model is consistent with the empirical data (α<0.05).
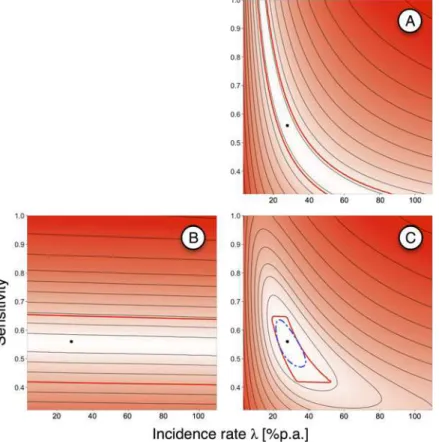
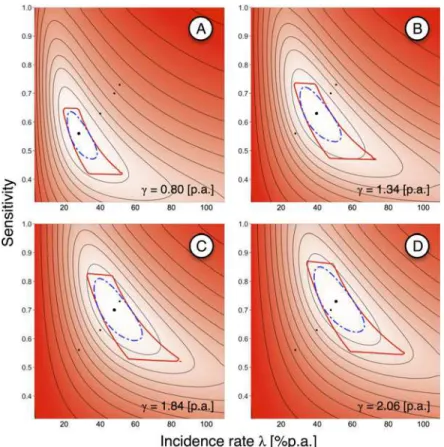
Since one explanation for the apparent differences between the studies in clearingM. genita-liummight be lower testing sensitivity in the Vandepitte et al. study [21], due to different swab-bing sites and sample handling, we varied the sensitivity to see if this could‘reconcile’the observed patterns (cf.Fig 7).Fig 8shows sensitivity and incidence estimates for various recov-ery rates that were derived from the London-student model. Forγ= 0.80p.a., the best fitting parameter combination wasλ= 28%p.a. (95% CI: 22%-38%) with a sensitivity of 56% (95% CI: 47%-63%). The highest relative sensitivity that is consistent with the data is 64%. Forγstable,max
= 2.06p.a. (i.e., the highest plausible recovery rate in the scenario where all seemingly-persistent infections in the low-risk student group were due to reinfection within a stable partnership), the MLE for the sensitivity is 73% (95% CI: 63%-85%), and the highest plausible sensitivity is 86%.
Vandepitte et al. [21] report that“39% of the women who cleared the infection re-gained positive samples again within 3 to 6 months. Some of these recurrent infections could have been persistent infections after a previous false-negative result”; this reported percentage is consistent with our estimate of that study’s sensitivity, and withγ= 0.80p.a., the clearance rate which best explains information from both cohort studies. Higher clearance rates combined with higher sensitivities resulted in substantially lower percentages of participants expected showing this pattern, and they were significantly different from the observed figure and, hence, inconsistent with the empirical data.
Fig 5. Recovery rate vs. incidence rate, maximum-likelihood estimate and plausible parameter range, London students.Black dot: maximum-likelihood estimate (MLE) for the recovery rate (γ= 0.80p.a.) and the incidence rate (λlow= 1.31%p.a.); the ratioλhigh/λlowwas fixed at the MLE of 3.0; thin, black contours: equal likelihood; combined likelihood for all six data items (seeFig 4); colored areas: white indicates maximum likelihood, red indicates low likelihood; thick, dashed, blue contour: 95% CI of the MLE; thick, red contour: parameter area where the model is consistent with the empirical data (α<0.05).
Discussion
We aimed to improve estimates of the recovery and incidence rates ofM.genitaliumfrom cohort studies. Whilst incidence of infection and rates of antibiotic treatment are dependent upon context and patient behavior, and, hence, may vary markedly between studies, rates of natural clearance are likely to be less variable. Estimation of the clearance rate requires adjust-ing for other factors that are particular to each study settadjust-ing.
Factors which impact on clearance rate estimates
There are several factors that might have affected our estimates.
Study protocols. Oakeshott et al. [20] used self-taken vaginal swabs and Vandepitte et al. [21] used staff-taken endocervical swabs. Previous studies suggest that vaginal swab specimens have a higher relative sensitivity than endocervical swab specimens [25,26], and that self-obtained specimens appear to be of similar quality as specimens collected by trained staff [25].
Furthermore, Oakeshott et al. [20] stored samples at lower temperatures than Vandepitte et al. [21]: -80°C compared with initial storage at 4°C (up to 12 hours) followed by -20°C for more than two years before they were tested forM.genitalium. Others have reported that DNA degradation might be slower at -80°C than -20°C [27], affecting test sensitivity.
Fig 6. Recovery rate vs. incidence rate, maximum-likelihood estimate and plausible parameter range, Ugandan sex workers.Black dot: maximum-likelihood estimate (MLE) for the recovery rate (γ= 3.44p.a.) and the incidence rate (λlow= 58%p.a.); thin, black contours: equal likelihood; colored areas: white indicates maximum likelihood, red indicated low likelihood; thick, dashed, blue contour: 95% CI of the MLE; thick, red contour: parameter area where the model is consistent with the empirical data (α<0.05); vertical lines:
estimates from London-student data; dotted: maximum-likelihood estimate (γ= 0.80p.a.); short-dashed: highest plausible estimate (γmax= 1.84p.a.); long-dashed: highest plausible with stable partnership assumption (γstable,max= 2.06p.a.).
Also, other factors, such as the transport media, DNA extraction methods, and PCR test kits might have influenced clearance rate estimates. A thorough assessment as to how exactly these differences might have had an impact on test sensitivity cannot be provided at this time, as they have not been studied or findings have not been published, so far.
In light of the discussed protocol differences, we would expect more false-negative test results in the Ugandan study, which would bias parameter estimates towards shorter infection periods because individuals were no longer considered in the published data after their first negative test result. This is corroborated by the agreement of our model results with the fre-quency of positive-negative-positive results for consecutive time-points, as reported by Vande-pitte et al. [21].
A consequence of low relative sensitivities in the Ugandan study is also a higher prevalence than the crude estimate of 14.4%. The highest relative sensitivity estimate compatible with the data is 64%, and the maximum-likelihood estimate is 56%; using these estimates increases the prevalence estimate to 22.5% and 25.7%, respectively. These estimates are consistent withM. genitaliumprevalence estimates for female sex worker populations in developing countries, which were up to 33.5% in Honduras [28] and 26.3% in Ghana and Benin [29].
Unintentional treatment. Neither cohort study provided treatment specifically forM. genitalium. However, individuals with symptomatic infection might have been treated Fig 7. Incidence rate vs. sensitivity, maximum-likelihood estimate and plausible parameter range, Ugandan sex workers.(A) Initial prevalence. (B) continuouslyM.genitalium-positive participants over time. (C) Both data items combined. Thick, black dot: maximum-likelihood estimate (MLE) for the incidence rate (λlow= 28%p.a.) and sensitivity (56%) with recovery rate fixed atγ= 0.80p.a. (from London-student data); thin, black contours: equal likelihood; colored areas: white indicates maximum likelihood, red indicated low likelihood; thick, dashed, blue contour: 95% CI of the MLE; thick, red contour: parameter areas where the model is consistent with the empirical data (α<0.05).
presumptively, and those who were co-infected with another bacterial STI, particularlyC. tra-chomatisorN.gonorrhoeae, were given treatment for the co-infection, which might have cured them ofM.genitalium.
Vandepitte et al. reported treating participants with antibiotics, including doxycycline, cip-rofloxacin, ceftriaxone, and metronidazole [21]. Doxycycline has a reported cure rate forM. genitaliumof 17%-94% [30]. A wide range of antibiotics are effective or partly effective against at least someM.genitaliumstrains [31,32]. Therefore, treatment for non-STI infections might also have unintentionally clearedM.genitalium. However, Vandepitte et al. did not detect a higher clearance rate in co-infected participants and reported that they did not detect an asso-ciation between clearance ofM.genitaliumand receipt of antibiotics [21].
Although any effect may have been marginal, we expect that unintentional treatment ofM. genitaliumwould have been more frequent in the Ugandan study, since there was frequent STI testing and treatment [22]. Furthermore, STI co-infection was more common among Ugandan sex workers than London students, particularly forN.gonorrhoeae, which occurred in 20.9% of M.genitalium-positive samples from Ugandan sex workers, whilst no co-infection was detected in the London students. In the London study at baseline 10% ofM.genitaliuminfections were co-infected withC.trachomatiscompared to 12% in the Ugandan study. Due to the difference Fig 8. Incidence rate vs. sensitivity, maximum-likelihood estimates and plausible parameter ranges for different recovery rates, Ugandan sex workers.Recovery rates,γ, all from London-student data. (A) maximum-likelihood estimate,γ= 0.80p.a. (B) upper bound of 95% confidence interval,γUCL=γstable= 1.34p. a. (C) highest possible estimate,γmax= 1.84p.a. (D) highest possible estimate when assumed stable partnerships were excluded,γstable,max= 2.06p.a. Thick, black dots: MLEs for incidence rate and sensitivity with fixed recovery rates; thin, black dots: maximum-likelihood estimates (MLEs) for the other recovery rates; thin, black contours: equal likelihood; colored areas: white indicates maximum likelihood, red indicated low likelihood; thick, dashed, blue contour: 95% CI of the MLE; thick, red contour: parameter areas where the model is consistent with the empirical data (α<0.05).
inN.gonorrhoeaeco-infection, any effect of unintentional treatment ofM.genitaliumwill have likely been smaller in the London study.
Sexual behavior. ForC.trachomatis, it is thought that subclinical infections can be trans-mitted back and forth between partners in a steady sexual relationship without being detected and treated [33,34]. SinceM.genitaliuminfections are frequently asymptomatic [20,35], repeated reinfection within stable partnerships (potentially with several cycles of recovery and reinfection) might be an important cause of apparently-persistent infection within an individ-ual when the interval between testing is relatively long, as in the London study. (The authors reported that genotyping suggested patients testing positive at baseline and follow-up had per-sistent infections, but these results are also conper-sistent with recovery and reinfection within sta-ble partnerships.) This would bias our estimates towards lower recovery rates (i.e., longer infection duration) and lower incidence estimates.
Biological differences. The London and Uganda cohorts will have differed in their ethnic composition, with the former being more ethnically diverse [20]. People of different ethnicities might have genetic or other biological differences affecting effectiveness of drug treatments [36] or susceptibility to certain infections [37]. Women of African descent might differ from white women in their immune response to bacterial STIs related to PID [38,39]. Finally, the strains ofM.genitaliumin the two populations might have had different phenotypes. However, we have no direct evidence for biological differences and the results of our analyses suggest that any such differences are unlikely to have a substantial impact on the two studies.
Parts of the Uganda cohort were infected with HIV, but Vandepitte et al. [21] found no association between clearance rates ofM.genitaliumand HIV statusper se. Only those HIV-positive participants with a very low CD4 count (<350/ml) had a slower clearance rate than
HIV-negatives. With only 16 such individuals in the cohort, modeling this group explicitly will have had little impact on our estimates.
Interpretation of results
Infection duration in the London-student data appeared to be long (mean duration 15 months), whereas in the Ugandan sex-worker cohort more than half of the initiallyM. genita-lium-positive participants appeared to have cleared the infection after three months (Fig 3).
We tested the importance of incomplete information by comparing the results of scenarios using different assumptions. Uncertainty in the timing of follow-up testing in the London study makes relatively little difference to estimates, whilst scenarios regarding reinfection result in potentially substantial differences. We identified partnership duration as well as the tempo-ral gap until reinfection within a partnership occurs as critical factors affecting the recovery rate estimate; both are unknown. The basic model for the London data (which ignores partner-ship duration) might have overestimated the infection duration, but the corresponding MLE also explained recurrent infection in the Ugandan sex workers best. The Ugandan data most likely suggests too-short durations of (untreated) infection because of unintentional treatment ofM.genitaliumin co-infected individuals, and probably reduced test sensitivity due to long-term sample storage at -20°C (and, potentially, the choice of transport media or DNA extrac-tion method) and the use of endocervical instead of vaginal swabs. Possibly–although Vande-pitte et al. did not detect an effect–unintentional treatment ofM.genitaliumin co-infected individuals might have played a minor role.
the London-student and the Ugandan sex-worker data are inconsistent with the findings of Tosh et al. [40], who reported that among adolescent women in the USA“31.3% of untreated M.genitaliumcases had infection lasting over 8 weeks”, suggesting a mean duration of<2
months–i.e., a recovery rate>6p.a., which is outside the plausible ranges of both the London-student and the Ugandan sex-worker model. Long-term storage (up to 2 years, although at -70°C) and treatment of co-infections (15/52M.genitalium-positive women tested positive for C.trachomatisand were treated [40]) might have contributed to this high apparent recovery rate (drug resistance inM.genitaliummay have been lower at the time of the study enrollment, 1999–2006, than more recently [7]), but the difference from the other two studies is not fully understood. An in vitro study also suggests that infection may be prolonged [41].
Future research needs
M.genitaliumis causing increasing concern, particularly regarding if and how it should be managed at the population level, including whether there should be screening or targeted test-ing [7,9,13,16,17]. Robust parameter estimates are needed for improved understandtest-ing ofM. genitaliumepidemiology, to inform public health policy, including assessment of cost-effec-tiveness of intervention strategies.
To better understand the epidemiology ofM.genitalium, we need robust knowledge about fundamental natural-history parameters [17,30,42], including the duration of untreated infec-tion [10], for reliably identifying groups of individuals that are more likely to contract new infections and/or that are more likely to transmit infection to others [43]. (In Britain, 66% of individuals aged 16–44 years who were infected with Chlamydia had not been tested in the last year [44], making the duration of untreated infection an important determinant of transmis-sion.) There is still considerable uncertainty in rates of sequelae due toC.trachomatis[18], contributing to continuing uncertainty in cost-effectiveness of screening for that infection [16,30]; we suggest that corresponding knowledge gaps forM.genitaliumshould be addressed before decision are taken.
Future studies would ideally have larger numbers of initiallyM.genitalium-positive partici-pants, followed-up sufficiently frequently to detect changes on timescales of a few weeks [40]. Specimens should be collected from the vagina and from the cervix, if possible, as this results in higher sensitivity [25,26].
Further, ideally, all factors mentioned in the previous section would be controlled for. Col-lecting more detailed information on sexual behavior and antibiotic use (e.g., Walker et al. [10]) would greatly enhance the value of cohort studies. As we have shown, to estimate the duration of infection, it is important to have information on the incidence (which can lead to recurrent infection) at the individual level, as it is highly heterogeneous: persons in a stable sex-ual partnership with an infected partner experience a high incidence, typicallygreaterthan per-sons who have frequent casual partnerships (but no stable partner), whilst those in an
uninfected mutually monogamous partnership have no infection risk. Estimating natural clear-ance rates requires accounting for antibiotic treatment, including unintentional treatment (e.g., for coinfections).
Finally, asM.genitaliumis a sexually-transmitted infection which infected women typically acquire from men, it is important to better understand its natural history in males; further studies are required.
Acknowledgments
Author Contributions
Analyzed the data: TS. Wrote the paper: TS PJW. Designed the model: TS PJW.
References
1. Workowski KA, Berman SM. Centers for Disease Control and Prevention Sexually Transmitted Dis-ease Treatment Guidelines. Clin Infect Dis. 2011; 53: S59–S63. doi:10.1093/cid/cir694PMID: 22080270
2. Taylor-Robinson D, Jensen JS.Mycoplasma genitalium: from chrysalis to multicolored butterfly. Clin Microbiol Rev. 2011; 24: 498–514. doi:10.1128/CMR.00006-11PMID:21734246
3. Horner P, Thomas B, Gilroy CB, Egger M, Taylor-Robinson D. Role ofMycoplasma genitaliumand
Ureaplasma urealyticumin acute and chronic nongonococcal urethritis. Clin Infect Dis. 2001; 32: 995–
1003. PMID:11264026
4. Manhart LE, Critchlow CW, Holmes KK, Dutro SM, Eschenbach DA, Stevens CE, et al. Mucopurulent cervicitis andMycoplasma genitalium. J Infect Dis. 2003; 187: 650–657. PMID:12599082
5. Svenstrup HF, Fedder J, Kristoffersen SE, Trolle B, Birkelund S, Christiansen G.Mycoplasma genita-lium,Chlamydia trachomatis, and tubal factor infertility–a prospective study. Fertil Steril. 2008; 90: 513–520. PMID:17548070
6. Vandepitte J, Weiss HA, Bukenya J, Kyakuwa N, Muller E, Buvé A, et al. Association between Myco-plasma genitaliuminfection and HIV acquisition among female sex workers in Uganda: evidence from a nested case-control study. Sex Transm Infect. 2014; 90: 545–549. doi: 10.1136/sextrans-2013-051467PMID:24687129
7. Manhart LE. Diagnostic and resistance testing forMycoplasma genitalium: what will it take? Clin Infect Dis. 2014; 59: 31–33. doi:10.1093/cid/ciu224PMID:24729505
8. Le Roy C, Pereyre S, Bébéar C. Evaluation of two commercial real-time PCR assays for detection of
Mycoplasma genitaliumin urogenital specimens. J Clin Microbiol. 2014; 52: 971–973. doi:10.1128/ JCM.02567-13PMID:24371239
9. Taylor-Robinson D. Diagnosis and antimicrobial treatment ofMycoplasma genitaliuminfection: sober-ing thoughts. Expert Rev Anti Infect Ther. 2014; 12: 715–722. doi:10.1586/14787210.2014.919220 PMID:24834454
10. Walker J, Fairley CK, Bradshaw CS, Tabrizi SN, Twin J, Chen MY, et al.Mycoplasma genitalium. Inci-dence, Organism Load, and Treatment Failure in a Cohort of Young Australian Women. Clin Infect Dis. 2013; 56:1094–1100. doi:10.1093/cid/cis1210PMID:23300236
11. Manhart LE, Gillespie CW, Lowens MS, Khosropour CM, Colombara DV, Golden MR, et al. Standard treatment regimens for nongonococcal urethritis have similar but declining cure rates: a randomized controlled trial. Clin Infect Dis. 2013; 56: 934–942. doi:10.1093/cid/cis1022PMID:23223595
12. Mena LA, Mroczkowski TF, Nsuami M, Martin DH. A randomized comparison of azithromycin and doxy-cycline for the treatment ofMycoplasma genitalium-positive urethritis in men. Clin Infect Dis. 2009; 48: 1649–1654. doi:10.1086/599033PMID:19438399
13. Salado-Rasmussen K, Jensen JS.Mycoplasma genitaliumtesting pattern and macrolide resistance: a Danish nationwide retrospective survey. Clin Infect Dis. 2014; 59: 24–30. doi:10.1093/cid/ciu217 PMID:24729494
14. Jensen JS, Bradshaw CD, Tabrizi SN, Fairley CK, Hamasuna R. Azithromycin treatment failure in
Mycoplasma genitalium-positive patients with nongonococcal urethritis is associated with induced macrolide resistance. Clin Infect Dis. 2008; 47: 1546–1553. doi:10.1086/593188PMID:18990060 15. Pond MJ, Nori AV, Witney AA, Lopeman RC, Butcher PD, Sadiq ST. High prevalence of
antibiotic-resis-tantMycoplasma genitaliumin nongonococcal urethritis: the need for routine testing and the inade-quacy of current treatment options. Clin Infect Dis. 2014; 58: 631–637. doi:10.1093/cid/cit752PMID: 24280088
16. Horner P, Blee K, Adams E. Time to manageMycoplasma genitaliumas an STI: but not with azithromy-cin 1g! Curr Opin Infect Dis. 2014, 27: 68–74. doi:10.1097/QCO.0000000000000030PMID:24322592 17. Daley GM, Russell DB, Tabrizi SN, McBride J.Mycoplasma genitalium: a review. Int J STD AIDS.
2014; 25: 475–487. PMID:24517928
18. Haggerty CL, Gottlieb SL, Taylor BD, Low N, Xu Fujie, Ness RB. Risk of sequelae afterChlamydia tra-chomatisgenital infection in women. J Infect Dis. 2010; 201(S2): S134–S155.
20. Oakeshott P, Aghaizu A, Hay P, Reid F, Kerry S, Atherton H, et al. IsMycoplasma genitaliumin women the‘new chlamydia?’A community-based prospective cohort study. Clin Infect Dis. 2010; 51: 1160–
1166. doi:10.1086/656739PMID:20942656
21. Vandepitte J, Weiss HA, Kyakuwa N, Nakubulwa S, Muller E, Buvé A, et al. Natural history of Myco-plasma genitaliuminfection in a cohort of female sex workers in Kampala, Uganda. Sex Transm Dis. 2013; 40: 422–427. doi:10.1097/OLQ.0b013e31828bfccfPMID:23588134
22. Vandepitte J, Bukenya J, Weiss HA, Nakubulwa S, Francis SC, Hughes P, et al. HIV and other sexually transmitted infections in a cohort of women involved in high-risk sexual behaviour in Kampala, Uganda. Sex Transm Dis. 2011; 38: 316–323. PMID:23330152
23. Vandepitte J, Muller E, Bukenya J, Nakubulwa S, Kyakuwa N, Buvé A, et al. Prevalence and correlates ofMycoplasma genitaliuminfection among female sex workers in Kampala, Uganda. J Infect Dis. 2012; 205: 289–296. doi:10.1093/infdis/jir733PMID:22102734
24. Manhart LE, Kay N.Mycoplasma genitalium: is it a sexually transmitted pathogen? Curr Infect Dis Rep. 2010; 12: 306–313. doi:10.1007/s11908-010-0114-3PMID:21308546
25. Wroblewski JKH, Manhart LE, Dickey KA, Hudspeth MK, Totten PA. Comparison of transcription-medi-ated amplification and PCR assay results for various genital specimen types for detection of Myco-plasma genitalium. J Clin Microbiol. 2006; 44: 3306–3312. PMID:16954265
26. Lillis RA, Nsuami MJ, Myers L, Martin DH. Utility of urine, vaginal, cervical, and rectal specimens for detection of Mycoplasma genitalium. J Clin Microbiol. 2011; 49: 1990–1992. doi: 10.1128/JCM.00129-11PMID:21411587
27. Carlsen K, Jensen J.Mycoplasma genitaliumPCR: does freezing of specimens affect sensitivity? J Clin Microbiol. 2010; 48: 3624–3627. doi:10.1128/JCM.00232-10PMID:20720022
28. Johnston LG, Paz Bailey G, Morales-Miranda S, Morgan M, Alvarez B, Hickman L, et al. High preva-lence ofM.genitaliumamong female sex workers in Honduras: implications for the spread of HIV and other sexually transmitted infections. Int J STD AIDS. 2012; 23: 5–11. doi:10.1258/ijsa.2009.009446 PMID:22362680
29. Pépin J, Labbé A- C, Khonde N, Deslandes S, Alary M, Dzokoto A, et al.Mycoplasma genitalium: an organism commonly associated with cervicitis among west African sex workers. Sex Transm Infect. 2005; 81: 67–72. PMID:15681727
30. Manhart LE, Broad JM, Golden MR.Mycoplasma genitalium: should we treat and how? Clin Infect Dis. 2011; 53: S129–S142. doi:10.1093/cid/cir702PMID:22080266
31. Hamasuna R, Osada Y, Jensen JS. Antibiotic susceptibility testing ofMycoplasma genitaliumby Taq-Man 5' nuclease real-time PCR. Antimicrob Agents Chemother. 2005; 49: 4993–4998. PMID: 16304163
32. Duffy LB, Crabb D, Searcey K, Kempf MC. Comparative potency of gemifloxacin, new quinolones, macrolides, tetracycline and clindamycin againstMycoplasmaspp. J Antimicrob Chemother. 2000; 45: 29–33.
33. Hosenfeld CB, Workowski KA, Berman S, Zaidi A, Dyson J, Mosure D, et al. Repeat infection with chla-mydia and gonorrhea among females: a systematic review of the literature. Sex Transm Dis. 2009; 36: 478–489. doi:10.1097/OLQ.0b013e3181a2a933PMID:19617871
34. Golden M, Whittington W. Effect of expedited treatment of sex partners on recurrent or persistent gonor-rhea or chlamydial infection. N Engl J Med. 2005; 352: 676–685. PMID:15716561
35. Anagrius C, Loré B, Jensen JS.Mycoplasma genitalium: prevalence, clinical significance, and trans-mission. Sex Transm Infect. 2005; 81: 458–462. PMID:16326846
36. Burroughs V, Maxey R, Levy R. Racial and ethnic differences in response to medicines: towards indi-vidualized pharmaceutical treatment. J Natl Med Assoc. 2002; 94: 1–26.
37. Stead W, Senner J, Reddick W, Lofgren JP. Racial differences in susceptibility to infection by Myco-bacterium tuberculosis. N Engl J Med. 1990; 322: 422–427. PMID:2300105
38. Taylor BD, Darville T, Ferrell RE, Ness RB, Haggerty CL. Racial variation in toll-like receptor variants among women with pelvic inflammatory disease. J Infect Dis. 2013; 207: 940–946. doi:10.1093/infdis/ jis922PMID:23255565
39. Taylor BD, Darville T, Ferrell RE, Kammerer CM, Ness RB, Haggerty CL. Variants in toll-like receptor 1 and 4 genes are associated with Chlamydia trachomatis among women with pelvic inflammatory dis-ease. J Infect Dis. 2012; 205:603–9. doi:10.1093/infdis/jir822PMID:22238472
41. McGowin CL, Annan RS, Quayle AJ, Greene SJ, Ma L, Mancuso MM, et al. PersistentMycoplasma genitaliuminfection of human endocervical epithelial cells elicits chronic inflammatory cytokine secre-tion. Infect Immun. 2012; 80: 3842–3849. doi:10.1128/IAI.00819-12PMID:22907815
42. Manhart LE, McClelland RS.Mycoplasma genitaliumInfection in Sub-Saharan Africa: How Big Is the Problem? Sex Transm Dis. 2013; 40: 429–430.
43. Smieszek T, Salathé M. A low-cost method to assess the epidemiological importance of individuals in controlling infectious disease outbreaks. BMC Med. 2013; 11: 35. doi:10.1186/1741-7015-11-35 PMID:23402633
![Fig 1. Flow charts of two cohort studies. (A) Oakeshott et al. [20]; numbers 1 to 6 are data items that are referred-to in the text; follow-up was after 12–21 months (median 16 months) for items 2 and 5 (grey), and after 11 – 32 months (median 16 months) f](https://thumb-eu.123doks.com/thumbv2/123dok_br/18437066.362760/3.918.294.850.94.707/charts-cohort-studies-oakeshott-numbers-referred-follow-months.webp)