1
Hmong Americans’ Educational Attainment: Recent Changes and Remaining Challenges1
By
Yang Sao Xiong
University of California, Los Angeles
Hmong Studies Journal, Volume 13(2), 2010 Census Issue, 18 Pages
Abstract
Using U.S. Census data from 1990 to 2010, this paper examines Hmong Americans’ language use, English language ability, school attendance, high school dropout rate, and educational attainment. The data reveal significant improvements in Hmong Americans’ English language ability, attendance at higher levels of education, and higher education completion. The data also show that there are differences between states, between males and females, and between age cohorts with respect to certain educational outcomes. Additionally, the gap between Hmong females and males in terms of high school dropouts and educational attainment has narrowed considerably. I discuss the implications of these findings and consider some of the persistent structural challenges that Hmong American students continue to face in K-12 public schools.
Keywords: Hmong Americans, Educational Attainment, American Community Survey, English Learners, Tracking
In 1990, Hmong school-age children who were enrolled in school numbered 33,200,
comprising about 35 percent of the Hmong American population.2 By 2001, this virtually doubled to 65,500—a number equal to the entire Hmong Californian population as enumerated
in the 2000 U.S. census. According to the latest 2010 census, about 71,900 Hmong school-age
children were enrolled in school. Of this group, about 90 percent are U.S. citizens and 10
percent are non-citizens.3 Eighty-seven percent of these students reside in three states: California (38 percent), Minnesota (28 percent), and Wisconsin (21 percent). Using past and recent U.S.
1
I am grateful to Nao Xiong and Bruce Thao for their invaluable comments on an earlier draft, the anonymous reviewers at HSJ for reading the revised draft, and Mark Pfeifer for his editorial assistance throughout this project. 2
School-age children are between 5 and 17 years old. In this paper, I use the term Hmong American and Hmong interchangeably to refer to the ethnic population of Hmong former refugees and their children in the United States. 3
2
census data, this paper describes and analyzes the trends in Hmong Americans’ English ability,
home language use, school attendance, high school dropouts, and educational attainment. I
begin by describing the data sources used in this paper. Next, I present the research findings
focusing on the changes in Hmong Americans’ educational outcomes. Then I discuss some of
the implications of the findings for future research and policy.
Data and Caveats
This paper uses data from three main sources: the U.S. Census Bureau’s 1990 Census of
the Population publication on “Asians and Pacific Islanders in the U.S.” (U.S. Bureau of the
Census 1993), the Census 2000’s 100 percent Summary File 4, and the single-year and
multi-year American Community Survey (ACS) public use microdata samples (PUMS).4 Of these sources, only the Census 2000 Summary File 4 contains 100 percent data. The U.S. Census 1990
and the ACS PUMS datasets contain samples that, when weighted, are meant to be representative
of the U.S. population. At present, data from the U.S. Census represent the only sources of
nationally representative data on Hmong in the United States.
Before moving on to the results, a few caveats about the data are in order. First, this
paper used the race variable in the ACS PUMS to create nationally representative samples
containing “Hmong alone” cases.5 This method generated significant sample sizes: between 500
and 1,900 unweighted cases per single-year ACS dataset and 8,084 unweighted cases in the ACS
2006-10 multiyear dataset. Had other variables such as language and ancestry also been used as
selector variables, the sample sizes of the individual datasets would have been slightly or
somewhat larger. But the results and weighted estimates do not differ significantly whether we
4
The ACS PUMS contain frequency weights which were used to conduct the descriptive statistics for this paper. 5
3
use race as the only selector variable or race along with language and ancestry. Second, it is
important to keep in mind that U.S. census data are not longitudinal data. That is, the census
datasets do not contain information on the same identifiable persons from one survey period to
the next. As such, the census data cannot tell us when, whether or how much individual persons’
characteristics or outcomes may have changed over time. When I speak of “trends,” I mean to
speak only of changes at the group level or changes in group averages. Finally, when comparing
the figures reported in this paper with those reported elsewhere, it is important to note the
variables, such as age and/or sex, that have been used to delimit the groups or cohorts. For
instance, it would be more appropriate to compare the average educational attainment of Hmong
females aged 25 years or over with only that of Hmong males aged 25 years or over rather than
with that of Hmong males of all ages.
English Ability and Home Language
Data from the ACS 2010 show that Hmong Americans of five years and older numbered
about 217,200 or 89 percent of the Hmong American population (243,800). Persons of this age
cohort were asked up to three language questions: Does this person speak a language other than
English at home? What is this language? And, how well does this person speak English (very
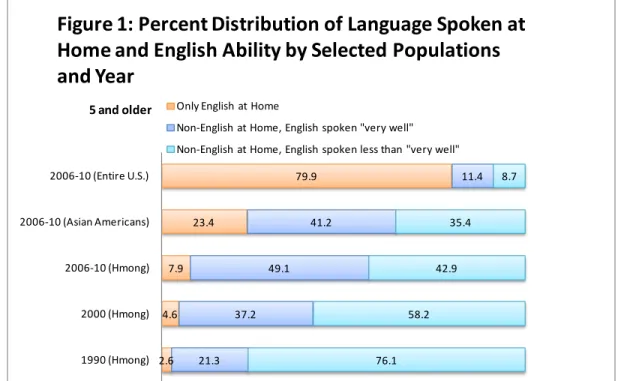
well, well, not well, not at all)?6 Figure 1 compares Hmong Americans five years and older to the Asian American and national populations of five years and older who responded to the
language questions. Both home language use and English ability are shown in the figure but let
us focus first on English ability.
6
The U.S. census appears to automatically presume that those who speak only English at home are fluent English speakers. Accordingly, the English speaking ability question is directed at only at those persons who reported speaking a non-English language at home. List of questions retrieved May 1, 2011 from:
4
In 1990, 21.3 percent of Hmong persons who responded to the language questions
reported speaking English “very well.”7 This increased to 37.2 percent in 2000. During the
2006-2010 period it increased again to 49.1 percent. Meanwhile, the proportion of Hmong
Americans who speak only English at home increased from three percent in 1990 to eight
percent by the 2006-2010 period. If we assume that those respondents who reported speaking
English very well and those who reported speaking only English at home speak English fluently,
then 57 percent of all Hmong Americans would be fluent English speakers. Although this is a
significant increase from 23.9 percent in 1990, it is still eight percentage points less than the
proportion of English-fluent Asian Americans and 34 percentage points less than the proportion
of the English-fluent U.S. Americans.
But how are the young Hmong people doing in terms of English ability? The evidence
from the ACS single-year datasets shows that, among Hmong school-age children, ages 5 to 17
years, who are enrolled in school, the proportion of fluent English speakers increased from 61.7
percent in 2001 to 66.8 percent in 2005. This further increased to 71.8 percent in 2010 (not
shown). Unfortunately, the census data do not contain any information about English reading or
writing ability or about native speaking, reading or writing ability. As such, we do not know
about Hmong Americans’ English literacy or their native language proficiency.
Besides English speaking ability, figure 1 also shows language use at home. The latest
data indicate that 92 percent of Hmong Americans speak a language other than English at home
(down from 97 percent in 1990). Of those who speak a foreign language besides English at
7
5
home, 98 percent speak Hmong,8 one percent speak Lao, and a fraction speak other languages (not shown). For comparison, 77 percent of Asian Americans speak a foreign language besides
English at home.
Hmong Americans’ Educational Outcomes
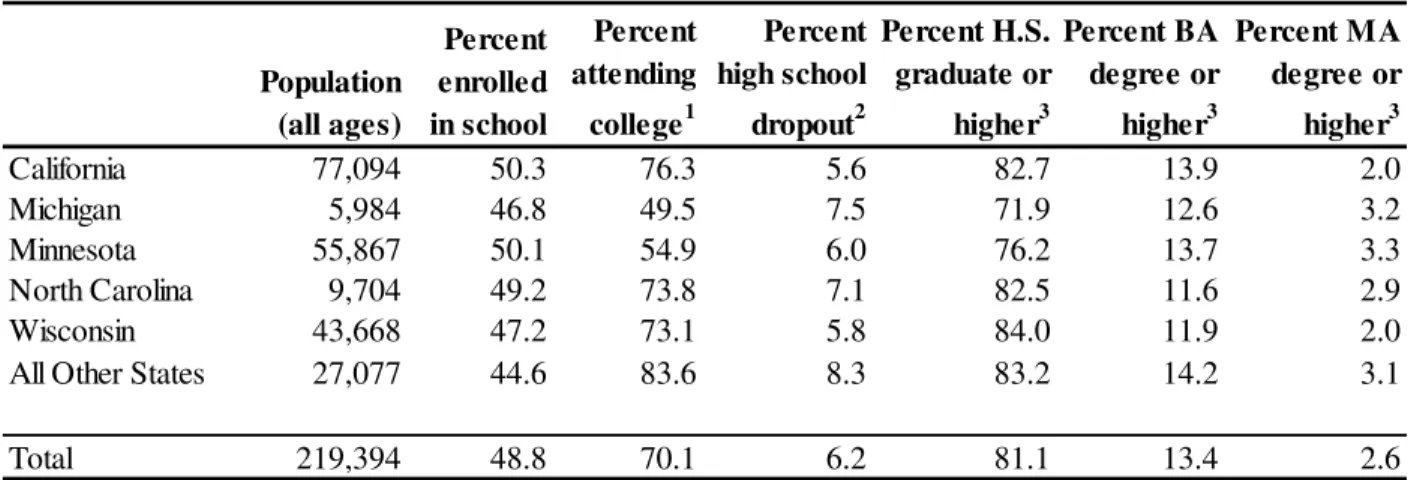
Table 1 provides information about the school attendance, high school dropouts, and
average educational attainment among several Hmong American age cohorts across five U.S.
states with the largest Hmong American populations. During the 2006-2010 period less than half
of Hmong Americans aged 3 or older were enrolled in school. Of those enrolled in school, about
94.7 percent were enrolled in public schools or colleges while only 5.3 percent were enrolled in
8
There are two major Hmong dialects commonly used in the United States: Mong Leng (lugMoob Leeg) and Hmong Der (lus Hmoob Dawb). These are also known as Green Hmong and White Hmong dialects, respectively.
2.6 4.6
7.9 23.4
79.9
21.3 37.2
49.1 41.2
11.4
76.1 58.2
42.9 35.4
8.7
1990 (Hmong) 2000 (Hmong) 2006-10 (Hmong) 2006-10 (Asian Americans) 2006-10 (Entire U.S.)
Figure 1: Percent Distribution of Language Spoken at
Home and English Ability by Selected Populations
and Year
Only English at Home
Non-English at Home, English spoken "very well" Non-English at Home, English spoken less than "very well"
5 and older
6
private schools or colleges (not shown).9 Among Hmong Americans aged 25 years or older, about 13 percent have obtained a bachelor’s degree or higher. However, less than three percent
of them have obtained a master’s degree or higher.
Table 1: Hmong’s Average School Enrollment and Educational Attainment by Selected States
There appears to be some differences between the Hmong Americans of different states
with respect to certain academic indicators. For instance, whereas 76.3 percent of Hmong 18 to
21 year-olds of California attended college, only 49.5 percent of Michigan’s Hmong population
of the same age cohort attended college. In terms of the proportion who have obtained a high
school diploma or higher degree, there is a difference of at least 10 percentage points between
the Hmong 25 years and older in Michigan and their counterparts in three other states (72 percent
compared to North Carolina’s and California’s 83 percent and Wisconsin’s 84 percent).
However, table 1 gives us only a snapshot and cannot tell us about changes in Hmong
9
Among those enrolled in private schools or colleges (5,249 persons), the average age was 19.3 years; 61.5 percent were enrolled in college as undergraduates; 67 percent are U.S. born citizens; 51.7 percent are females; and 77.2 percent are located in California, Minnesota, or Wisconsin.
Population (all ages)
Percent enrolled in school
Percent attending college1
Percent high school dropout2
Percent H.S. graduate or higher3
Percent BA degree or higher3
Percent MA degree or higher3
California 77,094 50.3 76.3 5.6 82.7 13.9 2.0
Michigan 5,984 46.8 49.5 7.5 71.9 12.6 3.2
Minnesota 55,867 50.1 54.9 6.0 76.2 13.7 3.3
North Carolina 9,704 49.2 73.8 7.1 82.5 11.6 2.9
Wisconsin 43,668 47.2 73.1 5.8 84.0 11.9 2.0
All Other States 27,077 44.6 83.6 8.3 83.2 14.2 3.1
Total 219,394 48.8 70.1 6.2 81.1 13.4 2.6
1
Among persons 18 to 21 years old. 2
Among persons 14 to 24 years old not enrolled in school and who have not graduated from high school or received a diploma.
3
Among persons 25 years or older.
7
Americans’ average school attendance or average educational attainment. For that, we turn to
data across multiple years.
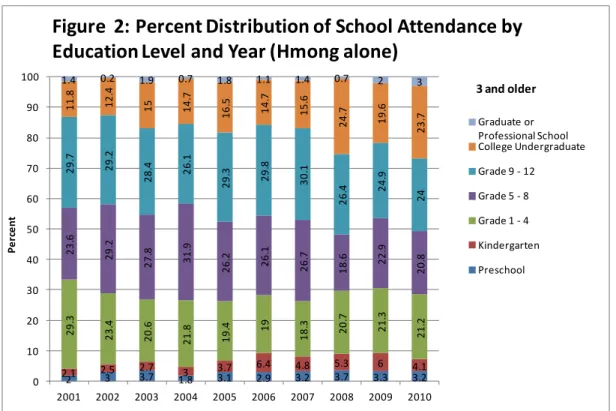
General Trends in School Attendance
Between 2001 and 2010, the proportion of Hmong college undergraduates as well as the
proportion of Hmong graduate or professional students has doubled. Specifically, the proportion
of Hmong Americans aged 3 or older who reported attending college or above increased from
13.2 percent to 26.7 percent (see figure 2). During the same interim, the proportion of Hmong
Americans who attended preschool or kindergarten increased from about four percent to over
seven percent. Accompanying these trends is the shrinkage in the proportion attending grades
one through 12.
2 3 3.7 1.8 3.1 2.9 3.2 3.7 3.3 3.2 2.1 2.5 2.7 3 3.7 6.4 4.8 5.3 6 4.1
2 9 .3 2 3 .4 2 0 .6 2 1 .8 1 9 .4 19 1 8 .3 2 0 .7 2 1 .3 2 1 .2 2 3 .6 2 9 .2 2 7 .8 3 1 .9 2 6
.2 26.1
2
6
.7
1
8
.6 22
.9 2 0 .8 2 9 .7 2 9 .2 2 8
.4 26.1
2
9
.3 29.8
3
0
.1
2
6
.4 24
.9 24 1 1 .8 1 2 .4
15 14
.7 1 6 .5 1 4 .7 1 5 .6 2 4 .7 1 9 .6 2 3 .7
1.4 0.2 1.9 0.7 1.8 1.1 1.4 0.7 2 3
0 10 20 30 40 50 60 70 80 90 100
2001 2002 2003 2004 2005 2006 2007 2008 2009 2010
P
e
rc
e
nt
Figure 2: Percent Distribution of School Attendance by
Education Level and Year (Hmong alone)
Graduate or Professional School College Undergraduate Grade 9 - 12 Grade 5 - 8 Grade 1 - 4 Kindergarten Preschool
Source: U.S. Census Bureau, American Community Survey Single-Year Datasets, Years 2001 to 2010.
8
Moreover, there appears to be a difference between Hmong males and Hmong females in
terms of attendance at higher education institutions. Using the single-year ACS 2010 PUMS, I
found, for instance, that whereas 29.9 percent of Hmong American females 3 years and older
reported attending college, graduate or professional school, only about 23.4 percent of Hmong
American males reported doing so. If the sample is limited to those between 18 and 24 years of
age, then 80.3 percent of Hmong females attended college or beyond compared to 78.2 percent
of Hmong males who did so (not shown).
General Trends in High School Dropouts
Following conventions of the U.S. Census Bureau (2011:176), I define a high school
dropout as any person of a given cohort who was not enrolled in regular school during the three
months prior to the ACS data collection and who had not completed high school or received a
high school or equivalent degree. In general, the older the age of a cohort, the greater is its
proportion of high school dropouts. For example, in 2010, only three percent of Hmong males
aged 16 to 17 years were high school dropouts. In contrast, 10.5 percent of Hmong males aged
18 to 21 and 15.7 percent of those aged 22 to 24 years old were high school dropouts.
Figure 3 shows the percent distribution of high school dropouts among Hmong American
males and females of two different age cohorts between 2001 and 2010. In general, for both of
the cohorts shown, the proportion of high school dropouts has declined over time. But the cohort
between 18 and 21 years of age experienced steeper declines and increases compared to the
cohort between 14 to 24 years of age. From 2002 to 2006, the proportion of high school
dropouts among Hmong males aged 14 to 24 years declined from 15.7 percent to 5.2 percent.
During the same period, the proportion of high school dropouts among Hmong females aged 14
to 24 remained relatively stable and never rose above 5.4 percent. However, between 2004 and
9
to 5.9 percent. Similarly, between 2006 and 2010, Hmong males’ proportion of high school
dropouts increased from 5.2 percent to 8.9 percent.10
General Trends in Educational Attainment
In 2010, Hmong persons aged 25 years or older comprised 38.5 percent (93,800) of the
Hmong American population. The census data indicate that the members of this cohort
experienced significant improvements in their average educational attainment between 1990 and
2010. Specifically, the proportion of Hmong Americans 25 years and older who possess a
bachelor’s degree or higher rose from just 4.9 percent in 1990 to 7.4 percent in 2000. By the end
of 2010, this figure nearly doubled to 14.5 percent.11 This three-fold increase within the span of
10
For comparison, data from the Current Population Survey show that the percentage of high school dropouts among the U.S. population of 14 to 24 year-olds were as follows: 10.1 percent dropped out in 1990, 9.1 percent dropped out in 2000, and 7.0 percent dropped out in 2009. Source: U.S. Census Bureau (2011:176), Table 272. 11
Sources: Census 1990, 1990 Census of Population: Asians and Pacific Islanders in the United States CP-3-5; Census 2000 SF 4 from the American Fact Finder; and American Community Survey 2010 PUMS.
7.9
15.7
12.2
10.5
8.8
5.2 6.0
7.8
6.8
8.9
5.7
4.2 4.9
2.1
5.2 5.4
8.1
6.5
5.1 5.9
0.0 5.0 10.0 15.0 20.0 25.0 30.0
2001 2002 2003 2004 2005 2006 2007 2008 2009 2010
P
e
rc
e
nt
Male (14 to 24 years)
Male (18 to 21 years)
Female (14 to 24 years)
Female (18 to 21 years)
Source: U.S. Census Bureau, American Community Survey Single-Year Datasets, Years 2001 to 2010.
Figure 3: Trends in High School Dropouts by Sex,
10
20 years is remarkable considering that, throughout the 1970s, 1980s and 1990s, the vast
majority of Hmong refugees arrived in the U.S. with less than a high school education.12 However, without disaggregating the data further, it is impossible to tell the extent to
which males and females differ in terms of educational attainment and whether or not these
differences have changed over time. The information in figure 4 attempts to fill this gap by
showing the percent distribution of educational attainment among Hmong Americans aged 25
years or older by sex and year. The line graphs compare Hmong males and Hmong females on
three indicators of educational attainment: the proportion with high school degree or higher (blue
lines); the proportion with associate’s degree or higher (red lines); and the proportion with
bachelor’s degree or higher (green lines).
12
For comparison, the ACS 2006-2010 PUMS shows that 30.9 percent of non-Hispanic whites of 25 years and older possess bachelor’s degrees or higher.
7.0 10.1
24.1
18.5 16.8
14.4 15.8 16.3
11.8 16.1
12.0 14.1
3.0 4.7
9.5 7.8
7.3 10.7 7.8 9.2 10.0 7.0
14.9 15.1
0.0 10.0 20.0 30.0 40.0 50.0 60.0 70.0 80.0
1990 2000 2001 2002 2003 2004 2005 2006 2007 2008 2009 2010
P
e
rc
e
nt
Figure 4. Trends in Educational Attainment by Sex,
Education Level, and Year (Hmong alone)
Male, HS grad +
Female, HS grad +
Male, AA degree +
Female, AA degree +
Male, BA degree +
Female, BA degree +
Source: U.S. Census Bureau, Census 1990 Sample Data; Census 2000, Summary File 4, 100 Percent; American Community Survey Single-Year Datasets 2001 through 2010 Weighted Samples.
11
In 1990, only 44.1 percent of Hmong males aged 25 years or older had obtained a high
school degree or higher. However, by 2000, 53.1 percent of them had done so. Ten years after
that, 69.8 percent of Hmong males had completed a high school degree or higher. The
proportion of Hmong males with an associate’s degree or higher remained about the same
between 2002 and 2008 but experienced a small decline during 2009-2010. The proportion of
Hmong males with a bachelor’s degree or higher increased from seven percent in 1990 to 10.1
percent in 2000 and then to 14.1 percent in 2010.
Historically, the gap between Hmong women’s and Hmong men’s average educational
attainment has been great. For instance, in 1990, only 19 percent of Hmong women had
obtained a high school diploma or higher degree as compared to 44 percent of Hmong men who
had done so. Therefore it is especially significant that in the last few years Hmong females have
gradually caught up to their male counterparts in terms of average educational attainment.
Whereas in 1990 only three percent of Hmong females (compared to seven percent of men) had
completed a bachelor’s degree or higher, by 2010, 15.1 percent of them had done so (compared
to 14 percent of men). In terms of the proportion with an associate’s degree or higher, Hmong
females caught up to Hmong males in 2009 and, by 2010, surpassed them by four percentage
points. However, in 2010, Hmong females still lag behind Hmong males by about six percentage
points in terms of the proportion with a high school degree or higher (63.5 compared to 69.8
percent). But if Hmong women’s rate of high school dropouts continue to decline and their
attendance in college continue to increase, it is likely that Hmong women as a group will catch
up to Hmong men on this indicator in the coming years.
Discussion
Research from the last twenty years has documented the various, complex social,
12
at multiple education levels (Bliatout, Downing, Lewis, and Yang 1988; Rumbaut and Ima 1988;
Trueba, Jacobs, and Kirton 1990; Root, Rudawski, Taylor, and Rochon 2003; Vang 2004; Yang
2004; Ngo and Lee 2007; Lee 2009). These complex ongoing challenges and Hmong American
students’ persistent disadvantages must be kept in mind as we discuss Hmong’s recent education
trends and their possible implications.
First, as indicated above, the proportion of Hmong Americans who are probably “fluent
English speakers”13 more than doubled between 1990 and 2010 (from 24 to 57 percent). Additionally, among Hmong school-age children, the proportion that probably speaks English
fluently has reached 72 percent. In general, this is a good sign because English is an essential
skill in schools and in most workplaces. Outside of schools and the workplace, we know from
past studies that verbal English skills help to facilitate Hmong’s social adaptation and
acculturation in general (Westermeyer and Her 1996).
We have reasons to be very concerned, however. Nationally and across several states,
students of Hmong language background, most of whom are U.S.-born, continue to be
over-represented as English Learners in the K through 12 public schools. During the 2000-01 school
year, about 70,800 Hmong American students were classified as English Learners throughout the
U.S., making them the third largest English Learners or limited English proficient (LEP) group
13
As mentioned earlier in this paper, I am defining this category to include both those respondents who reported speaking English “very well” and those who reported speaking only English at home. I am aware that self-reported ability may differ significantly from actual or measured “ability.” The assumption that self-reported English ability represents probable English ability is similar tothe assumption implicit in California’s policy of surveying and
13
in the country (Kindler 2002:21). This means that about 42 percent of the entire Hmong
American population, as enumerated in the 2000 census, was classified as English Learners!14 From 1995 through the end of the 2004-2005 school year, English Learners of Hmong
background consistently comprised the third largest EL student group in California’s public
schools. Since 2006, Hmong EL students have remained the fifth largest EL group in
California.15 During the 2010-11 school year, about 58 percent of Hmong-language minority students throughout the state’s K-12 public schools were classified (and likely still are classified)
as English Learners based primarily on their scores on the California English Language
Development Test (CELDT). Only 42 percent of them were classified as
fluent-English-proficient.16 But the problem of Hmong students’ over representation as English Learners is not limited to California.
During the 2000-01 academic year, Hmong language minority students comprised the
fifth largest EL student group in Oregon; the fourth largest EL group in Michigan and South
Carolina; the second largest EL group in North Carolina and Wisconsin; and the largest EL
group in Minnesota (Kindler 2002:21-2). Indeed, Hmong students have been in these socially
and politically constructed categories for many years now. For instance, since March 1999,
English Learners of Hmong language background have remained the second largest English
14
For comparison: Although Hmong EL students made up 42 percent of the Hmong American population,
Vietnamese EL students made up only 8 percent of the Vietnamese American population. Khmer EL students made up 16 percent of Cambodian Americans and Lao EL students made up 9 percent of Laotian Americans.
15
Source: California Department of Education, Educational Demographics Office, DataQuest, “Statewide English Learners by Language and Grade,” data from multiple years. Retrieved January 5, 2012, from:
http://dq.cde.ca.gov/dataquest/ 16
14
Learners group in Wisconsin’s public schools.17 We urgently need more in-depth and
comparative research to help uncover and clarify the social mechanisms as well as institutional
policies that produce, maintain, and/or perpetuate this condition of educational inequity (the
over-representation of Hmong students as EL students).
In spite of these persistent problems, Hmong Americans have made important
educational progress. The census data indicate that Hmong Americans’ average college
attendance as well as their average educational attainment has improved since the early 2000s.
That the proportion of Hmong college undergraduates as well as the proportion of Hmong
graduate or professional students has doubled since 2001 is a sign of significant progress. It is a
remarkable achievement considering Hmong Americans’ historical disadvantages and, in many
cases, concentrated poverty in the U.S. As significant numbers of Hmong Americans graduate
from college and go on to pursue advanced degrees, we can expect that the group’s average
educational attainment will also increase.
Nevertheless, Hmong’s educational progress needs to be understood within a broader
context. First, it is important to specify the group or groups to which Hmong Americans are
being compared so that we have a better idea of how well Hmong are doing relative to other
subgroups in American society. Once we start to do so, we can see that Hmong Americans still
lag behind many other ethnic/racial categories in terms of average educational attainment.
According to the ACS 2010, whereas only 14.5 percent of Hmong Americans aged 25 and older
have attained bachelor degrees or higher, 31.4 percent of non-Hispanic whites, 18 percent of
non-Hispanic blacks, 13.1 percent of Hispanics,and 50.2 percent of non-Hispanic Asians aged
25 and older have attained bachelor degrees or higher.
17Source: Wisconsin Department of Public Instruction, “Census of Limited
15
Secondly, aggregate figures tend to hide the diversity and variation in terms of education
outcomes across and within Hmong communities. As suggested by table 1 above, Hmong
residents of different states do not all experience the same educational outcomes. Different
contexts could produce very different educational challenges and demand different strategies for
ameliorating problems. Even though most states are under pressure to comply with federal
policies such as the No Child Left Behind Act of 2001, states and within states, school districts
and schools do not all implement the same education policies or implement policies in the same
way. Although this paper has highlighted differences in educational attainment according to sex
and age, Hmong American society or, rather, societies contain a great deal more analytical
categories than these. For instance, disaggregating the ACS 2006-10 data further reveals that
foreign-born Hmong aged 25 years or older lag behind their U.S.-born counterparts in terms of
the percent with a bachelor’s degree or higher (12.5 percent compared to 17.4 percent).18 Finally, Hmong Americans’ educational progress will continue to depend in large parts
on high school students’ opportunity to pursue higher education and on college students’ ability
to graduate from colleges/universities and pursue advanced careers. Elsewhere, I have suggested
that whether or not a student eventually has the opportunity to pursue higher education may be
circumscribed, if not determined, from very early on in his or her academic career (Xiong 2010).
In order to compete for admission to higher education institutions, a student, years before he/she
even graduates from high school, needs to enter into the “right” academic track, where he/she
can take the set of college preparatory courses needed to minimally qualify for admission (Xiong
2010). This is especially relevant if a student wants to be able to attend a more highly selective
college or university.
18
16
Although researchers and policy makers should continue to pay attention to all levels of
the educational system, more focused attention is needed at the kindergarten to 12th grade levels. Researchers should continue to systematically investigate how practices such as English
language testing in K-12 schools affect language minority students’ opportunities to advance
beyond high school and what can be done to increase their opportunities. It is at these levels that
active academic outreach programs could have a decisive impact on students’ later academic
opportunities. Academic outreach programs such as the Federal TRIO Programs19 could help to reduce the negative effects of years of disadvantage (e.g., being low-income, being tracked in
remedial tracks, being left out in the dark about college entrance requirements, etc.), by
providing students with supplemental, rigorous education, academic guidance, and resources.
Conclusion
Recent U.S. census data reveal significant improvements in Hmong Americans’ English
language ability, attendance at higher levels of education, and higher educational completion.
The data also show that there are differences between states, between age cohorts, and between
males and females with respect to certain educational outcomes. Finally, in the last few years,
the gap between Hmong females and males in terms of educational attainment and in terms of
high school dropouts has narrowed considerably. However, significant challenges remain. One
of these challenges is Hmong students’ persistent over-representation as English Learners in the
K-12 public schools across several states.
19
17
References Cited
Bliatout, Bruce Thowpaou, Bruce T. Downing, Judy Lewis, and Dao Yang. 1988. Handbook for
Teaching Hmong-Speaking Students. Folsom, CA: Southeast Asian Community
Resources Center, Folsom Cordova Unified School District.
Kindler, Anneka L., 2002. Survey of the States' Limited English Proficient Students and
Available Educational Programs and Services, 2000-2001 Summary Report, U.S.
Department of Education, Office of English Language Acquisition, and Language Enhancement and Academic Achievement for Limited English Proficient Students. Washington, D.C.: National Clearinghouse for English Language Acquisition & Language Instruction Educational Programs.
Lee, Stacey J. 2009. "The Road to College: Hmong American Women's Pursuit of Higher Education." Harvard Education Review 67(4):803-828.
Ngo, Bic and Stacey J. Lee. 2007. "Complicating the Image of Model Minority Success: A Review of Southeast Asian American Education." Review of Educational Research 77(4):415-453.
Root, Steven, Anthony Rudawski, Matthew Taylor, and Ronald Rochon. 2003. "Attrition of Hmong Students in Teacher Education Programs." Bilingual Research Journal: The
Journal of the National Association for Bilingual Education 27(1):137-148.
Rumbaut, Rubén G. and Kenji Ima. 1988. The Adaptation of Southeast Asian Refugee Youth: A
Comparative Study. Washington, D.C.: U.S. Office of Refugee Resettlement.
Trueba, Enrique T., Lila Jacobs, and Elizabeth Kirton. 1990. Cultural Conflict and Adaptation :
The Case of Hmong Children in American Society. New York: Falmer Press.
U.S. Bureau of the Census, 1993. 1990 Census of Population: Asians and Pacific Islanders in
the United States, CP-3-5, U.S. Department of Commerce and U.S. Bureau of the
Census. Washington, D.C.: U.S. Government Printing Office.
—, 2011. Statistical Abstract of the United States: 2012 (131st Edition), U.S. Department of Commerce and U.S. Bureau of the Census. Washington, D.C.: U.S. Government Printing Office.
Vang, Christopher. 2004. "Hmong American K-12 Students and the Academic Skills Needed for a College Education: A Review of the Existing Literature and Suggestions for Future Research." Hmong Studies Journal 5:1-31.
Westermeyer, Joseph and Cheng Her. 1996. "English Fluency and Social Adjustment among Hmong Refugees in Minnesota." Journal of Nervous and Mental Disease 184(2):130-2.
18
Yang, Kaying. 2004. "Southeast Asian American Children: Not the 'Model Minority'." Children
of Immigrant Families 14(2).
About the Author:
Yang S. Xiong is a PhD candidate in the Department of Sociology at UCLA. His primary research focuses on the political participation and incorporation of Hmong Americans in several U.S. states. His other research interests include the study of state education policies and
institutional practices that affect the opportunities and trajectories of English Learners in public schools. Recently, he co-authored, “The Prevalence of English Monolingualism and Its
Association with Generational Status among Hmong Americans, 2005-2009” with Nao Xiong in