• Nenhum resultado encontrado

Simulation of black carbon in snow and its climate impact in the Canadian Global Climate Model

N/A
N/A
Protected

Academic year: 2017

Share "Simulation of black carbon in snow and its climate impact in the Canadian Global Climate Model"

Copied!
44
0
0

Texto

(1)

ACPD

15, 18839–18882, 2015

Simulation of black carbon in snow and its climate impact in the Canadian Global

Climate Model

M. Namazi et al.

Title Page

Abstract Introduction

Conclusions References

Tables Figures

◭ ◮

◭ ◮

Back Close

Full Screen / Esc

Printer-friendly Version

Interactive Discussion

Discussion

P

a

per

|

Discussion

P

a

per

|

Discussion

P

a

per

|

Discussion

P

a

per

|

Atmos. Chem. Phys. Discuss., 15, 18839–18882, 2015 www.atmos-chem-phys-discuss.net/15/18839/2015/ doi:10.5194/acpd-15-18839-2015

© Author(s) 2015. CC Attribution 3.0 License.

This discussion paper is/has been under review for the journal Atmospheric Chemistry and Physics (ACP). Please refer to the corresponding final paper in ACP if available.

Simulation of black carbon in snow and

its climate impact in the Canadian Global

Climate Model

M. Namazi, K. von Salzen, and J. N. S. Cole

Canadian Centre for Climate Modelling and Analysis, Environment Canada, Victoria, British Columbia, Canada

Received: 25 May 2015 – Accepted: 16 June 2015 – Published: 09 July 2015

Correspondence to: K. von Salzen (knut.vonsalzen@ec.gc.ca)

(2)

ACPD

15, 18839–18882, 2015

Simulation of black carbon in snow and its climate impact in the Canadian Global

Climate Model

M. Namazi et al.

Title Page

Abstract Introduction

Conclusions References

Tables Figures

◭ ◮

◭ ◮

Back Close

Full Screen / Esc

Printer-friendly Version

Interactive Discussion

Discussion

P

a

per

|

Discussion

P

a

per

|

Discussion

P

a

per

|

Discussion

P

a

per

|

Abstract

A new physically-based parameterization of black carbon (BC) in snow was developed and implemented in the Canadian Atmospheric Global Climate Model (CanAM4.2). Simulated BC snow mixing ratios and BC snow radiative forcings are in good agree-ment with measureagree-ments and results from other models. Simulations with the improved

5

model yield considerable trends in regional BC concentrations in snow and BC snow radiative forcings during the time period from 1950–1959 to 2000–2009. Increases in radiative forcings for Asia and decreases for Europe and North America are found to be associated with changes in BC emissions. Additional sensitivity simulations were performed in order to study the impact of BC emission changes between 1950–1959

10

and 2000–2009 on surface albedo, snow cover fraction, and surface air temperature. Results from these simulations indicate that impacts of BC emission changes on snow albedos between these two decades are small and not significant. Overall, changes in BC concentrations in snow have much smaller impacts on the cryosphere than the net warming surface air temperatures during the second half of the 20th century.

15

1 Introduction

Snow plays an important role in the land surface radiation budget and therefore climate. Snow albedo can be strongly reduced by absorbing aerosols such as black carbon (BC), brown organic carbon, or dust which have been deposited on the snow through dry and wet deposition and cause warming of the snowpack (Warren and Wiscombe,

20

1980, 1985; Hansen and Nazarenko, 2004; Hadley and Kirchstetter, 2012).

BC is produced by incomplete combustion of fossil and biomass fuels and is emitted into the atmosphere from a wide range of natural and anthropogenic sources. Total emissions of BC from fossil fuel and biofuel combustion have increased strongly from 1850 to 2000 (Bond et al., 2007; Skeie et al., 2011). In addition to effects on snow

(3)

ACPD

15, 18839–18882, 2015

Simulation of black carbon in snow and its climate impact in the Canadian Global

Climate Model

M. Namazi et al.

Title Page

Abstract Introduction

Conclusions References

Tables Figures

◭ ◮

◭ ◮

Back Close

Full Screen / Esc

Printer-friendly Version

Interactive Discussion

Discussion

P

a

per

|

Discussion

P

a

per

|

Discussion

P

a

per

|

Discussion

P

a

per

|

albedo, BC can affect Earth’s climate through direct radiative, semi-direct and indirect (cloud) effects.

An initial albedo reduction by BC in snow can be amplified by positive feedbacks involving snow processes, for example:

i. a warmer snowpack causes increases in snow grain effective radius (Flanner and

5

Zender, 2006) which thereby causes further reductions in snow albedo,

ii. larger snow grain sizes in a warm snowpack leads to a stronger BC snow radiative forcing (Warren and Wiscombe, 1980; Hadley and Kirchstetter, 2012),

iii. BC tends to become more highly concentrated near the surface of the snowpack when snow melts (Clarke and Noone, 1985; Doherty et al., 2010), and

10

iv. an earlier snow melt onset may cause an earlier exposure of a darker underlying surface.

Different models have been used to simulate impacts of BC on snow and climate. Hansen and Nazarenko (2004) used the few available measurements of BC in snow at that time to determine snow albedo changes in the Arctic, Antarctica, Greenland, and

15

other regions in the Northern Hemisphere. These albedo change estimates were used to calculate the radiative forcing (RF) and climate response. Jacobson (2004a) esti-mated BC concentrations in snow prognostically and used them to calculate the change in albedo and RF. More recently, Flanner et al. (2007, 2009), Koch et al. (2009b), Ryp-dal et al. (2009b), Skeie et al. (2011), and Jiao et al. (2014) used prognostic modelling

20

methods to simulate BC in snow and interactions with climate.

Flanner et al. (2007) investigated impacts of BC in snow on snow radiative and mi-crophysical processes. They performed simulations for strong and weak boreal fire years and suggested that both BC emissions and the treatment of snow aging repre-sent large sources of uncertainty in the simulations of BC in snow. In a recent study

25

(4)

ACPD

15, 18839–18882, 2015

Simulation of black carbon in snow and its climate impact in the Canadian Global

Climate Model

M. Namazi et al.

Title Page

Abstract Introduction

Conclusions References

Tables Figures

◭ ◮

◭ ◮

Back Close

Full Screen / Esc

Printer-friendly Version

Interactive Discussion

Discussion

P

a

per

|

Discussion

P

a

per

|

Discussion

P

a

per

|

Discussion

P

a

per

|

snow. The analysis reveals that these processes are more important for differences in simulated BC concentrations in snow than differences in snow melt water scavenging rates or emissions in models.

Widespread surface melting of the Greenland ice sheet in 1889 and 2012 was re-cently attributed to warm temperatures combined with reductions in surface albedo

5

resulting from deposition of black carbon from Northern Hemisphere forest fires (Kee-gan et al., 2014). On the other hand, the extent to which absorption of visible radiation by BC in snow might have contributed to rapid warming of the mid to high latitude land surface and decline in Eurasian springtime snow cover (Déry and Brown, 2007) is presently unknown. Studies of BC in snow are complicated by the fact that

anthro-10

pogenic emissions of BC are non-uniform in space and time, compounded by large variations in atmospheric transport of BC at high latitudes (Stohl et al., 2006). In addi-tion, there is large inter-annual variability in vegetation fire emissions of BC. Variations in total BC emissions are also compounded by changes in snow cover extent (SCE) and depth owing to variations in temperatures and snowfall. Consequently,

concen-15

trations of BC in snow are highly variable and climate effects are difficult to quantify robustly.

Some of the recent studies focused on RFs during individual years (Flanner et al., 2007, 2009) while Hansen et al. (2007a), Koch et al. (2009a, 2011), and Skeie et al. (2011) analyzed differences between pre-industrial and present-day processes and

cli-20

mate. Some of the studies produced evidence for potentially large impacts of BC in snow on radiative forcings and climate. For instance, Flanner et al. (2009) concluded that fossil fuel and biofuel emissions of BC induce a large springtime snow cover loss over Eurasia as a consequence of strong snow-albedo feedbacks and large BC emis-sions from Asia, with a magnitude similar to impacts of anthropogenic carbon dioxide

25

(5)

ACPD

15, 18839–18882, 2015

Simulation of black carbon in snow and its climate impact in the Canadian Global

Climate Model

M. Namazi et al.

Title Page

Abstract Introduction

Conclusions References

Tables Figures

◭ ◮

◭ ◮

Back Close

Full Screen / Esc

Printer-friendly Version

Interactive Discussion

Discussion

P

a

per

|

Discussion

P

a

per

|

Discussion

P

a

per

|

Discussion

P

a

per

|

small impacts of BC on snow and ice during the twentieth century. In a related study, Holland et al. (2012) concluded that the deposition and cycling of aerosols in sea ice cause the sea ice to melt and may therefore play a role in late-twentieth-century Arctic sea ice trends. On the other hand, Goldenson et al. (2012) found that deposition of aerosols have small impacts on Arctic sea ice and climate.

5

The purpose of this work is to study impacts of BC emissions on cryospheric and climate processes in a recent version of the Canadian Atmospheric Global Climate Model (CanAM4.2). We apply a physically based parameterization of the snow albedo in combination with new parameterizations for BC concentrations in snow and effective radius of snow grains, which are described in Sect. 2. Simulations of BC in snow, RFs

10

of BC in snow, and changes in snow cover fraction (SCF) and surface air temperatures from 1950s to 2009s are discussed in Sect. 3.

2 Modelling approach

An interactive model treatment of BC emissions, transport, and deposition is required in order to simulate the RF of BC in snow and feedbacks between aerosol, snow physical

15

processes, and climate. The Canadian Atmospheric Global Climate Model (CanAM4.2) is similar to the earlier version CanAM4 (von Salzen et al., 2013) but uses version 3.6 of the Canadian Land Surface Scheme (CLASS) to model the energy and water balances of the soil, snow, and vegetation canopy components (Verseghy, 2012). Relative to CanAM4, there are many improvements to the simulation of snow. These include new

20

formulations for vegetation interception of snow (Bartlett et al., 2006), for unloading of snow from vegetation (Hedstrom and Pomeroy, 1998), for the albedo of snow-covered canopies (Bartlett and Verseghy, 2015), for the limiting snow density as a function of depth (Tabler et al., 1997; Brown et al., 2006), and finally for the thermal conductivity of snow (Sturm et al., 1997). Water retention in snowpacks has also been incorporated.

25

(6)

ACPD

15, 18839–18882, 2015

Simulation of black carbon in snow and its climate impact in the Canadian Global

Climate Model

M. Namazi et al.

Title Page

Abstract Introduction

Conclusions References

Tables Figures

◭ ◮

◭ ◮

Back Close

Full Screen / Esc

Printer-friendly Version

Interactive Discussion

Discussion

P

a

per

|

Discussion

P

a

per

|

Discussion

P

a

per

|

Discussion

P

a

per

|

Peng et al., 2012), a higher vertical resolution in the upper troposphere, a reduced solar constant (1361 W m−2) and an improved treatment of the solar continuum used in the radiative transfer. However, the model retains the same T63 spectral resolution, with 49 vertical levels.

Different types of natural and anthropogenic aerosols are considered, including

sul-5

fate, black and organic carbon, sea salt, and mineral dust. Parameterizations for emis-sions, transport, gas-phase and aqueous-phase chemistry, and dry and wet deposition account for interactions with simulated meteorological variables for each individual grid point and time step. Hydrophobic and hydrophilic black and organic carbon aerosol are considered, with a specified lifetime, representing aerosol aging processes of

hy-10

drophobic carbonaceous aerosols (Croft et al., 2005). Fluxes and properties of the air (downwelling longwave and shortwave radiation, precipitation, air pressure and tem-perature, specific humidity and wind speed) are passed to CLASS which in turn com-putes the density, liquid water content, mass and temperature of a single layer of snow at each time step. The snow albedo calculation in CLASS does not explicitly account

15

for snow metamorphism nor albedo reductions by BC which requires addition of new parameterizations (Sect. 2.1).

2.1 Radiative and snow microphysical processes

A parameterization for snow albedo which accounts for contributions of BC-snow mix-ing ratio and the effective snow grain size was developed (Cole et al., 2015). For the

20

sake of completeness the approach is described in brief. Lookup tables for snow albedo and transmission are used, which are functions of snow water equivalent, underlying surface albedo, solar zenith angle, snow grain size and BC concentration. These tables are created for incident radiation that is purely direct beam or diffuse and for each radia-tion band in the CanAM4.2 radiative transfer model. Table contents are computed using

25

(7)

ACPD

15, 18839–18882, 2015

Simulation of black carbon in snow and its climate impact in the Canadian Global

Climate Model

M. Namazi et al.

Title Page

Abstract Introduction

Conclusions References

Tables Figures

◭ ◮

◭ ◮

Back Close

Full Screen / Esc

Printer-friendly Version

Interactive Discussion

Discussion

P

a

per

|

Discussion

P

a

per

|

Discussion

P

a

per

|

Discussion

P

a

per

|

either incident direct or diffuse radiation. For each of the calculations the optical prop-erties of snow and BC are computed using Mie calculations. The size distribution and refractive indices for BC are taken to to be that in Bäumer et al. (2007) to maintain consistency between the atmosphere and snow radiative effects.

The response of snow albedo to the presence of BC, relative to pristine snow, is

5

shown in Fig. 1 for a semi-infinite snow layer in which BC is externally mixed and illumi-nated by direct beam radiation at a 60◦ zenith angle. For comparison, we show results from the Snow, Ice, and Aerosol Radiation (SNICAR) model (Flanner et al., 2007, 2009) using the same configuration. It is clear that the Cole et al. (2015) snow albedo model produces an albedo response to BC in snow that is roughly 25 % less than SNICAR

10

for all BC concentrations and snow grain sizes. This can be largely attributed to the choice of BC optical properties. In SNICAR the mass absorption coefficient at 550 nm is 7.5 m2g−1, following recommendations by Bond and Bergstrom (2006), while the parameterization of Bäumer et al. (2007) produces a mass absorption coefficient of 4.9 m2g−1 at 550 nm. Recreating the lookup tables in Cole et al. (2015) with BC

re-15

fractive indices that are consistent with SNICAR (Flanner et al., 2012) result in similar albedo responses due to BC in snow (not shown).

We consider snow over bare ground as well as on continental ice sheets and sea-ice for the development of new parameterizations for snow grain sizes and BC concen-trations in snow. The existing parameterizations for snow in CLASS (3.6) are used to

20

simulate properties of a single layer of snow with variable depth. Since vertical pro-files of snow physical properties are not resolved in CLASS and extinction of solar radiation mainly occurs near the surface of snow layers, parameterizations of snow microphysical processes need to account for unresolved processes in the snowpack. The Snow Model Intercomparison Project (SnowMIP) experiments have shown that

25

(8)

ACPD

15, 18839–18882, 2015

Simulation of black carbon in snow and its climate impact in the Canadian Global

Climate Model

M. Namazi et al.

Title Page

Abstract Introduction

Conclusions References

Tables Figures

◭ ◮

◭ ◮

Back Close

Full Screen / Esc

Printer-friendly Version

Interactive Discussion

Discussion

P

a

per

|

Discussion

P

a

per

|

Discussion

P

a

per

|

Discussion

P

a

per

|

2.1.1 Snow metamorphism

Snow grain size influences the snow albedo and thermal conductivity as well as chem-ical interaction between snow and atmosphere (Domine et al., 2008). It generally in-creases over time as the snowpack ages and therefore causes reductions in snow albedo, especially in the near infrared (Wiscombe and Warren, 1980). The visible

5

albedo, however, depends more strongly on concentrations of snow impurities such as black carbon (BC) and mineral dust (Warren and Wiscombe, 1980). Larger snow grains amplify the rate of snow albedo reduction by BC in snow (Hadley and Kirchstet-ter, 2012; Aoki et al., 2011). This is because of deeper radiation penetration in coarser snow grains (Warren and Wiscombe, 1980). In addition, the growth of snow grains

10

contributes to snow albedo feedbacks as the snowpack warms (Flanner and Zender, 2006). Therefore, an accurate model representation of snow grain sizes is potentially important for simulations of the effects of BC on climate.

Snow with non-spherical complex particles can be represented as a collection of spheres, which conserves the volume to surface area ratio well (error less than 5 %)

15

(Grenfell and Warren, 1999; Grenfell et al., 2005). The effective radius,Re, the surface area-weighted mean radius of a collection of spherical particles, is given by

Re= 3

ρiS, (1)

whereρi =917 kg m−3 is the bulk ice density. The snow specific surface area (S) is

defined as the ratio of the surface area per unit mass of snow in m2kg−1, which defines

20

atmosphere-snow chemistry interactions and surface energy balance through snow albedo and turbulent fluxes.

The size of the snow grains depends on the macrophysical state of the snowpack which is determined by its temperature, type, density, and amount of liquid water. We consider three mechanisms for the temporal evolution of snow grain size in a layer at

25

(9)

ACPD

15, 18839–18882, 2015

Simulation of black carbon in snow and its climate impact in the Canadian Global

Climate Model

M. Namazi et al.

Title Page

Abstract Introduction

Conclusions References

Tables Figures

◭ ◮

◭ ◮

Back Close

Full Screen / Esc

Printer-friendly Version

Interactive Discussion

Discussion

P

a

per

|

Discussion

P

a

per

|

Discussion

P

a

per

|

Discussion

P

a

per

|

such as wind and sintering that can also affect snow grain size are not considered owing to a lack of available parameterizations and simplicity of the CLASS snow model. For dry aging of snow grains, we use a physically-based approach by Flanner and Zender (2006) which predicts the temporal evolution of Re (m), of dry snow due to water vapour transport in the snowpack, which is driven by differences in snow grain

5

curvature and temperature gradient. The calculation depends on snowpack tempera-ture, vertical temperature gradient, and snow density. It is formulated as

dRe

dt =

dRe

dt

0

τ

ReRe

0+τ 1κ

, (2)

where dRe

dt

0 (m s

−1

) is the initial rate of change of the effective radius, and τ and κ

are empirical parameters which account for the spatial distribution of grain sizes and

10

irregularity in grain spacing and are specified according to the original version of the parameterization.Re

0 is the effective radius of fresh snow and is set to 54.53 µm

cor-responding to SSA0=60 m2kg−1(Flanner et al., 2007) based on observational data of Legagneux et al. (2004).

The parameterization of wet aging accounts for the increase in snow grain size by

15

rounding due to presence of liquid water within the snowpack. This process is modeled using an empirical equation expressed in terms ofRe(µm),

dRe

dt =

1018C1fliq3

4πRe2 , (3)

based on experimental data, (Brun, 1989; Oleson et al., 2010). HereC1=4.22×10⁻¹³

andfliq is the mass liquid water fraction given by Wliq

Wliq+Wice whereWliq and Wice are the

20

(10)

ACPD

15, 18839–18882, 2015

Simulation of black carbon in snow and its climate impact in the Canadian Global

Climate Model

M. Namazi et al.

Title Page

Abstract Introduction

Conclusions References

Tables Figures

◭ ◮

◭ ◮

Back Close

Full Screen / Esc

Printer-friendly Version

Interactive Discussion

Discussion

P

a

per

|

Discussion

P

a

per

|

Discussion

P

a

per

|

Discussion

P

a

per

|

We parametrize the effects of snowfall on mean snow effective radius (m) in a shallow layer at the surface of the snowpack according to

dRe

dt =−

1

τd(Re−Re0), (4)

whereτd is an adjustment time scale which is given by

τd =ρszs

Fs (5)

5

forFs>0. Here,zs(m),ρs(kg m−3) andFs(kg m−2s−1) are instantaneous snow depth, density of snow layer, and snowfall flux, respectively. If there is no snowfall,Fs=0, then the effective radius remains constant. We usezs=25 cm as the maximum depth of the surface snow layer in parameterizations of snow grain size, corresponding to a typical depth of solar penetration in snow (France et al., 2011). If the depth of snowpack is

10

shallower than 5 cm, the effective radius is kept constant. We found a weak sensitivity of results to the assumed depth of the snow layer between 15 and 25 cm, which does not affect the conclusions presented in the following.

There are few field measurements for effective radius of snow with vertical profiles available which can be used to validate parameterizations for snow grain sizes. The

15

measurements which we use are from six locations and are summarized in Table 1. The averaged simulated effective radius corresponding to the location and month of the measurements is 0.29±0.18 mm. This is comparable to an averaged observed

effective radius of 0.22±0.11 mm.

2.1.2 BC concentration in snow

20

(11)

ACPD

15, 18839–18882, 2015

Simulation of black carbon in snow and its climate impact in the Canadian Global

Climate Model

M. Namazi et al.

Title Page

Abstract Introduction

Conclusions References

Tables Figures

◭ ◮

◭ ◮

Back Close

Full Screen / Esc

Printer-friendly Version

Interactive Discussion

Discussion

P

a

per

|

Discussion

P

a

per

|

Discussion

P

a

per

|

Discussion

P

a

per

|

is determined by accumulation rates of BC and snow through deposition processes. In addition, partial scavenging of BC by melting snow water will act to increase the BC concentration in the top layer. Processes such as the advection of BC and snow by wind or sea ice and effects of sublimation of snow on BC concentrations are not considered.

5

The parameterization has the following components:

BC deposition: the BC concentration (kg m−3) in the snow layer increases by BC deposition and decreases by snowfall. If changes in snow density are omitted and the layer depth (zs) is constant,

dC

dt = Fb zs

C Fs

ρszs, (6)

10

whereFb is the total black carbon deposition flux (kg m−2s−1), resulting from dry deposition, convective and large-scale wet deposition.

The BC snow mass budget can also be expressed as an adjustment of the con-centration towards an effective surface BC concentration,

dC

dt =−

1

τd(CC0), (7)

15

where the adjustment time scale (τd) is given by Eq. (5). The effective surface concentration (C0) is given byC0=ρsFb

Fs. If there is no snowfall, then the change

in BC concentration is given by limF

s→0

dC

dt =

Fb zs.

Scavenging: Snow meltwater can scavenge hydrophilic BC out of the snow layer. However, BC may accumulate near the surface during the melt as observed in

20

(12)

ACPD

15, 18839–18882, 2015

Simulation of black carbon in snow and its climate impact in the Canadian Global

Climate Model

M. Namazi et al.

Title Page

Abstract Introduction

Conclusions References

Tables Figures

◭ ◮

◭ ◮

Back Close

Full Screen / Esc

Printer-friendly Version

Interactive Discussion

Discussion

P

a

per

|

Discussion

P

a

per

|

Discussion

P

a

per

|

Discussion

P

a

per

|

process by assuming the BC concentration change in time to be proportional to the meltwater flux and concentration of BC in the snow surface layer,

dC

dt =(1−s) Fw

ρszsC. (8)

Here,Fw (kg m−2s−1) is the meltwater flux out of the snow layer and 0≤s≤1 is

the scavenging factor. For s=1, in case of a perfectly efficient scavenging effi

-5

ciency, the concentration of BC on top of the snow layer is not changed by melting of snow. In the other limiting case of s=0, BC is not removed by snow meltwa-ter and therefore tends to accumulate in the snow surface layer over time. We chooses=0.1 for which the simulated BC are in good agreement with measured BC (Doherty et al., 2010). Rypdal et al. (2009b) and Skeie et al. (2011) assume

10

that all BC remains at the snow surface as snow melts while Flanner et al. (2007, 2009) and Jiao et al. (2014) apply a scavenging efficiency of 0.2 for hydrophilic BC and 0.03 for hydrophobic BC, based on Conway et al. (1996). In contrast, Hansen et al. (2005) and Koch et al. (2009b) did not include any contribution of snow melt to BC snow concentrations.

15

2.2 Simulation setup

In order to investigate BC in snow and effects on cryospheric and climate processes, two simulations were performed from 1950–2009 with one year of model spin-up for 1949. In the control simulation (CTRL) snow aging and BC concentration in the snow are calculated prognostically using the parameterizations described in the previous

20

sections. A sensitivity experiment (EXP) based on the control simulation is performed by applying specified monthly climatological BC concentrations in snow rather than time varying prognostic values. The climatological BC concentrations in this simulation were obtained by temporal averaging of BC concentration in snow over the first decade of the control simulation, 1950–1959, for times when snow is present. Consequently,

(13)

ACPD

15, 18839–18882, 2015

Simulation of black carbon in snow and its climate impact in the Canadian Global

Climate Model

M. Namazi et al.

Title Page

Abstract Introduction

Conclusions References

Tables Figures

◭ ◮

◭ ◮

Back Close

Full Screen / Esc

Printer-friendly Version

Interactive Discussion

Discussion

P

a

per

|

Discussion

P

a

per

|

Discussion

P

a

per

|

Discussion

P

a

per

|

differences between the two simulations can be attributed to differences in simulated BC radiative forcing in snow evolving over time relative to the 1950s.

Simulations were performed following specifications outlined by Taylor et al. (2011). Monthly mean sea surface temperature (SST) and sea-ice boundary conditions were used for the model lower boundary (Hurrell et al., 2008). These are the same boundary

5

condition data that were required for the fifth Coupled Model Intercomparison Project CMIP5. Time-varying monthly averaged concentrations for CO2, CH4, O3, N2O, eff ec-tive CFC11 and CFC12 were those of the historical period used in the CMIP5 project and extended to 2010 using the Representative Concentration Pathway (RCP4.5) sce-nario (Moss et al., 2010).

10

Emissions of BC and other aerosol compounds were provided using a combination of linearly interpolated monthly emission fluxes from different data sets in an attempt to include the most recent improvements in newly available emission data sets. An-thropogenic emissions in 2005 and subsequent years were specified according to the Evaluating the Climate and Air Quality Impacts of Short-Lived Pollutants (ECLIPSE)

in-15

ventory, version 4a (Klimont et al., 2015a, b). Monthly varying emissions for forest and grass fires from GFED, version 3.1, were used for 1997 and subsequent years (van der Werf et al., 2010). Aircraft and shipping emissions and emissions before the first year of these data sets were taken from the CMIP5/RCP data base (Lamarque, 2010; Moss et al., 2010), with linear interpolation of the data sets in time between available start

20

and end years.

With this approach, total global mean emissions of BC in CanAM4.2 are 4.87 Tg year−1 during 1950–1959 and 8.82 Tg year−1 during 2000–2009. The latter agrees well with the CMIP5/RCP data emissions during this time period (available at http://tntcat.iiasa.ac.at:8787/RcpDb/dsd?Action=htmlpage&page=compare).

How-25

ever, differences in regional emission patterns exist owing to improved temporal reso-lution, addition of new emission sectors and other revisions in the updated data set.

(14)

ACPD

15, 18839–18882, 2015

Simulation of black carbon in snow and its climate impact in the Canadian Global

Climate Model

M. Namazi et al.

Title Page

Abstract Introduction

Conclusions References

Tables Figures

◭ ◮

◭ ◮

Back Close

Full Screen / Esc

Printer-friendly Version

Interactive Discussion

Discussion

P

a

per

|

Discussion

P

a

per

|

Discussion

P

a

per

|

Discussion

P

a

per

|

to observations. However, this implies that feedbacks between BC in snow, oceanic heat transport, and sea ice are not accounted for in the simulations. Implications of this approach will be discussed in detail in the following.

Ensemble mean results are used to account for natural atmospheric variability in the simulations. We performed simulations with 8 ensemble members for each of the

con-5

trol and experiment simulations. Note that ocean and sea ice conditions are identical for each ensemble member. This implies that differences in ensemble mean results will represent only the portion of variability of the natural climate system which is associ-ated with variations in atmospheric and land surface processes, disregarding ocean and sea ice processes.

10

2.3 Simulated and observed BC in snow and ice

2.3.1 Deposition of BC

To simulate the BC concentration in snow accurately, we require accurate BC deposi-tion fluxes. Simulated BC deposideposi-tion fluxes were compared to ice core measurements at four locations in Greenland (McConnell et al., 2007; McConnell, 2010; McConnell

15

and Edwards, 2008) during the time period of the simulations. The ice cores were col-lected in 2003 in Greenland at Act2 (66.00◦N, 45.2◦W), D4 (71.4◦N, 43.9◦W), Hum-boldt (78.5◦N, 56.8◦W) and Summit (72.6◦N, 38.3◦W). BC contents in the ice cores were measured with a laser soot photometer (SP2) and were used to derive the depo-sition flux of BC from 1772 to 2003. Annually averaged BC depodepo-sition fluxes from these

20

measurements and CanAM4.2 are shown in Fig. 2. CanAM4.2 reproduces the declin-ing trend in the observed BC deposition flux for Greenland, which may be explained by a decrease in emissions and transport of BC from North America. The model re-sults are in particularly good agreement with measurements at Summit and D4. How-ever, the model underestimates deposition rates at the south-westerly locations and

25

(15)

ACPD

15, 18839–18882, 2015

Simulation of black carbon in snow and its climate impact in the Canadian Global

Climate Model

M. Namazi et al.

Title Page

Abstract Introduction

Conclusions References

Tables Figures

◭ ◮

◭ ◮

Back Close

Full Screen / Esc

Printer-friendly Version

Interactive Discussion

Discussion

P

a

per

|

Discussion

P

a

per

|

Discussion

P

a

per

|

Discussion

P

a

per

|

with local processes either in the atmosphere or in the snow and ice. Moreover, model results are much less variable at these locations.

2.3.2 BC-snow mixing ratio

Extensive data sets of observed BC mass mixing ratios in snow have very recently become available for model validation. Doherty et al. (2010) provides the first large

5

survey of BC snow mass mixing ratios in eight different regions in the Arctic: (1) Arctic Ocean, (2) Canadian Arctic, (3) Alaska, (4) Canadian Sub-Arctic, (5) Greenland, (6) Ny-Ålesund, (7) Tromsø, and (8) Russia in 1998 and 2005–2009. In Wang et al. (2013), 400 snow samples were gathered at 46 sites across northern China in January and February 2010. Finally, a recent field campaign was conducted that included 67 North

10

American sites in 13 American states and 3 Canadian Provinces, Doherty et al. (2014). For all of these studies, vertical profiles of light-absorbing particles in snow in different vertical intervals throughout the snowpack are available. The spectrally-resolved total light absorption of samples was analysed and used to estimate snow BC mass mixing ratios and their contribution to the total absorption by BC and non-BC particles.

15

In Fig. 3, we compare simulated annual mean BC mass mixing ratios in snow with annual mean measurements from the new observational data sets for corresponding grid cells and months. Since simulated results are representative of the top 25 cm of the snowpack, we vertically averaged the available measured profiles for each loca-tion using given interval depths as weights. If multiple measurements were taken on

20

different days in a specific month of a year, we average the measurements over that month. Results from only one model ensemble member are shown. Results from other ensemble members are similar.

As shown in Fig. 3, CanAM4.2 broadly reproduces observed large-scale patterns of high concentrations in China and low concentrations for Greenland. Observations

25

(16)

ACPD

15, 18839–18882, 2015

Simulation of black carbon in snow and its climate impact in the Canadian Global

Climate Model

M. Namazi et al.

Title Page

Abstract Introduction

Conclusions References

Tables Figures

◭ ◮

◭ ◮

Back Close

Full Screen / Esc

Printer-friendly Version

Interactive Discussion

Discussion

P

a

per

|

Discussion

P

a

per

|

Discussion

P

a

per

|

Discussion

P

a

per

|

Siberia causes localized model underestimates for Russia. Concentrations of BC in North America are well reproduced at latitudes above about 50◦N and systematically underestimated at lower latitudes. The mean simulated and measured BC snow con-centrations averaged over all samples temporally and spatially are 35 and 108 ng g−1, respectively and the correlation between model results and observations is 0.84. Note

5

that biases for Chinese sites contribute significantly to the differences in sample mean concentrations, which incompletely reflect conditions in the Northern Hemisphere. De-spite the unprecedented size of the observational data set employed here, a rigorous validation of BC concentrations in snow in global models will require measurements over longer time periods and from additional regions. Note that the large variability in

10

simulated BC concentrations in snow over Arctic Ocean sea ice compared to observa-tion in Fig. 3 can likely be attributed to differences in BC mass budgets in snow over sea ice. This may be related to the omission of advection of sea ice and other processes for snow on sea ice in the model.

Biases in simulated BC snow concentrations are partly related to emissions.

Mod-15

els generally tend to substantially underestimate absorption aerosol optical depth for North American and Asian sites, which has been attributed to a lack of BC emissions in these regions (Koch et al., 2009b; Bond et al., 2013). This is broadly consistent with underestimates of absorption aerosol optical depth and near-surface atmospheric con-centrations of BC in CanAM4.2 in these regions (not shown). Similarly, Kopacz et al.

20

(2011) found that BC concentrations in snow were underestimated in their simulations at Chinese sites. On the other hand, there are no obvious systematic regional biases in BC concentration in snow in the Arctic in models (Bond et al., 2013). Koch et al. (2009a) and Skeie et al. (2011) extended their comparison to include measurements from Forsström et al. (2009) as well.

(17)

ACPD

15, 18839–18882, 2015

Simulation of black carbon in snow and its climate impact in the Canadian Global

Climate Model

M. Namazi et al.

Title Page

Abstract Introduction

Conclusions References

Tables Figures

◭ ◮

◭ ◮

Back Close

Full Screen / Esc

Printer-friendly Version

Interactive Discussion

Discussion

P

a

per

|

Discussion

P

a

per

|

Discussion

P

a

per

|

Discussion

P

a

per

|

3 Change in BC in snow and snow-climate processes between 1950–1959 and

2000–2009

The following analysis of BC in snow and impacts on the cryosphere and climate will fo-cus on the period 2000–2009. Changes since 1950–1959 will also be analyzed. Global anthropogenic BC emissions from fossil and biofuel sources have steadily increased

5

by 73 % from 1950 to 2000 (Lamarque, 2010). This corresponds to about half of the total increase in global anthropogenic BC emissions since 1850.

The mean simulated deposition of BC for 2000–2009 is shown in the top panel of Fig. 4. CanAM4.2 produces local maxima in the deposition flux near the equator due to the proximity of vegetation fire sources and efficient atmospheric BC removal by

10

wet deposition in precipitating cloud systems. Other notable deposition maxima in the Northern Hemisphere are related to emissions from Asia and Europe. A minimum in BC deposition occurs for Greenland, which can be largely attributed to the relatively high elevation of the topography. Simulated BC concentrations in air tend to decrease strongly with altitude in CanAM4.2 in the Arctic which leads to a decreasing efficiency

15

of dry and wet deposition processes with elevation.

Corresponding to increases in global BC emissions, the mean BC deposition flux has increased from 1950–1959 to 2000–2009 with particularly large increases for East and Southeast Asia in Fig. 4. Decreases for North America and Europe reflect reductions in emissions from air quality regulatory activities and technology improvements in these

20

regions. For instance, decreases in amounts of carbonaceous aerosol have been doc-umented based on ice-core measurements in Europe since the 1970s (Legrand et al., 2007) and air sampling across the US during 1990–2004 (Murphy et al., 2011). On the other hand, BC emission from China and the rest of Asia has increased substantially over the four last decades, which largely explains increases in BC deposition for Asia

25

(18)

ACPD

15, 18839–18882, 2015

Simulation of black carbon in snow and its climate impact in the Canadian Global

Climate Model

M. Namazi et al.

Title Page

Abstract Introduction

Conclusions References

Tables Figures

◭ ◮

◭ ◮

Back Close

Full Screen / Esc

Printer-friendly Version

Interactive Discussion

Discussion

P

a

per

|

Discussion

P

a

per

|

Discussion

P

a

per

|

Discussion

P

a

per

|

mostly affected by North American emissions, except during winter. Consequently, sim-ulated trends in BC deposition for Greenland are consistent with trends in emissions from North America. Emissions from Europe and East Asia play a more important role for BC deposition elsewhere in the Arctic (Shindell et al., 2008).

The annual mean BC concentration in snow during 2000–2009 in Fig. 5 is spatially

5

well correlated with the BC deposition flux in Fig. 4, with high BC concentrations in snow in Europe, Russia, China and South and East Asia. In the Arctic, Greenland has the cleanest snow, consistent with low deposition rates. Similar patterns are simulated during the spring season (March–April–May, MAM), which is a particularly important time period for RFs of climate by BC in snow given the high SCE and solar

insola-10

tion in the Northern Hemisphere during this time of the year. Similarly, changes in the concentration of BC in snow and BC deposition fluxes from the 1950s to the 2000s agree well with each other. Large increases in BC deposition fluxes for the Tibetan Plateau and the Himalayas lead to equivalent increases in BC concentrations in snow in these regions, with only relatively small differences between annual mean and MAM.

15

The simulated reduction in BC concentrations in snow in Europe, North America and Greenland agrees with the declining trends in deposition rates for these regions in Fig. 4.

3.1 Radiative forcing

The instantaneous RF of BC in snow (BC present – no BC present) for 2000–2009 and

20

the change in RF due to changes in BC concentrations in snow between 1950–1959 and 2000–2009 are shown in Fig. 6. Changes that are significant at 95 % confidence level according to a student-ttest are hatched, based on a model ensemble of 8 mem-bers (bottom panels). The changes in RF agree broadly with changes in BC in snow shown in Fig. 5 with stronger (weaker) RF change for higher (lower) concentrations.

25

(19)

(an-ACPD

15, 18839–18882, 2015

Simulation of black carbon in snow and its climate impact in the Canadian Global

Climate Model

M. Namazi et al.

Title Page

Abstract Introduction

Conclusions References

Tables Figures

◭ ◮

◭ ◮

Back Close

Full Screen / Esc

Printer-friendly Version

Interactive Discussion

Discussion

P

a

per

|

Discussion

P

a

per

|

Discussion

P

a

per

|

Discussion

P

a

per

|

nual) and 0.080 W m−2(MAM). The mean RF in the Arctic north of 60

N is 0.140 W m−2

(annual) and 0.317 W m−2(MAM).

Increases in global mean BC concentrations in snow between 1950–1959 and 2000– 2009 lead to increases in global RF of 0.011 W m−2(annual) and 0.008 W m−2(MAM).

The mean change in RF in the Arctic is 0.003 for (annual) and−0.004 W m−2 (MAM). 5

Statistically significant RF reductions for Europe, North America and Greenland are consistent with reductions in BC concentrations in snow in these regions and are in contrast to an increase in RF for large portions of Asia, especially in MAM. Increases in RF are most pronounced for the Himalayas and Tibetan Plateau because of high BC deposition fluxes and long persistence of SCE into the year in these regions. Given the

10

large magnitude of the RF, an intensification of glacial snow melt in these regions by BC in snow as observed in Lau et al. (2010) and modelled in Flanner et al. (2009) seems plausible. However, the horizontal resolution of CanAM4.2 is insufficient for a more detailed analysis of forcing changes and processes in these regions.

In comparison, other studies estimate present-day global mean RF of BC in snow

15

from all BC sources to be between+0.01 to+0.08 W m−2(Flanner et al., 2007, 2009; Hansen et al., 2007a; Koch et al., 2009a; Rypdal et al., 2009b; Skeie et al., 2011; Wang et al., 2011; Lee et al., 2013b), with a best estimate of 0.04 W m−2in Bond et al. (2013), which agrees well with our results (0.045 W m−2). In a study of the Aerosol Compar-isons between Observations and Models (AeroCom) project (Jiao et al., 2014) a range

20

of Arctic RF from 0.06 to 0.28 W m−2 was reported. Note that different BC emission inventories are used in different studies and results also often refer to different years. In addition to the BC in snow, some models also account for BC in sea-ice. Moreover, differences in diagnostic calculations of RF also exist. All these factors contribute to differences in RF estimates.

25

(20)

feed-ACPD

15, 18839–18882, 2015

Simulation of black carbon in snow and its climate impact in the Canadian Global

Climate Model

M. Namazi et al.

Title Page

Abstract Introduction

Conclusions References

Tables Figures

◭ ◮

◭ ◮

Back Close

Full Screen / Esc

Printer-friendly Version

Interactive Discussion

Discussion

P

a

per

|

Discussion

P

a

per

|

Discussion

P

a

per

|

Discussion

P

a

per

|

backs (Sect. 1). Based on an efficacy of BC in snow of 3 and an equilibrium climate sensitivity of 3.37◦C (Andrews et al., 2012), our estimate of global mean RF of BC in snow implies a global mean equilibrium temperature change of 0.03◦C which is asso-ciated with changes in BC in snow between 1950–1959 and 2000–2009.

3.2 Impacts of BC in snow on cryosphere and climate

5

In an analysis strategy similar to the previous sections, the impacts of changes of BC concentrations in snow between 1950–1959 and 2000–2009 on the cryosphere will be investigated. Recall that climatological mean BC in snow from the 1950s replaces the actual BC in snow in the EXP run.

The middle panel of Fig. 7 shows the effect of the change in BC snow concentrations

10

between 1950–1959 and 2000–2009 on shortwave broadband surface albedos. Note that surface albedo is calculated from reflected and absorbed radiative fluxes at the surface. Although physically coherent and statistically significant changes in RF of BC in snow were found (Fig. 6), changes in surface albedo are weak and not statistically significant. There is a strong reduction near the Himalayas and Tibetan Plateau, which

15

is associated with increasing BC deposition over time in these areas. Local patterns in albedo changes generally do not agree well with changes in RF of BC in snow. The weak response of surface albedos to BC radiative forcings in snow in Fig. 7 can be attributed to variations in snow processes in the simulations which arise from natu-ral variations in amount and properties of snow in the Northern Hemisphere that are

20

associated with precipitation and temperature (Brown and Robinson, 2011). Owing to large simulated variations in snow properties, impacts of BC in snow on surface albedo are very small and negligible for almost all regions. This is also apparent from results of individual ensemble members (not shown). Therefore, the results generally give no indication of large positive feedbacks of snow albedo to BC in snow, with the notable

25

exception of the region comprising the Himalayas and Tibetan Plateau.

(21)

sub-ACPD

15, 18839–18882, 2015

Simulation of black carbon in snow and its climate impact in the Canadian Global

Climate Model

M. Namazi et al.

Title Page

Abstract Introduction

Conclusions References

Tables Figures

◭ ◮

◭ ◮

Back Close

Full Screen / Esc

Printer-friendly Version

Interactive Discussion

Discussion

P

a

per

|

Discussion

P

a

per

|

Discussion

P

a

per

|

Discussion

P

a

per

|

stantial (Fig. 7, bottom panel). Significant reductions in sea ice fraction and snow cover fraction (SCF) over Europe and Northern Asia lead to significant reductions in surface albedos, as will be further discussed in the following. There is no obvious relationship between changes in surface albedo and BC in snow for most of the regions. However, for the Himalayas and Tibetan Plateau, the changes in surface albedos are similar to

5

changes in surface albedos induced by BC in snow. This indicates that cryospheric changes in these regions during the time period of the simulation may have been sub-stantially affected by changes in BC in snow. However, confidence in these results is low given the low resolution of the model.

Although impacts of changes in BC in snow on surface albedos are not statistically

10

significant and therefore unlikely to affect local climate processes systematically, we analyzed changes in SCF and surface air temperature for consistency and complete-ness.

As expected, there are no statistically robust changes in annual SCF that are associ-ated with changes of BC in snow (Fig. 8, middle panel). Reductions of SCF in Eurasia

15

and increases of SCF in North America (NA) appear to be broadly consistent with BC emissions increase in Eurasia and reduction in NA but they are not statistically signif-icant. However, the simulated increase in SCF in northern Russia is counter-intuitive because BC concentration has increased from 1950s to 2000s. The reductions in SCF in the Himalayas and Tibetan Plateau are consistent with an accumulation of BC in

20

snow in these regions. In comparison, significant reductions in SCF in the control run between 1950s and 2000s in the Northern Hemisphere, especially near the bound-aries of the Arctic ocean, Eurasia and Northern Asia, can be largely attributed to the specified reductions in sea ice fraction and increasing SSTs between these decades (Fig. 8, bottom panel). These results are broadly consistent with observation in Déry

25

and Brown (2007) which show that SCF in Eurasia and North America during spring 1979–2008 has decreased by 13.5 and 6 %, respectively, since 1968–1978.

(22)

ACPD

15, 18839–18882, 2015

Simulation of black carbon in snow and its climate impact in the Canadian Global

Climate Model

M. Namazi et al.

Title Page

Abstract Introduction

Conclusions References

Tables Figures

◭ ◮

◭ ◮

Back Close

Full Screen / Esc

Printer-friendly Version

Interactive Discussion

Discussion

P

a

per

|

Discussion

P

a

per

|

Discussion

P

a

per

|

Discussion

P

a

per

|

despite a similar global RF of 0.054 W m−2(1998) and 0.049 W m−2 (2001), and

emis-sions of 8.80 Tg year−1 (1998) and 6.70 Tg year−1 (2001), according to Flanner et al. (2007). The differences between this and our study can at least be partly attributed to the fact that the earlier study addressed total impacts of all present-day BC emissions whereas we focus on impacts of emission changes from the 1950s to 2000s here. For

5

instance, present-day emissions from vegetation fires are large and have only slightly increased since pre-industrial times (Lamarque, 2010) and therefore produce only mi-nor contributions to changes in BC in snow since the end of the 19th century. In another study, Koch et al. (2009a) attributed a reduction in snow and ice cover extent of 1.2 % in the Arctic from 1890 to 1995 to radiative forcing by black carbon in snow based

10

on equilibrium simulations with an atmospheric model coupled to a slab ocean model. However, in a more recent study of transient climate change with a fully coupled climate model, Koch et al. (2011) concluded that the darkening of snow albedos by BC has not caused recent snow cover and sea ice extent Arctic losses, with simulated changes in global (Arctic) snow cover and sea ice extent of−0.06 % (−0.26 %) and 0.02 % (0.33 %) 15

for 1890s to 1990s and 1970s to 1990s, respectively. They argued that fully coupled transient simulation produces smaller aerosol impacts on climate by accounting for moderating effects of ocean heat uptake on simulated temperature changes.

Changes in BC in snow are not generally associated with any statistically robust changes in surface air temperature in CanAM4.2 (Fig. 9). Locally, the warming is

con-20

siderable for the Himalayas and Tibetan Plateau, consistent with BC snow concentra-tion and albedo changes in these regions.

In contrast, significant warming is simulated in the control run with all greenhouse gas and aerosol radiative forcings in large portions of the Northern Hemisphere between 1950–1959 and 2000–2009. The increase in simulated Arctic (global) mean surface air

25

(23)

ACPD

15, 18839–18882, 2015

Simulation of black carbon in snow and its climate impact in the Canadian Global

Climate Model

M. Namazi et al.

Title Page

Abstract Introduction

Conclusions References

Tables Figures

◭ ◮

◭ ◮

Back Close

Full Screen / Esc

Printer-friendly Version

Interactive Discussion

Discussion

P

a

per

|

Discussion

P

a

per

|

Discussion

P

a

per

|

Discussion

P

a

per

|

forcing of BC in snow are omitted for the latter, although they are likely to be very small (Sect. 3.1).

Similar to results for SCF discussed earlier, our simulated changes in near-surface air temperature do not agree with warming trends due to BC in snow according to Flan-ner et al. (2007, 2009) and Koch et al. (2009a). The simulated Arctic (global) ensemble

5

mean temperature response to BC in snow in our simulations is−0.007 (−0.001)◦C in the annual mean and−0.027 (−0.019)◦C for MAM. This yields a temperature change

per unit of emission flux close to 0◦C year Tg−1. In comparison, the Arctic (global) an-nual mean equilibrium temperature response from total BC in snow was estimated as 1.61 (0.15) and 0.50 (0.10)◦C for 1998 and 2001, respectively (Flanner et al., 2007,

10

2009), corresponding to a global mean temperature change per unit of emission flux of 0.015–0.017◦C year Tg−1. According to Koch et al. (2009a), BC in snow has caused an increase in temperature of 0.5 (0.2)◦C in the Arctic (global) over the twentieth century based on equilibrium climate simulations. However, Koch et al. (2011) simulated tran-sient Arctic (global) temperature changes of BC in snow of+0.20 (−0.03) and −0.17 15

(−0.02)◦C for 1890s–1990s and 1970s–1990s, respectively. Clearly, the magnitude of

the simulated temperatures response depends on the choice of time period and asso-ciated changes in emissions in these studies. Temperature responses to changes in BC in snow are affected by substantial variability in climate and are poorly constrained in models.

20

The net impact of changes in concentrations of BC in snow on snow albedos de-pends on the magnitude of snow albedo feedbacks, which determine how strongly sur-face warming is amplified through a reduction in sursur-face albedo resulting from warm-ing or meltwarm-ing snow (Qu and Hall, 2007). Fletcher et al. (2015) showed that climate models generally reproduce observation-based estimates of snow albedo feedbacks

25

(24)

ACPD

15, 18839–18882, 2015

Simulation of black carbon in snow and its climate impact in the Canadian Global

Climate Model

M. Namazi et al.

Title Page

Abstract Introduction

Conclusions References

Tables Figures

◭ ◮

◭ ◮

Back Close

Full Screen / Esc

Printer-friendly Version

Interactive Discussion

Discussion

P

a

per

|

Discussion

P

a

per

|

Discussion

P

a

per

|

Discussion

P

a

per

|

version of the model configuration used here produces a net snow albedo feedback that is about 20 % weaker than observed, which can likely be attributed to a weak response of the temperature sensitive component of the total snow albedo feedback (C. G. Fletcher, personal communication, 2015). This could potentially lead to a rela-tively weak response of surface albedos to changes in BC in snow in the simulations

5

presented here. Impacts of BC in snow on snow albedo in CanAM4.2 have not yet been compared to results from other models and observations. It is therefore unclear how realistic impacts of BC in snow on snow albedos in CanAM4.2 are.

4 Conclusions

The effect of black carbon (BC) in the current version of Canadian Global Climate

10

Model (CanAM4.2) was investigated. The modelling approach accounts for snow meta-morphism and BC concentration in snow, which affect snow albedo. We validated our models by comparing the estimated BC deposition and BC mixing ratio against ex-tensive field measurements, which produced good agreement. We estimated annual global and Arctic mean radiative forcings of BC in snow during 2000–2009 of 0.04

15

and 0.14 W m−2, respectively, within the range reported by previous studies. Although the radiative forcing due to BC in snow is locally large and comparable to other studies, changes in BC concentrations in snow between 1950s to 2000s generally do not lead to any statistically significant changes in surface albedo, snow cover fraction, and surface air temperature based on simulations using eight ensemble members. Furthermore,

20

we demonstrate that the simulated changes are much weaker than changes caused by greenhouse gas and other aerosol radiative forcings during these decades.

Results from our study do not agree with results from some of the earlier studies which indicated large impacts of total BC in snow on snow cover extent and surface air temperature. This may be partly related to differences in magnitudes of transient and

25

(25)

ACPD

15, 18839–18882, 2015

Simulation of black carbon in snow and its climate impact in the Canadian Global

Climate Model

M. Namazi et al.

Title Page

Abstract Introduction

Conclusions References

Tables Figures

◭ ◮

◭ ◮

Back Close

Full Screen / Esc

Printer-friendly Version

Interactive Discussion

Discussion

P

a

per

|

Discussion

P

a

per

|

Discussion

P

a

per

|

Discussion

P

a

per

|

snow albedo feedbacks in models potentially contributes to differences in responses in climate to changes in BC concentrations in snow. Consequently, more rigorous model comparisons with focus on snow albedos and snow albedo feedback processes would be useful in the future.

Acknowledgements. This research was supported by Environment Canada, Natural Sciences

5

and Engineering Research Council of Canada (NSERC), and joint EC/NSERC-funded “Net-work on Climate and Aerosols: Addressing Key Uncertainties in Remote Canadian Envi-ronments (NETCARE)”. Funding for the development of the ECLIPSE emission data set was provided by the European Union Seventh Framework Programme (FP7/2007–2013) un-der grant agreement no 282688 – ECLIPSE. Emission data sets are available from http:

10

//www.geiacenter.org/access (ECLIPSE), http://www.globalfiredata.org/data.html (GFED), and http://tntcat.iiasa.ac.at:8787/RcpDb/dsd?Action=htmlpage&page=about (RCP). We would like to thank Mark Flanner, Chris Fletcher, Chad Thackeray, Greg Flato, and Diana Verseghy for providing very useful comments on the manuscript. Furthermore, we would like to thank Sarah Doherty who provided BC mixing ratio measurements, Florent Domine and Chris Derksen who

15

provided the measurements of effective radius of snow, and Mark Flanner who provided lookup tables for parameterizations of dry snow aging.

References

Andrews, T., Gregory, J. M., Webb, M. J., and Taylor, K. E.: Forcing, feedbacks and climate sensitivity in CMIP5 coupled atmosphere-ocean climate models, Geophys. Res. Lett., 39,

20

L09712, doi:10.1029/2012GL051607, 2012. 18858

Aoki, T., Kuchiki, K., Niwano, M., Kodama, Y., Hosaka, M., and Tanaka, T.: Physically based snow albedo model for calculating broadband albedos and the solar heating profile in snowpack for general circulation models, J. Geophys. Res., 116, D11114, doi:10.1029/2010JD015507, 2011. 18846

25

(26)

ACPD

15, 18839–18882, 2015

Simulation of black carbon in snow and its climate impact in the Canadian Global

Climate Model

M. Namazi et al.

Title Page

Abstract Introduction

Conclusions References

Tables Figures

◭ ◮

◭ ◮

Back Close

Full Screen / Esc

Printer-friendly Version

Interactive Discussion

Discussion

P

a

per

|

Discussion

P

a

per

|

Discussion

P

a

per

|

Discussion

P

a

per

|

Bartlett, P. A., Mackay, M. D., and Verseghy, D. L.: Modified snow algorithms in the Canadian Land Surface Scheme: model runs and sensitivity analysis at three boreal forest stands, Atmos. Ocean, 44, 207–222, 2006. 18843

Bäumer, D., Lohmann, U., Lesins, G., Li, J., and Croft, B.: Parameterizing the optical proper-ties of carbonaceous aerosols in the Canadian Centre for Climate Modeling and Analysis

5

Atmospheric General Circulation Model with impacts on global radiation and energy fluxes, J. Geophys. Res.-Atmos., 112, D10207, doi:10.1029/2006JD007319, 2007. 18845

Bond, T. C. and Bergstrom, R. W.: Light absorption by carbonaceous particles: an investigative review, Aerosol Sci. Tech., 40, 27–67, 2006. 18845

Bond, T. C., Bhardwaj, E., Dong, R., Jogani, R., Jung, S. K., Roden, C., Streets, D. G., and

Traut-10

mann, N. M.: Historical emissions of black and organic carbon aerosol from energy-related combustion, 1850–2000, Global Biogeochem. Cy., 21, Gb2018, doi:10.1029/2006gb002840, 2007. 18840

Bond, T. C., Doherty, S. J., Fahey, D. W., Forster, P. M., Berntsen, T., DeAngelo, B. J., Flan-ner, M. G., Ghan, S., Kärcher, B., Koch, D., Kinne, S., Kondo, Y., Quinn, P. K., Sarofim, M. C.,

15

Schultz, M. G., Schulz, M., Venkataraman, C., Zhang, H., Zhang, S., Bellouin, N., Gut-tikunda, S. K., Hopke, P. K., Jacobson, M. Z., Kaiser, J. W., Klimont, Z., Lohmann, U., Schwarz, J. P., Shindell, D., Storelvmo, T., Warren, S. G., and Zender, C. S.: Bounding the role of black carbon in the climate system: a scientific assessment, J. Geophys. Res.-Atmos., 118, 5380–5552, doi:10.1002/jgrd.50171, 2013. 18854, 18857

20

Brown, R., Bartlett, P., Mackay, M., and Verseghy, D.: Estimation of snow cover in CLASS for SnowMIP, Atmos. Ocean, 44, 223–238, 2006. 18843, 18845

Brown, R. D. and Robinson, D. A.: Northern Hemisphere spring snow cover variability and change over 1922–2010 including an assessment of uncertainty, The Cryosphere, 5, 219– 229, doi:10.5194/tc-5-219-2011, 2011. 18858

25

Brun, E.: Investigation on wet-snow metamorphism in respect of liquid-water content, Ann. Glaciol., 13, 22–26, 1989. 18847

Clarke, A. and Noone, K.: Soot in the Arctic: a cause for perturbation in radiative transfer, J. Geophys. Res., 19, 2045–2053, 1985. 18841

Cole, J., Namazi, M., von Salzen, K., and Barker, H.: A new snow albedo parameterization

30

(27)

ACPD

15, 18839–18882, 2015

Simulation of black carbon in snow and its climate impact in the Canadian Global

Climate Model

M. Namazi et al.

Title Page

Abstract Introduction

Conclusions References

Tables Figures

◭ ◮

◭ ◮

Back Close

Full Screen / Esc

Printer-friendly Version

Interactive Discussion

Discussion

P

a

per

|

Discussion

P

a

per

|

Discussion

P

a

per

|

Discussion

P

a

per

|

Conway, H., Gades, A., and Raymond, C. F.: Albedo of dirty snow during conditions of melt, Water Resour. Res., 32, 1713–1718, doi:10.1029/96WR00712, 1996. 18849, 18850

Croft, B., Lohmann, U., and von Salzen, K.: Black carbon ageing in the Canadian Centre for Climate modelling and analysis atmospheric general circulation model, Atmos. Chem. Phys., 5, 1931–1949, doi:10.5194/acp-5-1931-2005, 2005. 18844

5

Derksen, C., Toose, P., Lemmetyinen, J., Pulliainen, J., Langlois, A., Rutter, N., and Fuller, M.: Evaluation of passive microwave brightness temperature simulations and snow water equiv-alent retrievals through a winter season, Remote Sens. Environ., 117, 236–248, 2012. 18873 Déry, S. J. and Brown, R. D.: Recent Northern Hemisphere snow cover extent trends and implications for the snow-albedo-feedback, Geophys. Res. Lett., 34, L22504,

10

doi:10.1029/2007GL031474, 2007. 18842, 18859

Doherty, S. J., Warren, S. G., Grenfell, T. C., Clarke, A. D., and Brandt, R. E.: Light-absorbing im-purities in Arctic snow, Atmos. Chem. Phys., 10, 11647–11680, doi:10.5194/acp-10-11647-2010, 2010. 18841, 18849, 18850, 18853

Doherty, S. J., Dang, C., Hegg, D. A., Zhang, R., and Warren, S. G.: Black carbon and other

15

light-absorbing particles in snow of central North America, J. Geophys. Res.-Atmos., 119, 12807–12831, doi:10.1002/2014JD022350, 2014. 18853

Domine, F., Albert, M., Huthwelker, T., Jacobi, H.-W., Kokhanovsky, A. A., Lehning, M., Pi-card, G., and Simpson, W. R.: Snow physics as relevant to snow photochemistry, Atmos. Chem. Phys., 8, 171–208, doi:10.5194/acp-8-171-2008, 2008. 18846

20

Domine, F., Gallet, J. C., Bock, J., and Morin, S.: Structure, specific surface area and ther-mal conductivity of the snowpack around Barrow, Alaska, J. Geophys. Res., 117, D00R14, doi:10.1029/2011JD016647, 2012. 18873

Flanner, M. and Zender, C.: Linking snowpack microphysics and albedo evolution, J. Geophys. Res., 111, D12208, doi:10.1029/2005JD006834, 2006. 18841, 18846, 18847

25

Flanner, M. G., Zender, C. S., Randerson, J. T., and Rasch, P. J.: Present-day cli-mate forcing and response from black carbon in snow, J. Geophys. Res., 112, 202, doi:10.1029/2006JD008003, 2007. 18841, 18842, 18845, 18847, 18849, 18850, 18857, 18860, 18861, 18874

Flanner, M. G., Zender, C. S., Hess, P. G., Mahowald, N. M., Painter, T. H., Ramanathan, V.,

30

Imagem

Table 1. Observed and simulated e ff ective radius of snow in surface snow.
Figure 1. Response of snow albedo to the presence of BC, relative to pristine snow, for different snow grain effective radius
Figure 2. Measured and modelled black carbon (BC) deposition flux in ice cores in Greenland at Summit (72.6 ◦ N, 38.3 ◦ W) (top left), D4 (71.4 ◦ N, 43.9 ◦ W) (top right), Humboldt (78.5 ◦ N, 56.8 ◦ W) (bottom left) and Act2 (66.0 ◦ N, 45.2 ◦ W) (bottom ri
Figure 3. Comparison of measured and modelled BC in snow in log-scale scatter plot. The measurements are vertically averaged over depth for the top 25 cm and compared to simulated results over the same grid-box and month.
+7

Referências

Documentos relacionados

With the help of a global climate model (CAM5) in which black carbon (BC) emitted from different source regions can be explicitly tracked, we are able to characterize BC

In this connection, the present study aims to present an epidemiological analysis of accidents involving scorpions in Brazil, in the period from 2000 to

In this connection, the present study aims to present an epidemiological analysis of accidents involving scorpions in Brazil, in the period from 2000 to

Important gut homing receptors expressed in lymphocytes are α4β7, CCR9 and αEβ7, which in contact with their ligands in the small intestinal epithelial cells results in their

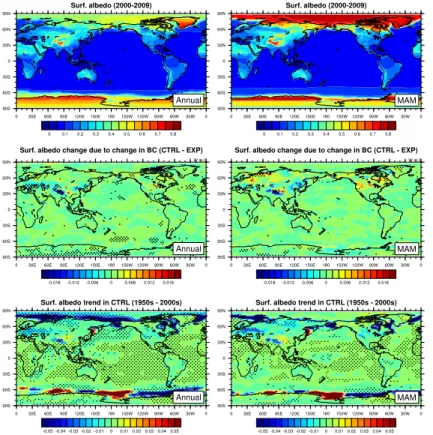
mean (middle right) surface albedo changes due to BC in snow from the 1950s to 2000s, and annual mean (bottom left) and spring mean (bottom right) surface albedo changes due to

MODIS MOD10A1 fractional snow-covered area and MODSCAG fractional snow cover products are utilized to detect spatial and temporal changes in snow- pack after the 2007 Moonlight Fire
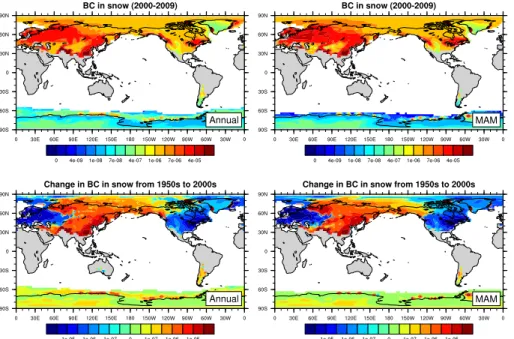
Therefore, both the additive variance and the deviations of dominance contribute to the estimated gains via selection indexes and for the gains expressed by the progenies

Three experiments were carried out, one for each tree species studied: “Jatobá” ( Hymenaea courbaril ), “Canafístula” ( Peltophorum dubium ) and “Óleo Bálsamo” (